Hyperliquid Sheds Almost 12%, But Eyes Quick Recovery. Will it Happen This Week?

0
0
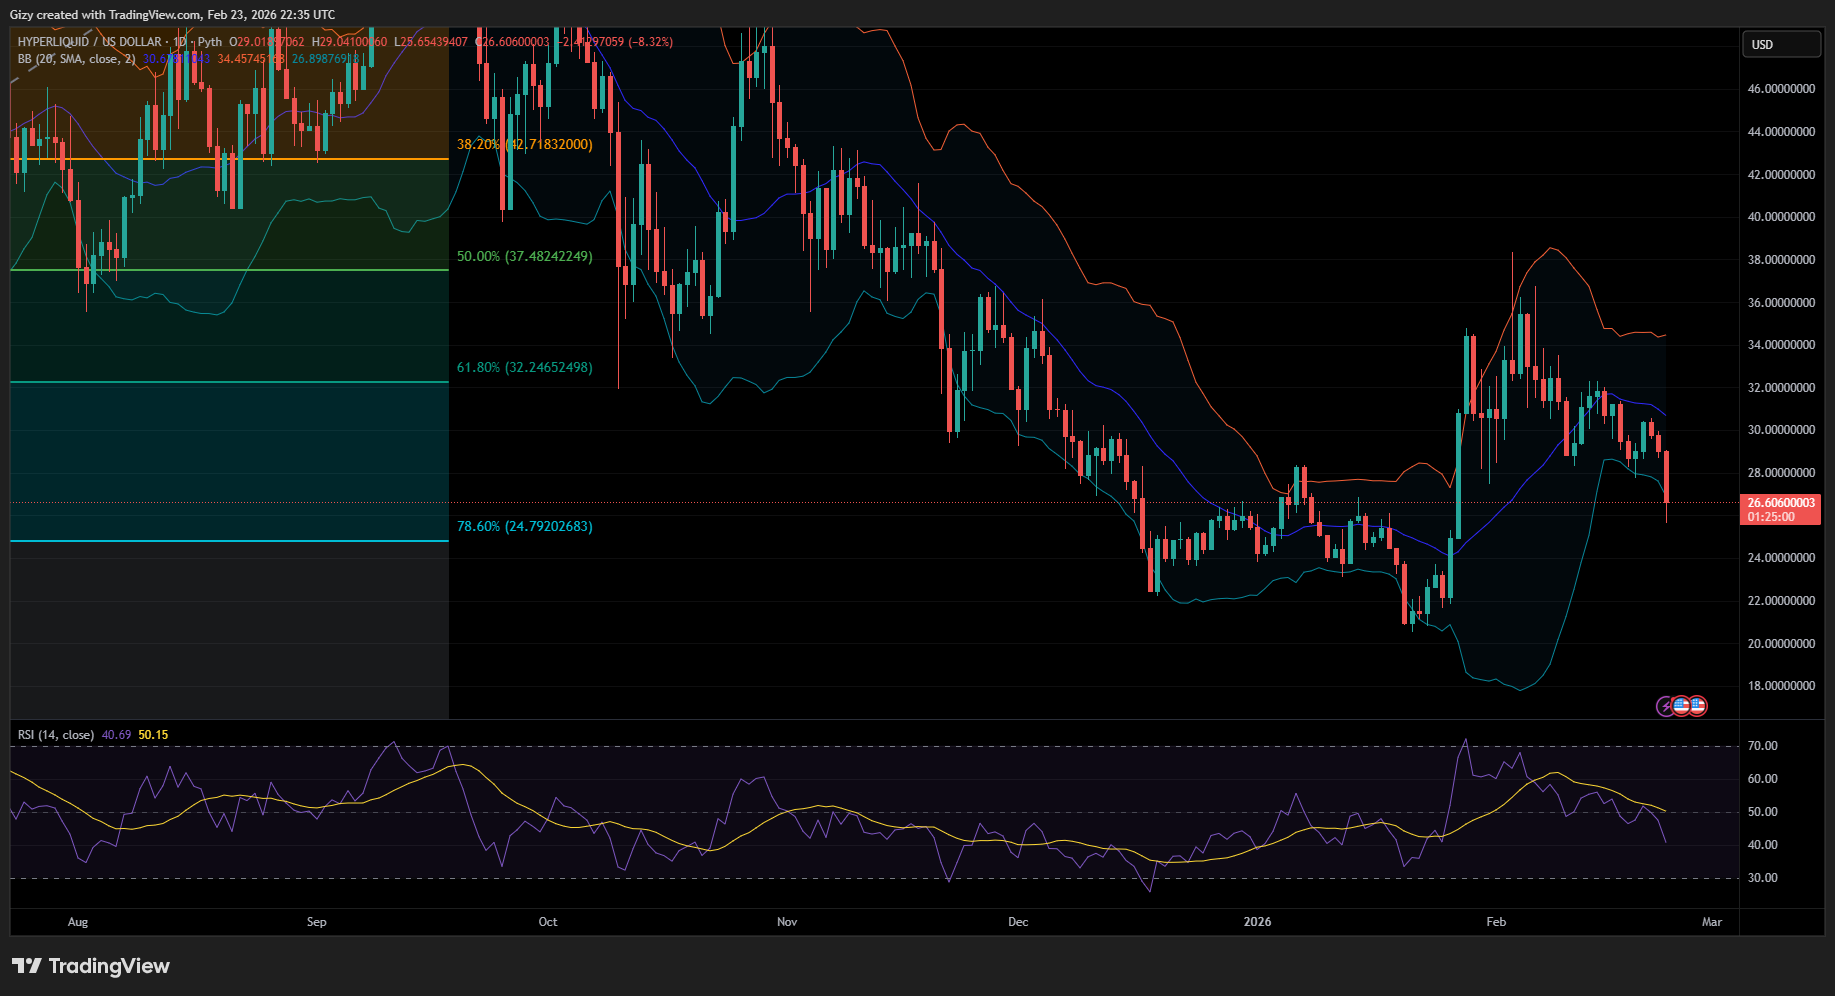
Hyperliquid recently retraced to $25.6, shedding over 11%, but is trading slightly higher at the time of writing.
It opened the day at $29 and plummeted with the rest of the market. However, the 1-day chart shows that the altcoins have been on a downtrend over the last two days. It had a volatile weekend, shedding over 4% cumulatively.
HYPE started its decline on Saturday, after a 4% increase the previous day, wiping out the gains in a two-day downturn that followed. As a result of these actions, the week ended with losses exceeding 5%. A closer look at the 1-week chart shows that the previous seven-day period marked its second consecutive red.
The bears are pushing for a third with a notable decline on Monday. Hyperliquid is down by over 8% following its recent recovery. However, the pullback is not rapid, indicating that the bulls have yet to stage a massive rally to push prices higher.
The recent drop below $26 is unsurprising, as a previous analysis predicted it. It noted that the asset broke above bollinger’s upper band on the 1-day chart, signaling a possible end to the uptrend. It added that the RSI was above 70, indicating that the altcoin was overbought and due for correction.
Additionally, the moving average convergence divergence had a bearish crossover a few days later. With all indicators flashing red signals, a massive decline was almost inevitable.
Interestingly, since prices retraced to the set target, some metrics have flipped bullish. One such is the relative strength index, which has been declining for more than twenty days. Recall that it was above 70 a few days ago; it is currently at 40. While the current reading shows a spike in selling pressure, a closer look at the chart reveals that the metric rebounded around this level.
Hyperliquid Reclaims Key Level
Previous price movement shows several attempts at the $28.4 support, with one ending in brief success. The recent decline saw Hyperliquid drop below this key level. It also broke through the key level and hit a new 30-day low.
Since losing this key level, the altcoin may continue to decline as the bulls scramble to find another support level. Nonetheless, the 1-day chart shows another critical mark to watch: $26.
When HYPE grappled with selling pressure around $25, it struggled to break above $26 as the bears stepped in. Since flipping, the bulls have staged rallies above the mark. However, the recent drop to $25.7 suggest that buyers will defend the mark.
If the altcoin prints a new candle above the support, it will signal a further pullback ahead. It may soon erase the losses it earlier incurred. Nonetheless, if they fail to defend the mark, a drop to $23 is likely.
The bollinger bands also indicate a trend change. Hyperliquid dropped below the lower band a few hours ago and has remained there since. As the breakout from the upper band signalled the end of its uptrend, the recent action may also indicate the end of the downtrend.
The asset will look to resume trading within the bands and reclaim the SMA. This will mean a surge to $30 in the coming days.
The post Hyperliquid Sheds Almost 12%, But Eyes Quick Recovery. Will it Happen This Week? appeared first on CoinTab News.
0
0

 Manage all your crypto, NFT and DeFi from one place
Securely connect the portfolio you’re using to start.


0
0