
Solana Price Prediction: Can SOL Really Reach $150 After Breakout?

0
0
Solana is having a strong week. The SOL price sits at $112.73 today, up 3.76% in the latest reading. Last week alone, Solana gained close to 10.70%. Traders are now asking one question. Can Solana keep climbing toward $150?
This article looks at the numbers, the chart, and the news driving the move, so you can see why SOL is trending today.
What is the Solana price today?
Solana (SOL) is trading around $112.73 at the time of writing. Its market cap stands at $66.02 billion, with a circulating supply of 587.43 million SOL out of a total supply of 634.45 million.
Spot trading volume over 24 hours is $761.92 million, while futures volume is much higher at $8.44 billion. Open interest has grown by 2.51% to reach $6.82 billion.
Is Solana bullish or bearish right now?
The long/short ratio sits just above neutral at 1.0036. On Binance, SOL/USDT accounts show a stronger long bias at 1.7442, and top traders lean even more bullish, with a positions ratio of 2.2628.
On OKX, the SOL long/short ratio for accounts sits at 1.74, also favoring longs.
Options data tells a similar story. Options volume jumped 40.92% to $17.08 million, and options open interest rose 2.67% to $180.48 million. Rising options activity alongside a price breakout often points to growing trader interest.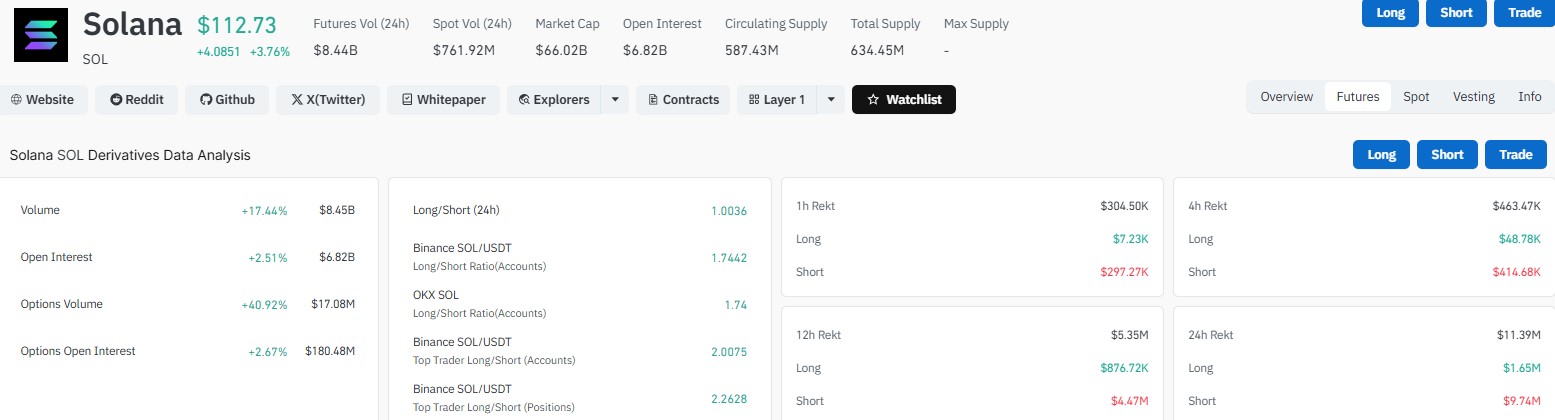
Why is Solana price up today?
A few things are pushing SOL higher this week.
Tokenized equities hit a new high. Solana announced that its tokenized equities ecosystem reached 850,000 unique on-chain holders. This is an all-time high. More holders usually means more trust in the network.
ETF inflows keep coming. SOL Exchange-Traded Funds saw $13.19 million in inflows last week. This marks 12 straight weeks of positive flows since early July. Steady inflows can support price over time.
Short sellers are getting squeezed. Liquidation data backs this up across every timeframe. In the last hour, $304.50K in shorts were liquidated versus $7.23K in longs.
Over 4 hours, shorts lost $414.68K against $48.78K in longs. Over 12 hours, shorts lost $4.47 million versus $876.72K in longs.
Over the full 24 hours, total liquidations reached $11.39 million, with $9.74 million from shorts and just $1.65 million from longs. This shows short traders have been under heavy pressure all day.
What does the Solana price chart show?
The SOL/USDT daily chart shows a clear pattern. Price broke out of a long, sideways channel that lasted from around May through August.
After the breakout, Solana made a fast move from roughly $75 to $113. It then pulled back into a small descending channel. This week, it broke above that channel too.
If this pattern plays out, the chart points to a measured move toward the $150 to $155 zone. That lines up with the marked target on the setup.
Level | Price Zone | What It Means |
Key support | $110 – $113 | Must hold to keep the breakout alive |
Next resistance | $120 – $125 | First test after breakout |
Mid target | $135 – $140 | Second leg up if momentum holds |
Upside target | $150 – $155 | Measured move target |
Weak zone | $100 – $105 | Loss here would hurt the pattern |
Danger zone | $95 – $100 | A breakout would be invalidated below this |
Some chart watchers also point to $103 to $105 as a support shelf, with $117 marked as a Fibonacci resistance level to watch on the way up.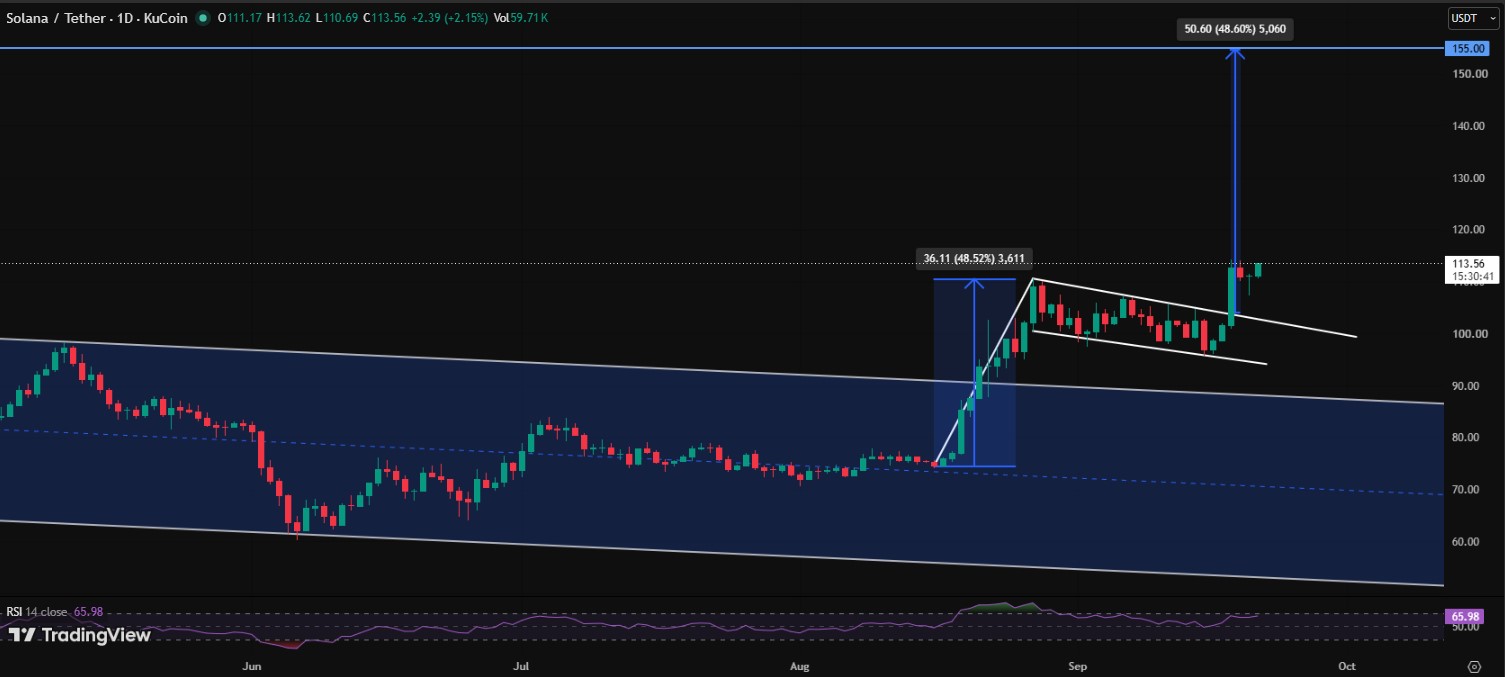
Will Solana price go down? Key risks to watch
Nothing in crypto moves in a straight line. A few risks stand out.
If SOL falls back below $100 to $105, the breakout structure would weaken. That could pull price back toward the $95 to $100 area.
Broader market mood also matters. Wider crypto market swings tend to drag altcoins like Solana along with them, for better or worse.
Where is Solana price headed next?
Solana looks technically strong this week. The breakout, rising ETF inflows, and growing tokenized equity holders all support the bullish case. A move toward $150 to $155 is on the table if $110 to $113 holds as support.
That said, price predictions are not guarantees. Crypto markets can reverse fast, and traders should watch the $100 to $105 zone closely for signs of weakness.
Disclaimer
This article is for informational purposes only and should not be considered financial or investment advice. Cryptocurrency prices are highly volatile and speculative. Always do your own research and consult a licensed financial advisor before making any investment decisions. Past performance does not guarantee future results.
0
0

 Gerencie todo seu criptograma, NFT e DeFi de um só lugar
Conecte com segurança o portfólio que você está usando para começar.


