Bitcoin, Ethereum, & Ripple Price Analysis: Bitcoin Returns To $13,000 Support But ETH and XRP Seem To Be Struggling - Where To Next?
1
0
Key Highlights:
- Bitcoin has moved sideways over the past 7 days as it trades along with the $13,000 level.
- Ethereum dropped by a sharp 7% this week as it breaks back beneath $400.
- XRP also dropped by 7.6% this week as it hits the $0.24 level.
Obviously, nothing can continuously go up forever. There has to be pullbacks and retracements for Bitcoin to continue making its way toward $14,000 and $15,000 - and that is all we are seeing right now. The coin is a long way away from turning bearish and only a drop beneath $12,000 would turn this thing neutral so we do not have to start worrying right now.After an extraordinary surge over the past fortnight, it seems that Bitcoin has started to cool off ever-so-slightly. The coin is now trading exactly where it was trading a week ago but still remains above the $13,000 level.
However, these pullbacks do provide us with opportunities to enter at lower prices. What is interesting is the fact that around $800 million in options are set to expire tomorrow. It is important for the bulls to defend the $13,000 level before these options expiring to prevent Bitcoin from spiraling downward.
Let us take a look at the top 3 coins and provide some areas of strong support and resistance moving forward.
Bitcoin Price Analysis
What has been going on?
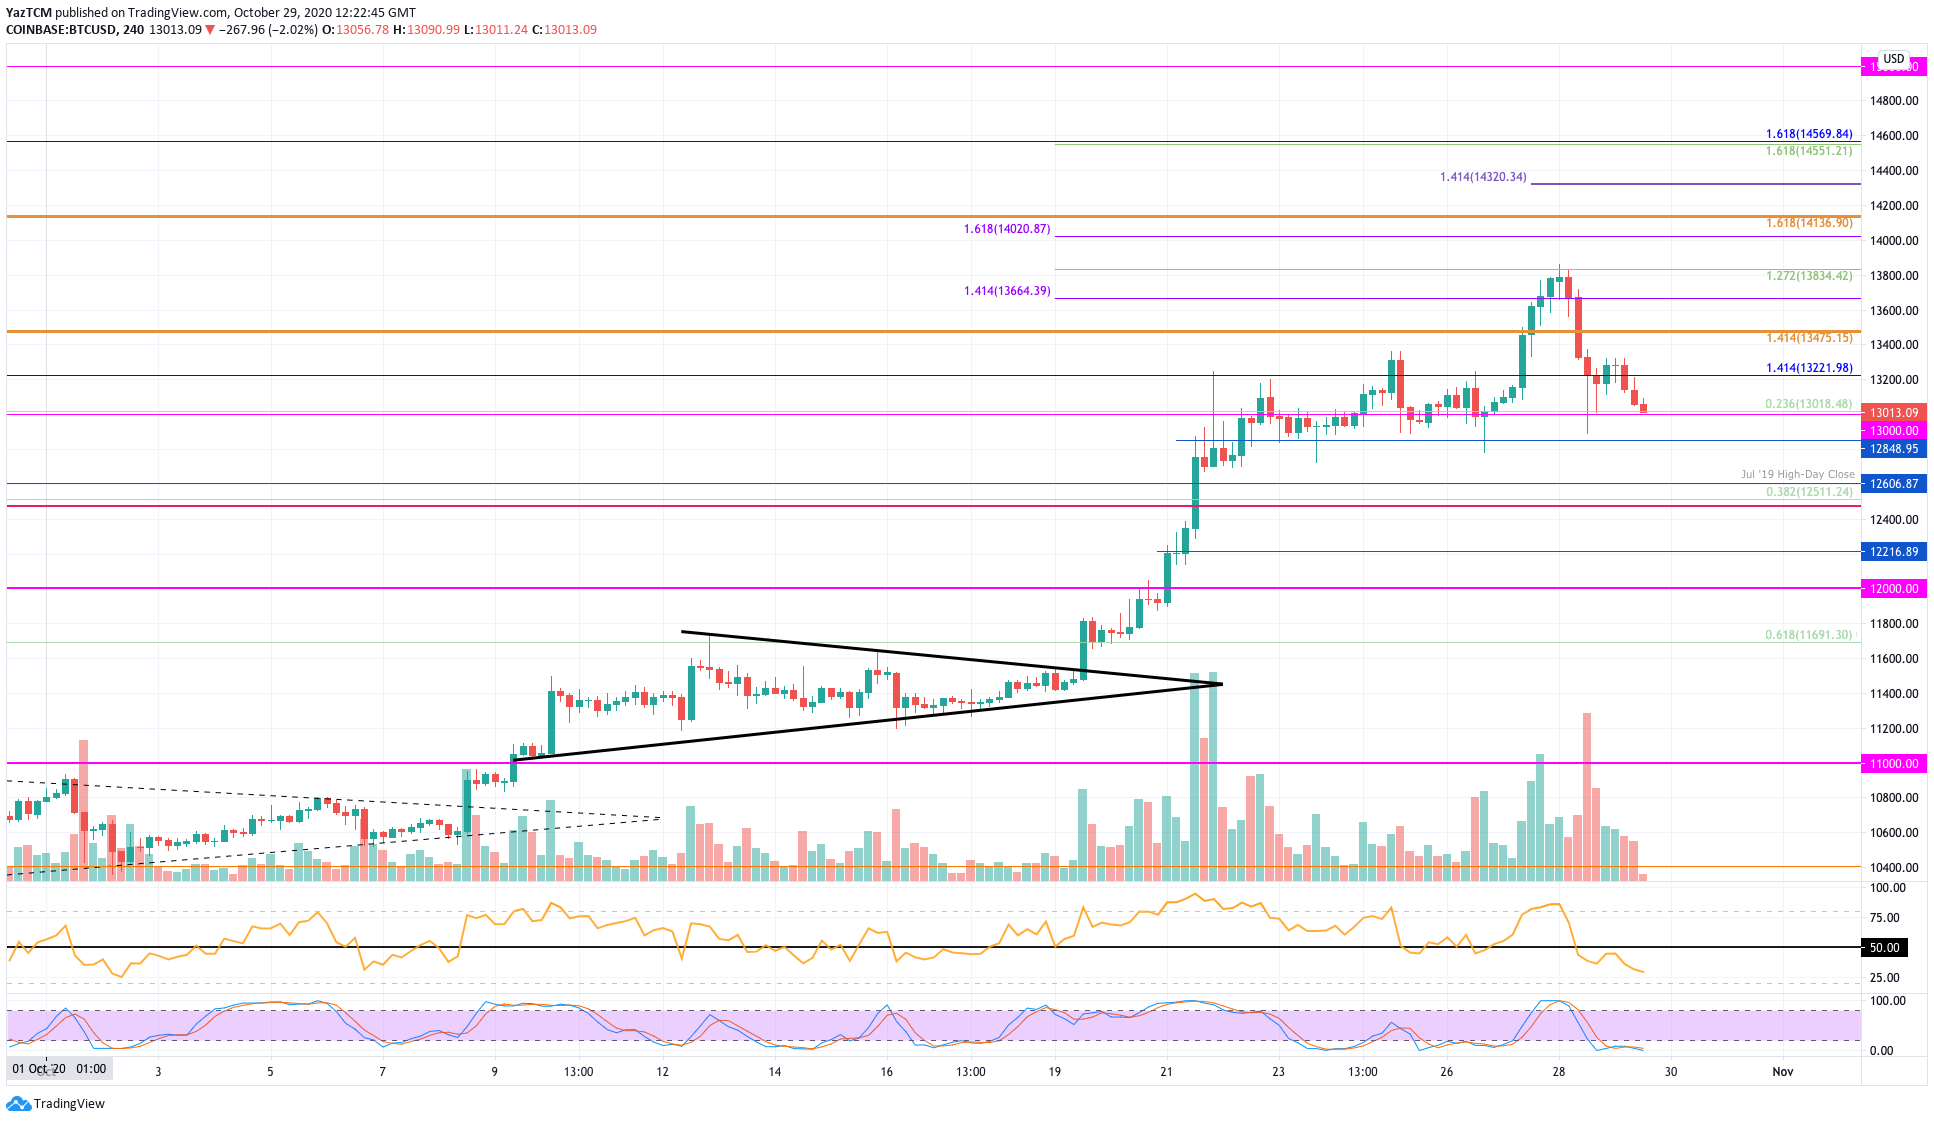
Looking at the 4HR chart above, we can clearly see Bitcoin breaking above a symmetrical triangle earlier in October as it started to explode higher. The coin initially found resistance at $13,221 - provided by a 1.414 Fib Extension, and it took a few days to overcome this level.
At the start of this week, Bitcoin managed to surge further higher above the aforementioned resistance. It went on to break above resistance at $13,475 and continued higher until it met the resistance at $13,834 (1.272 Fib Extension - green).
The bulls were unable to overcome this level of resistance and rolled over. We can see that the sellers have now pushed Bitcoin back to the $13,000 level.
BTC price short term prediction: Bullish
BTC still remains bullish right now. It would have to drop beneath $12,000 to become neutral - although a drop beneath $12,600 would indicate that the bulls are starting to lose control. It would still have to fall beneath $10,000 to be in danger of turning bearish again.
If the sellers continue to drop Bitcoin beneath $13,000, support is first expected at $12,850. Beneath this, support lies at $12,600 (July 19’ High-day closing price), $12,511 (.382 Fib Retracement), $12,126, and $12,000.
Where is the resistance toward the upside?
On the other side, the first level of resistance lies at $13,221. Above this, resistance lies at $12,475, $12,665, and $12,835 (1.272 Fib Extension - green). This is followed by resistance at $14,000, $14,136, $14,320, and $14,570.
Ethereum Price Analysis
What has been going on?
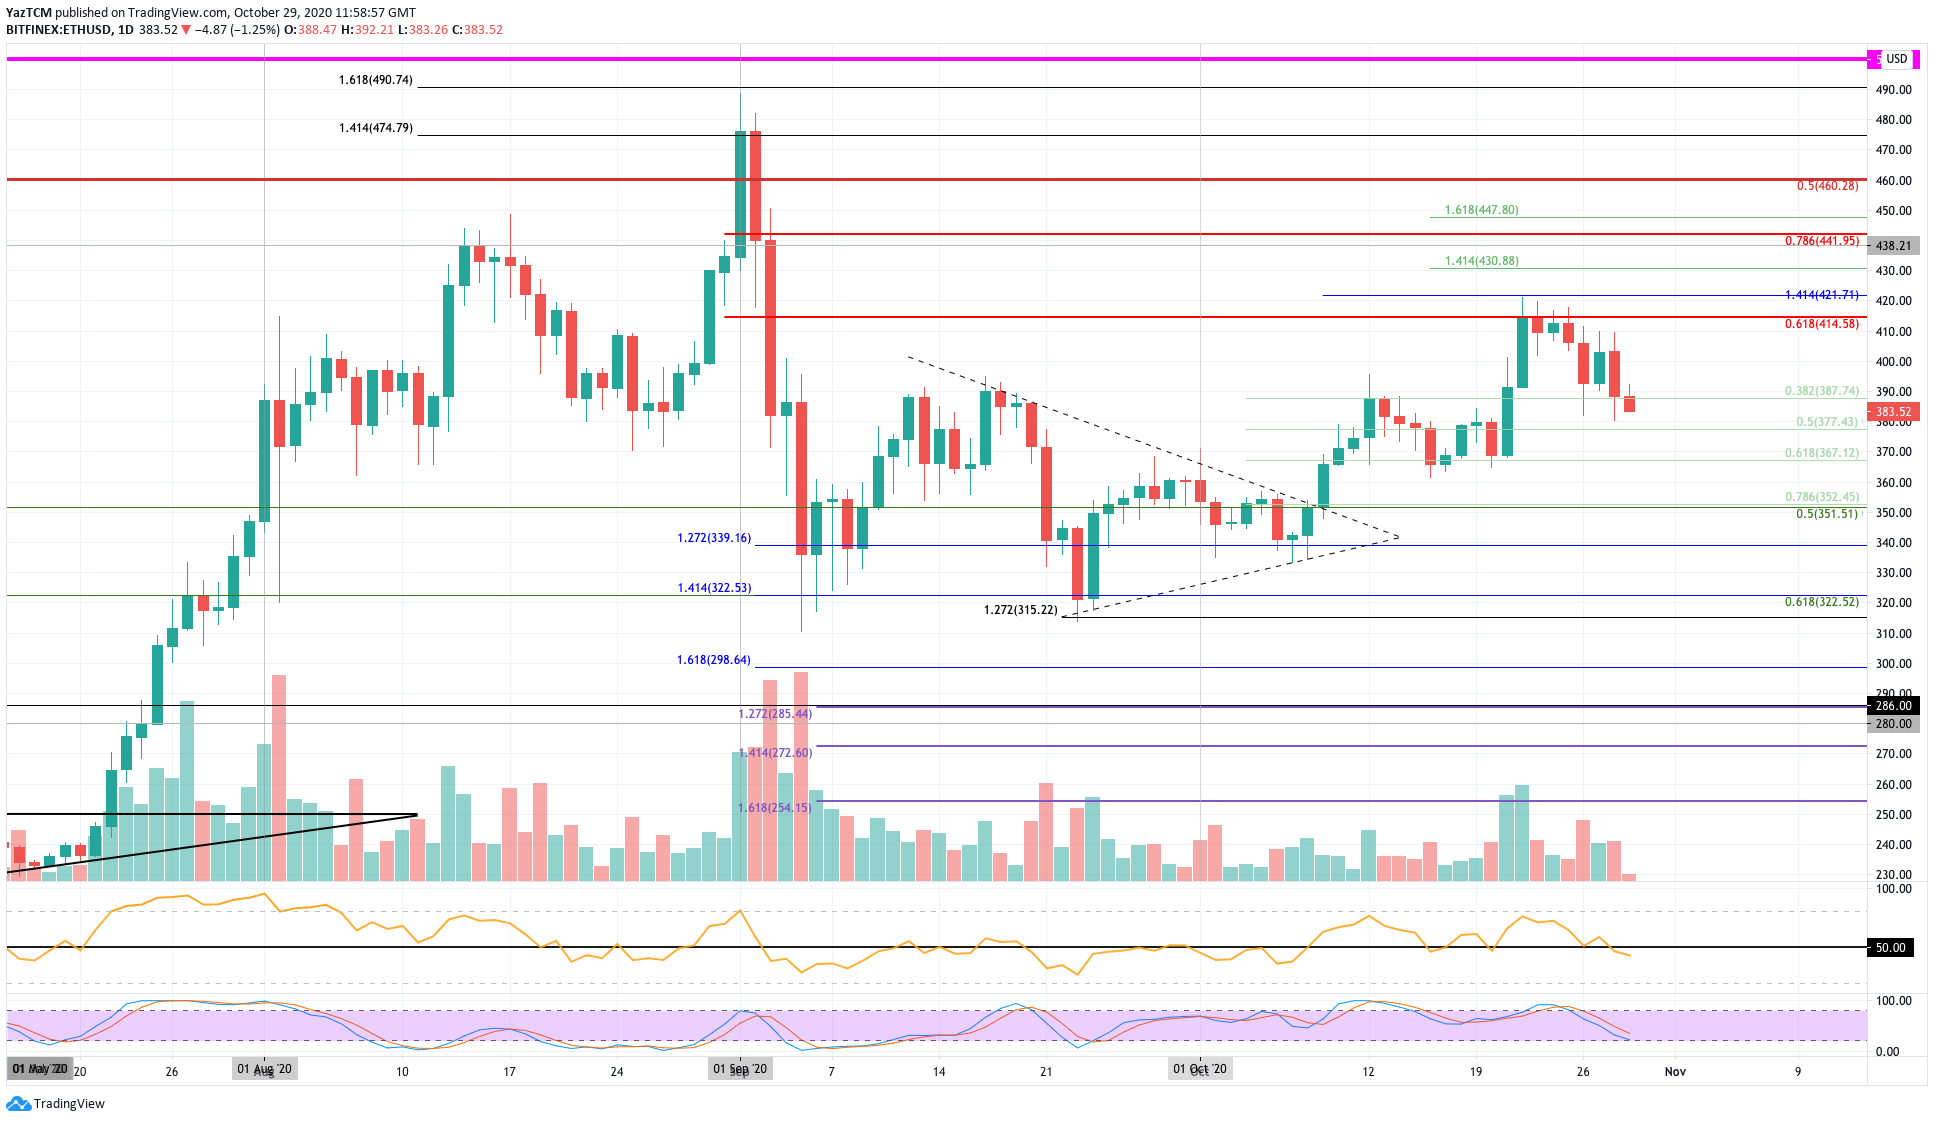
Looking at the daily chart for Ethereum, we can see that the coin had surged higher last week to break above the $400 level and spike as high as $421 (1.414 Fib Extension). More specifically, Ethereum was unable to overcome the resistance at $414 which was provided by a bearish .618 Fib Retracement.
After multiple attempts to break the resistance at $414, Ethereum rolled over and started to head lower throughout the week. We can see that it initially found support at the $387 level (.382 Fib Retracement), however, this level of support was broken today as ETH drops to the current $383.50 level.
ETH price short term prediction: Bullish
Ethereum can still also be considered as bullish but a drop beneath $360 will turn the market neutral. Etheruem would still need to break beneath $315 before being in danger of turning bearish again.
IF the sellers do continue to drive ETH lower, the first level of support lies at $377 (.5 Fib Retracement). Beneath this, support lies at $367 (.618 Fib), $360, $352 (.786 Fib), and $340.
Where is the resistance toward the upside?
On the other side, the first level of resistance now lies at $400. Above this, additional resistance is located at $410, $415 (bearish .618 Fib Retracement), $421, and $430. If the buyers continue higher, added resistance is expected at $41 (bearish .786 Fib Retracement), $447, and $460.
Ripple Price Analysis
What has been going on?
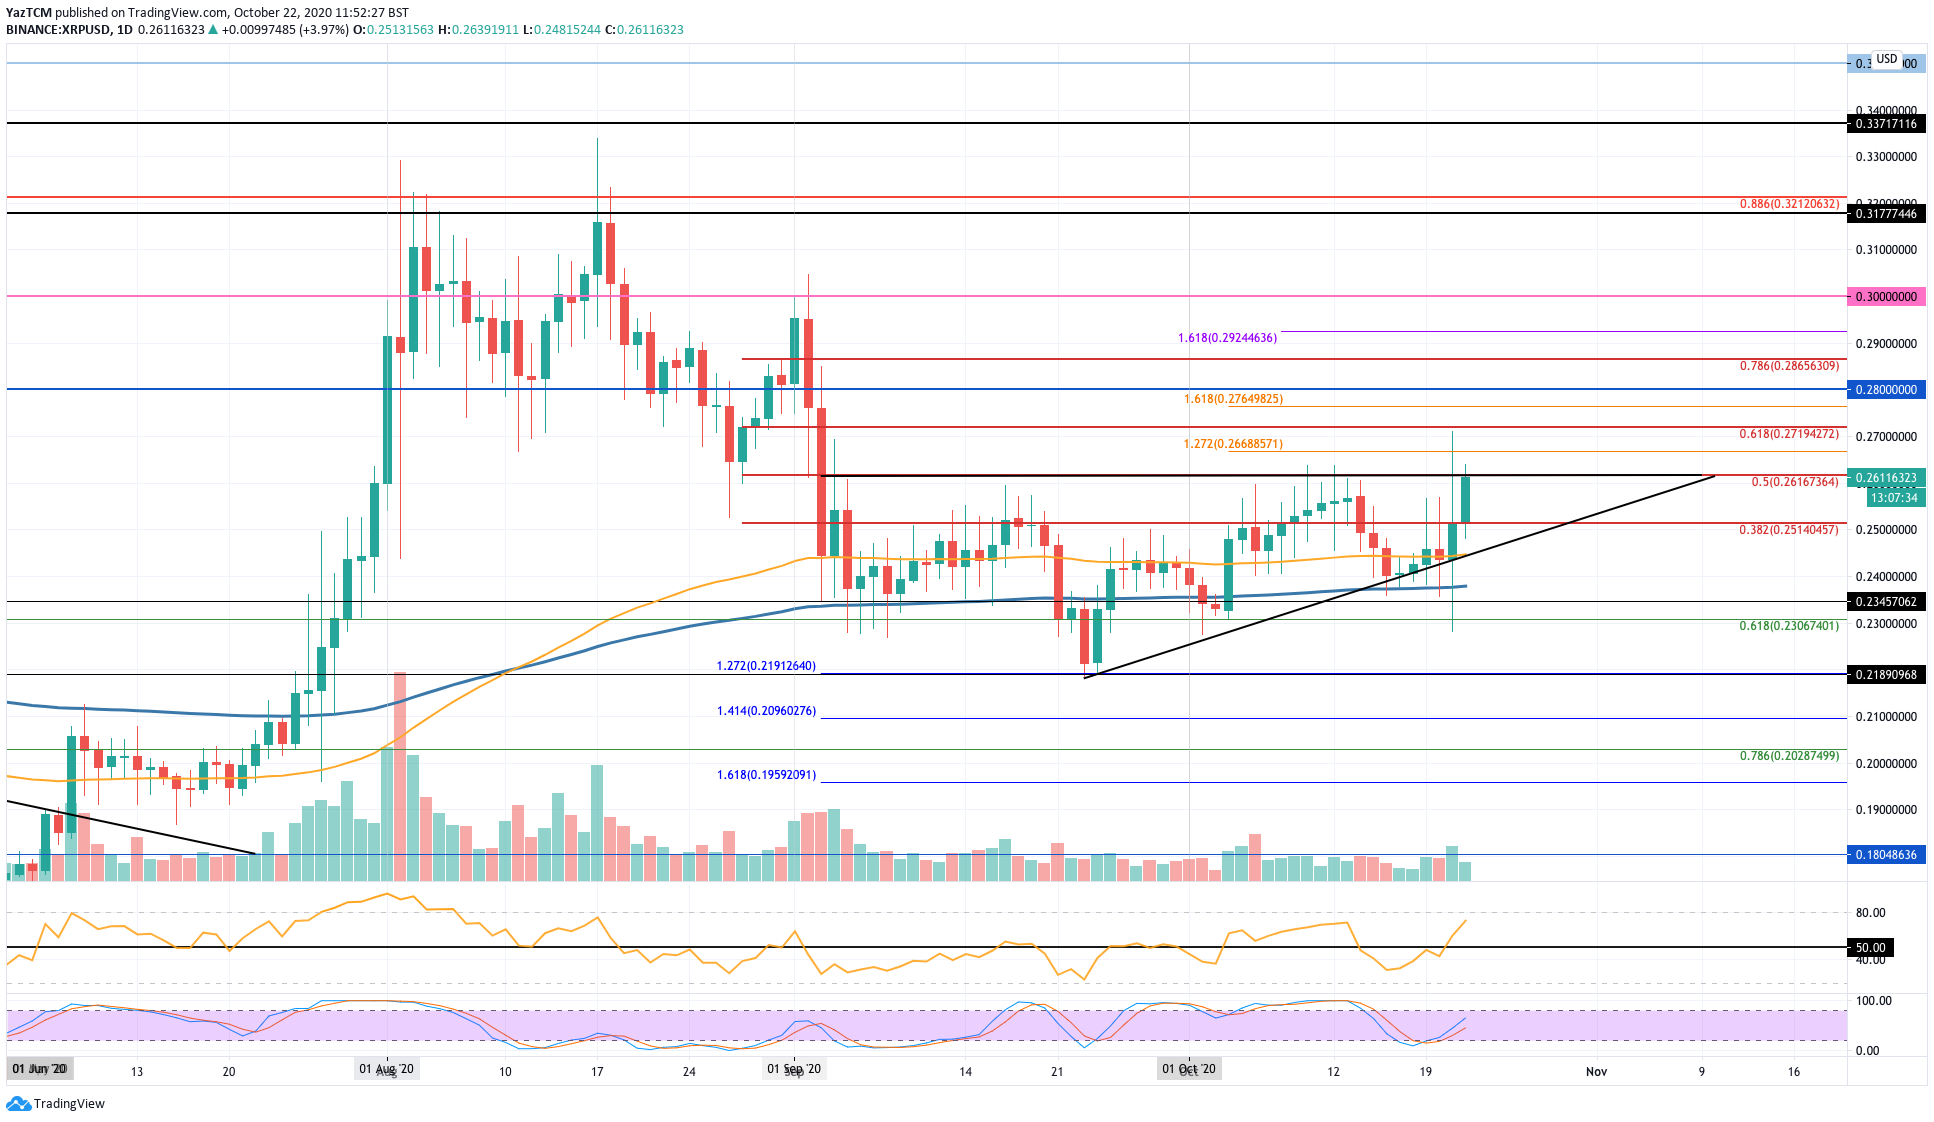
Looking at the daily XRP chart above, we can see that the coin was trading within an ascending triangle throughout October. The roof of the triangle was at the $0.261 level which is resistance provided by a bearish .5 Fib Retracement level. The buyers were unable to break this level of resistance and eventually broke beneath the lower boundary of the triangle yesterday.
We can see that XRP spiked as low as $0.235 yesterday but the buyers have since recovered and are trading at $0.243 right now.
XRP price short term prediction: Neutral
XRP is considered to be neutral right now. The coin would need to break above $0.261 to turn bullish. It would need to drop beneath the support at $0.219 to be in danger of turning bearish in the short term.
If the sellers do push lower, the first level of support lies at $0.238. This is followed by support at $0.234, $0.23 (.618 Fib), $0.22, and $0.218.
Where is the resistance toward the upside?
On the other side, the first level of resistance is located at $0.25. Above this, resistance lies at $0.261 (bearish .5 Fib), $0.266 (1.272 Fib Extension), $0.271 (bearish .618 Fib), and $0.276.
1
0


 Manage all your crypto, NFT and DeFi from one place
Securely connect the portfolio you’re using to start.

0
0


