MicroStrategy Stock Price Faces New Risk as Institutional Investors Pull Back

0
0

The MicroStrategy stock price has staged a notable rebound in recent weeks, but that recovery may now be facing its biggest test. With markets set to reopen for the last week of February, the stock remains highly sensitive to both Bitcoin’s weakness and shifting investor sentiment.
MSTR is currently trading near $131 after rebounding nearly 30% from its February 5 low. Despite this bounce, the stock is still down about 19% over the past month and more than 60% over the past three months.
This weak recovery now faces mounting pressure from 100% institutional exit disclosures, weakening momentum, and key technical resistance.
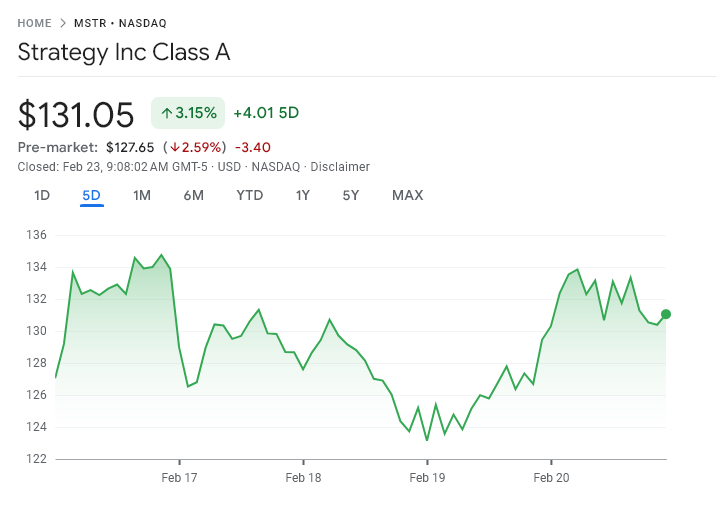 MSTR Stock Price Over the Past Week. Source: Google Finance
Institutional Selling Raises New Questions About MicroStrategy Recovery
The biggest warning sign for MicroStrategy stock price is coming from institutional investors themselves, who have recently revealed their positioning from the last quarter.
Recent 13F filings (lagging disclosures) reveal a clear pattern of mid-sized investors reducing or fully exiting Strategy positions.
Angeles Wealth Management and Wealth Watch Advisors both exited completely, cutting their holdings by 100%. Caitlin John LLC reduced its position by 96.54%, leaving only a negligible stake.
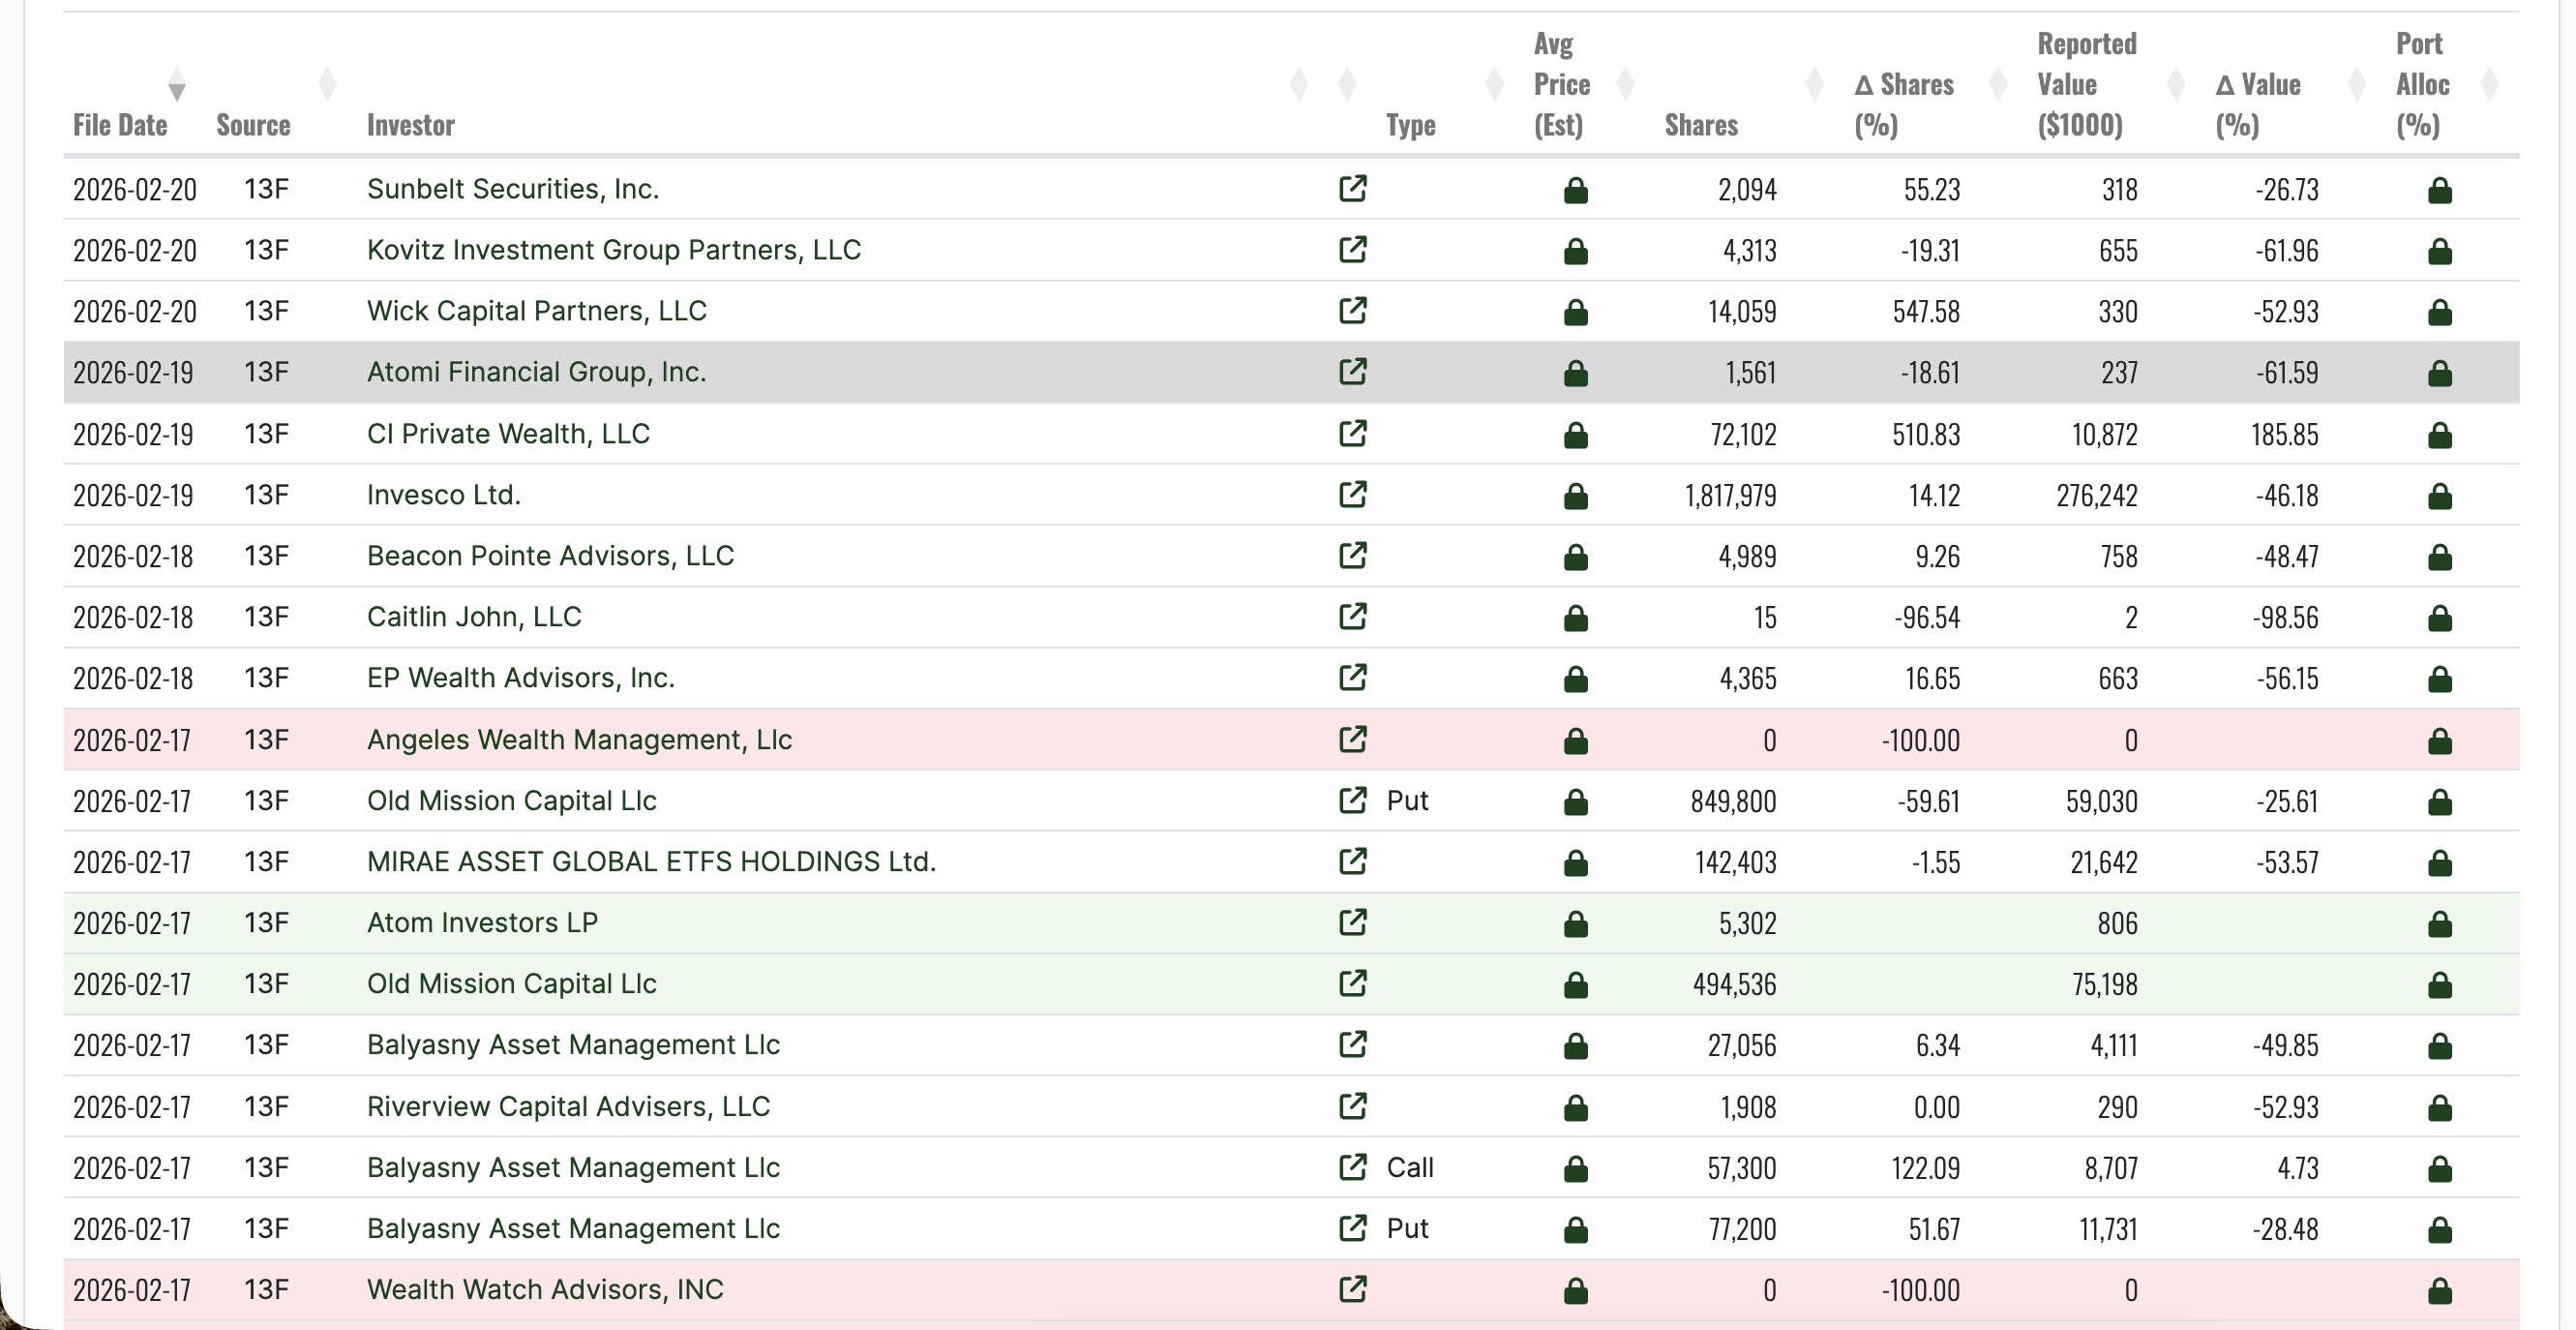 MSTR Holdings: Fintel
Want more insights like this? Sign up for Editor Harsh Notariya’s Daily Crypto Newsletter here.
Other major investors followed similar paths. Kovitz Investment Group cut its share count by 19.31%, while the value of its holdings fell nearly 62%.
Atomi Financial Group also reduced its exposure by 18.61%, with its position value dropping more than 61%. Even firms that maintained positions suffered heavy losses. Invesco increased its holdings by 14.12%, but the total value of its investment still fell by over 46%.
Such exits often signal declining confidence, especially when the news breaks during rebounds.
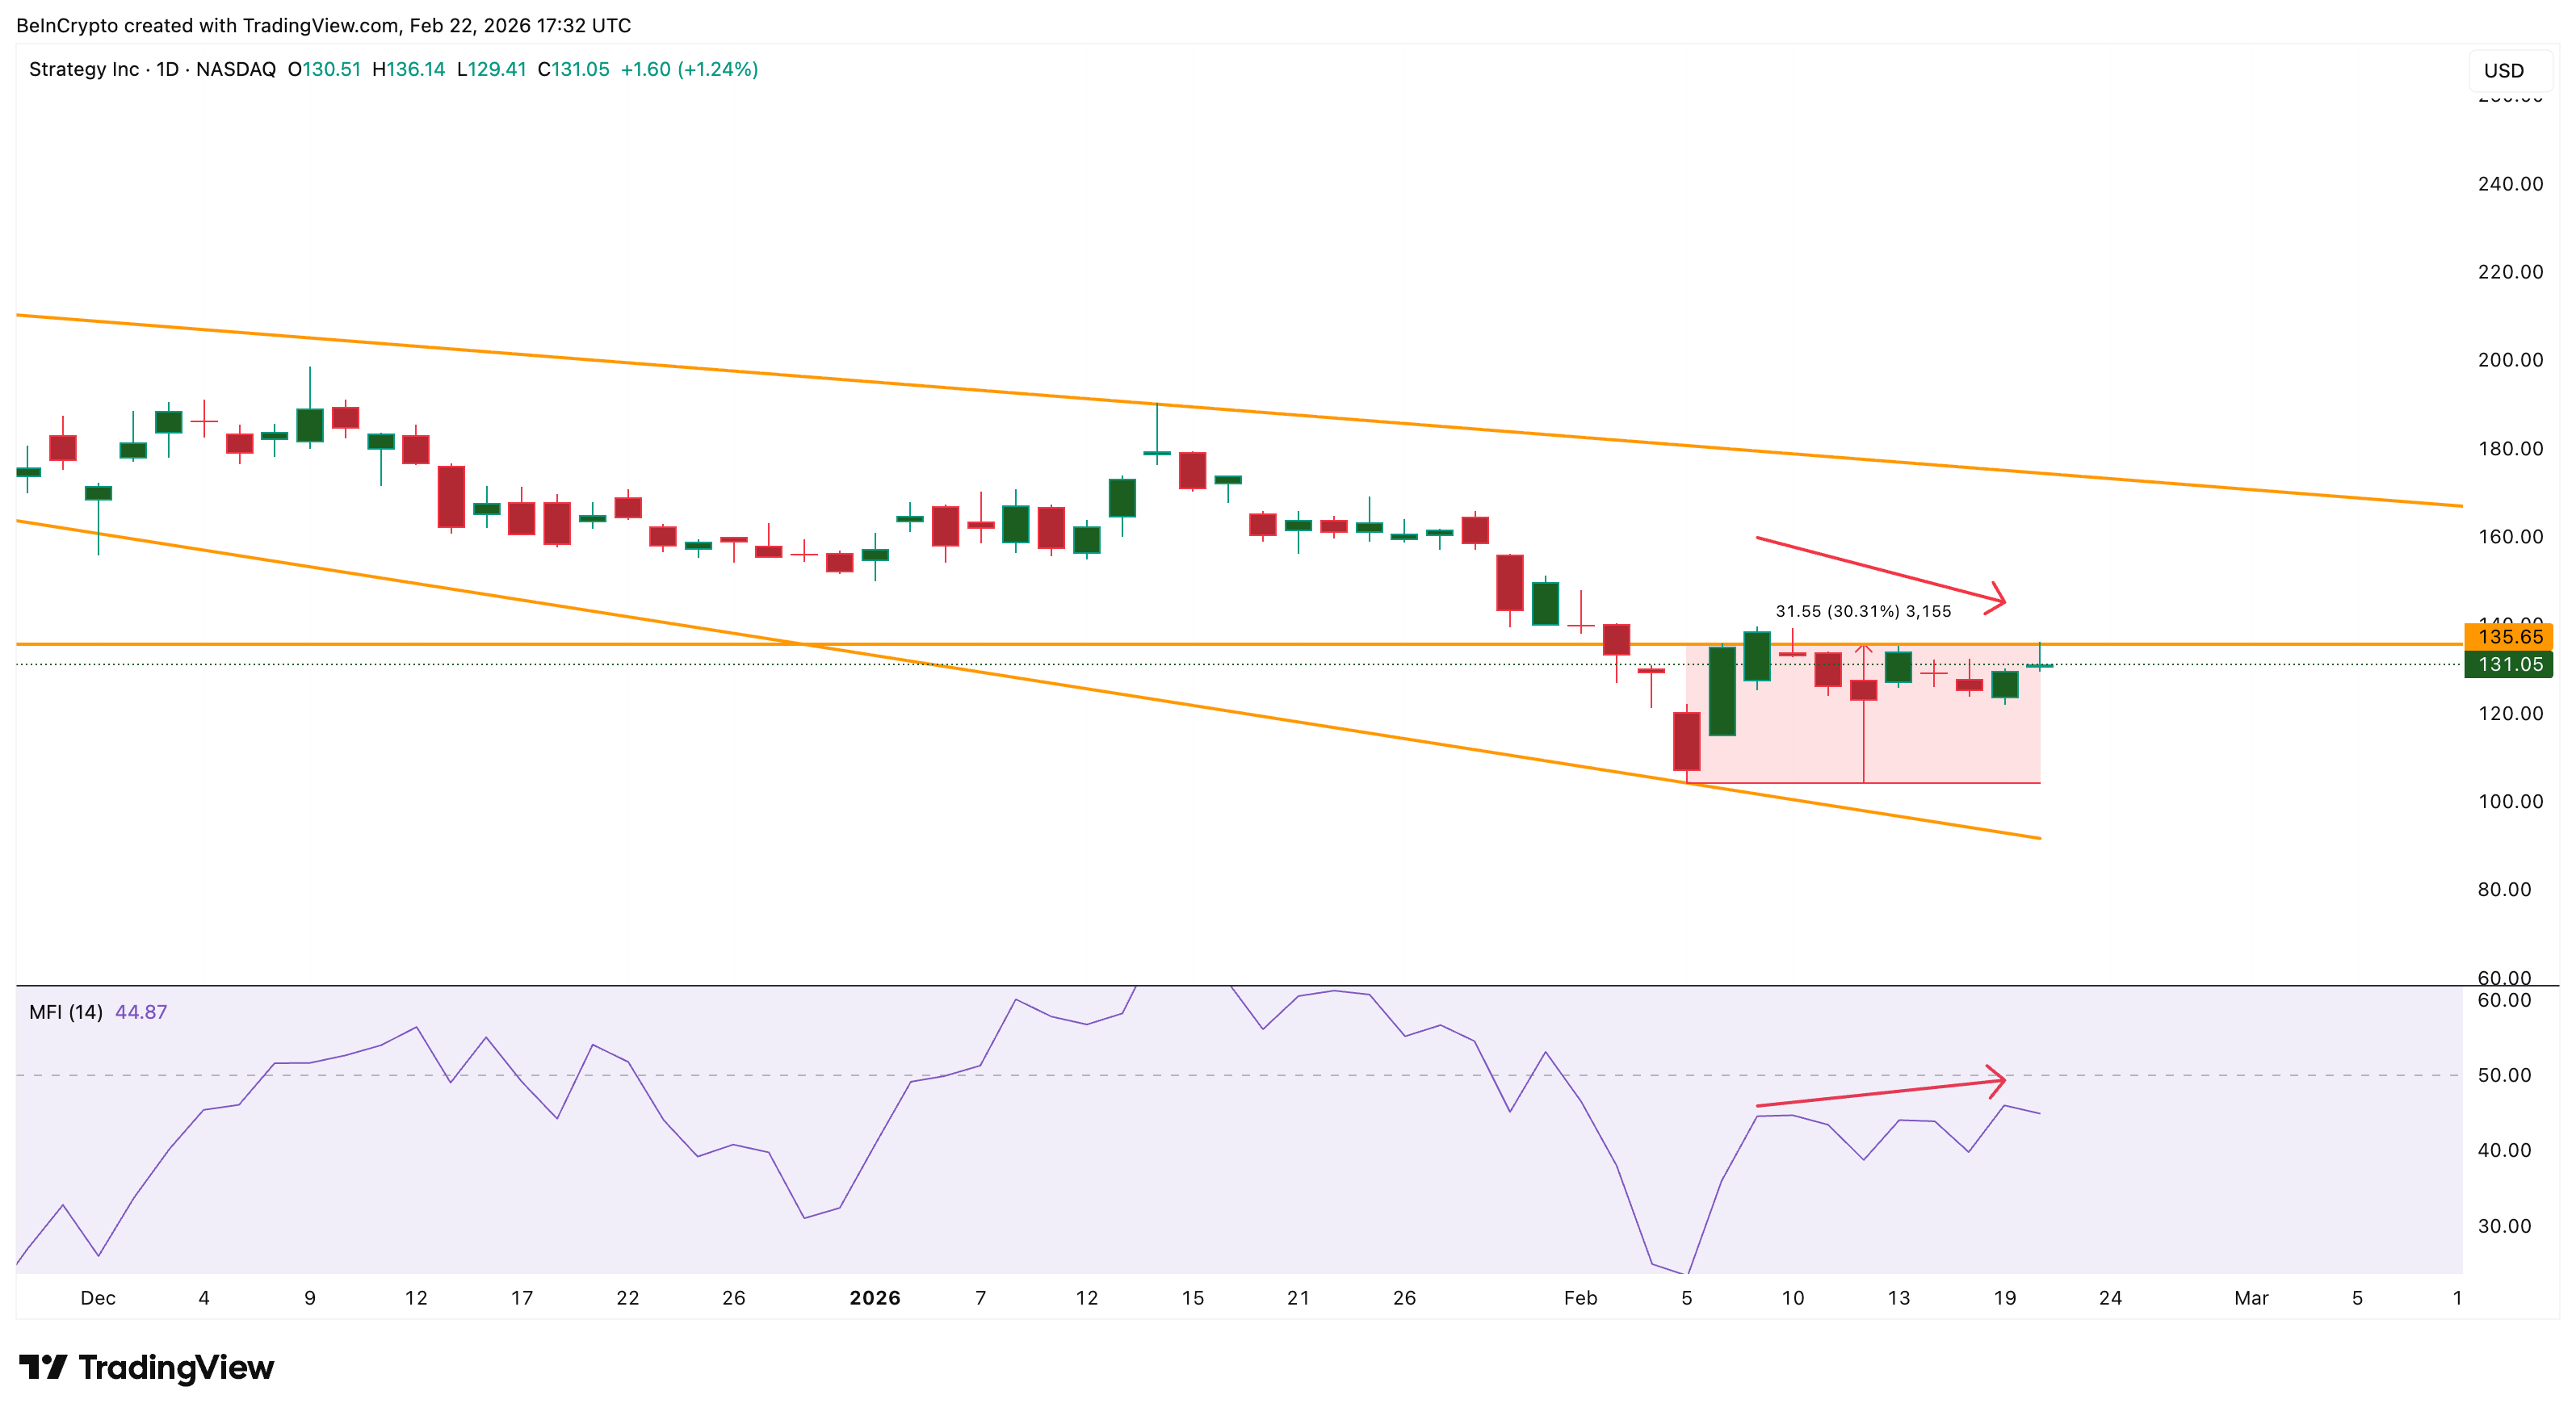
At the same time, MSTR’s technical structure is showing a hidden bearish divergence. Between November 18 and February 20, the stock formed a lower high, while the Relative Strength Index (RSI) formed a higher high.
RSI is a momentum indicator that measures the strength of price movements.
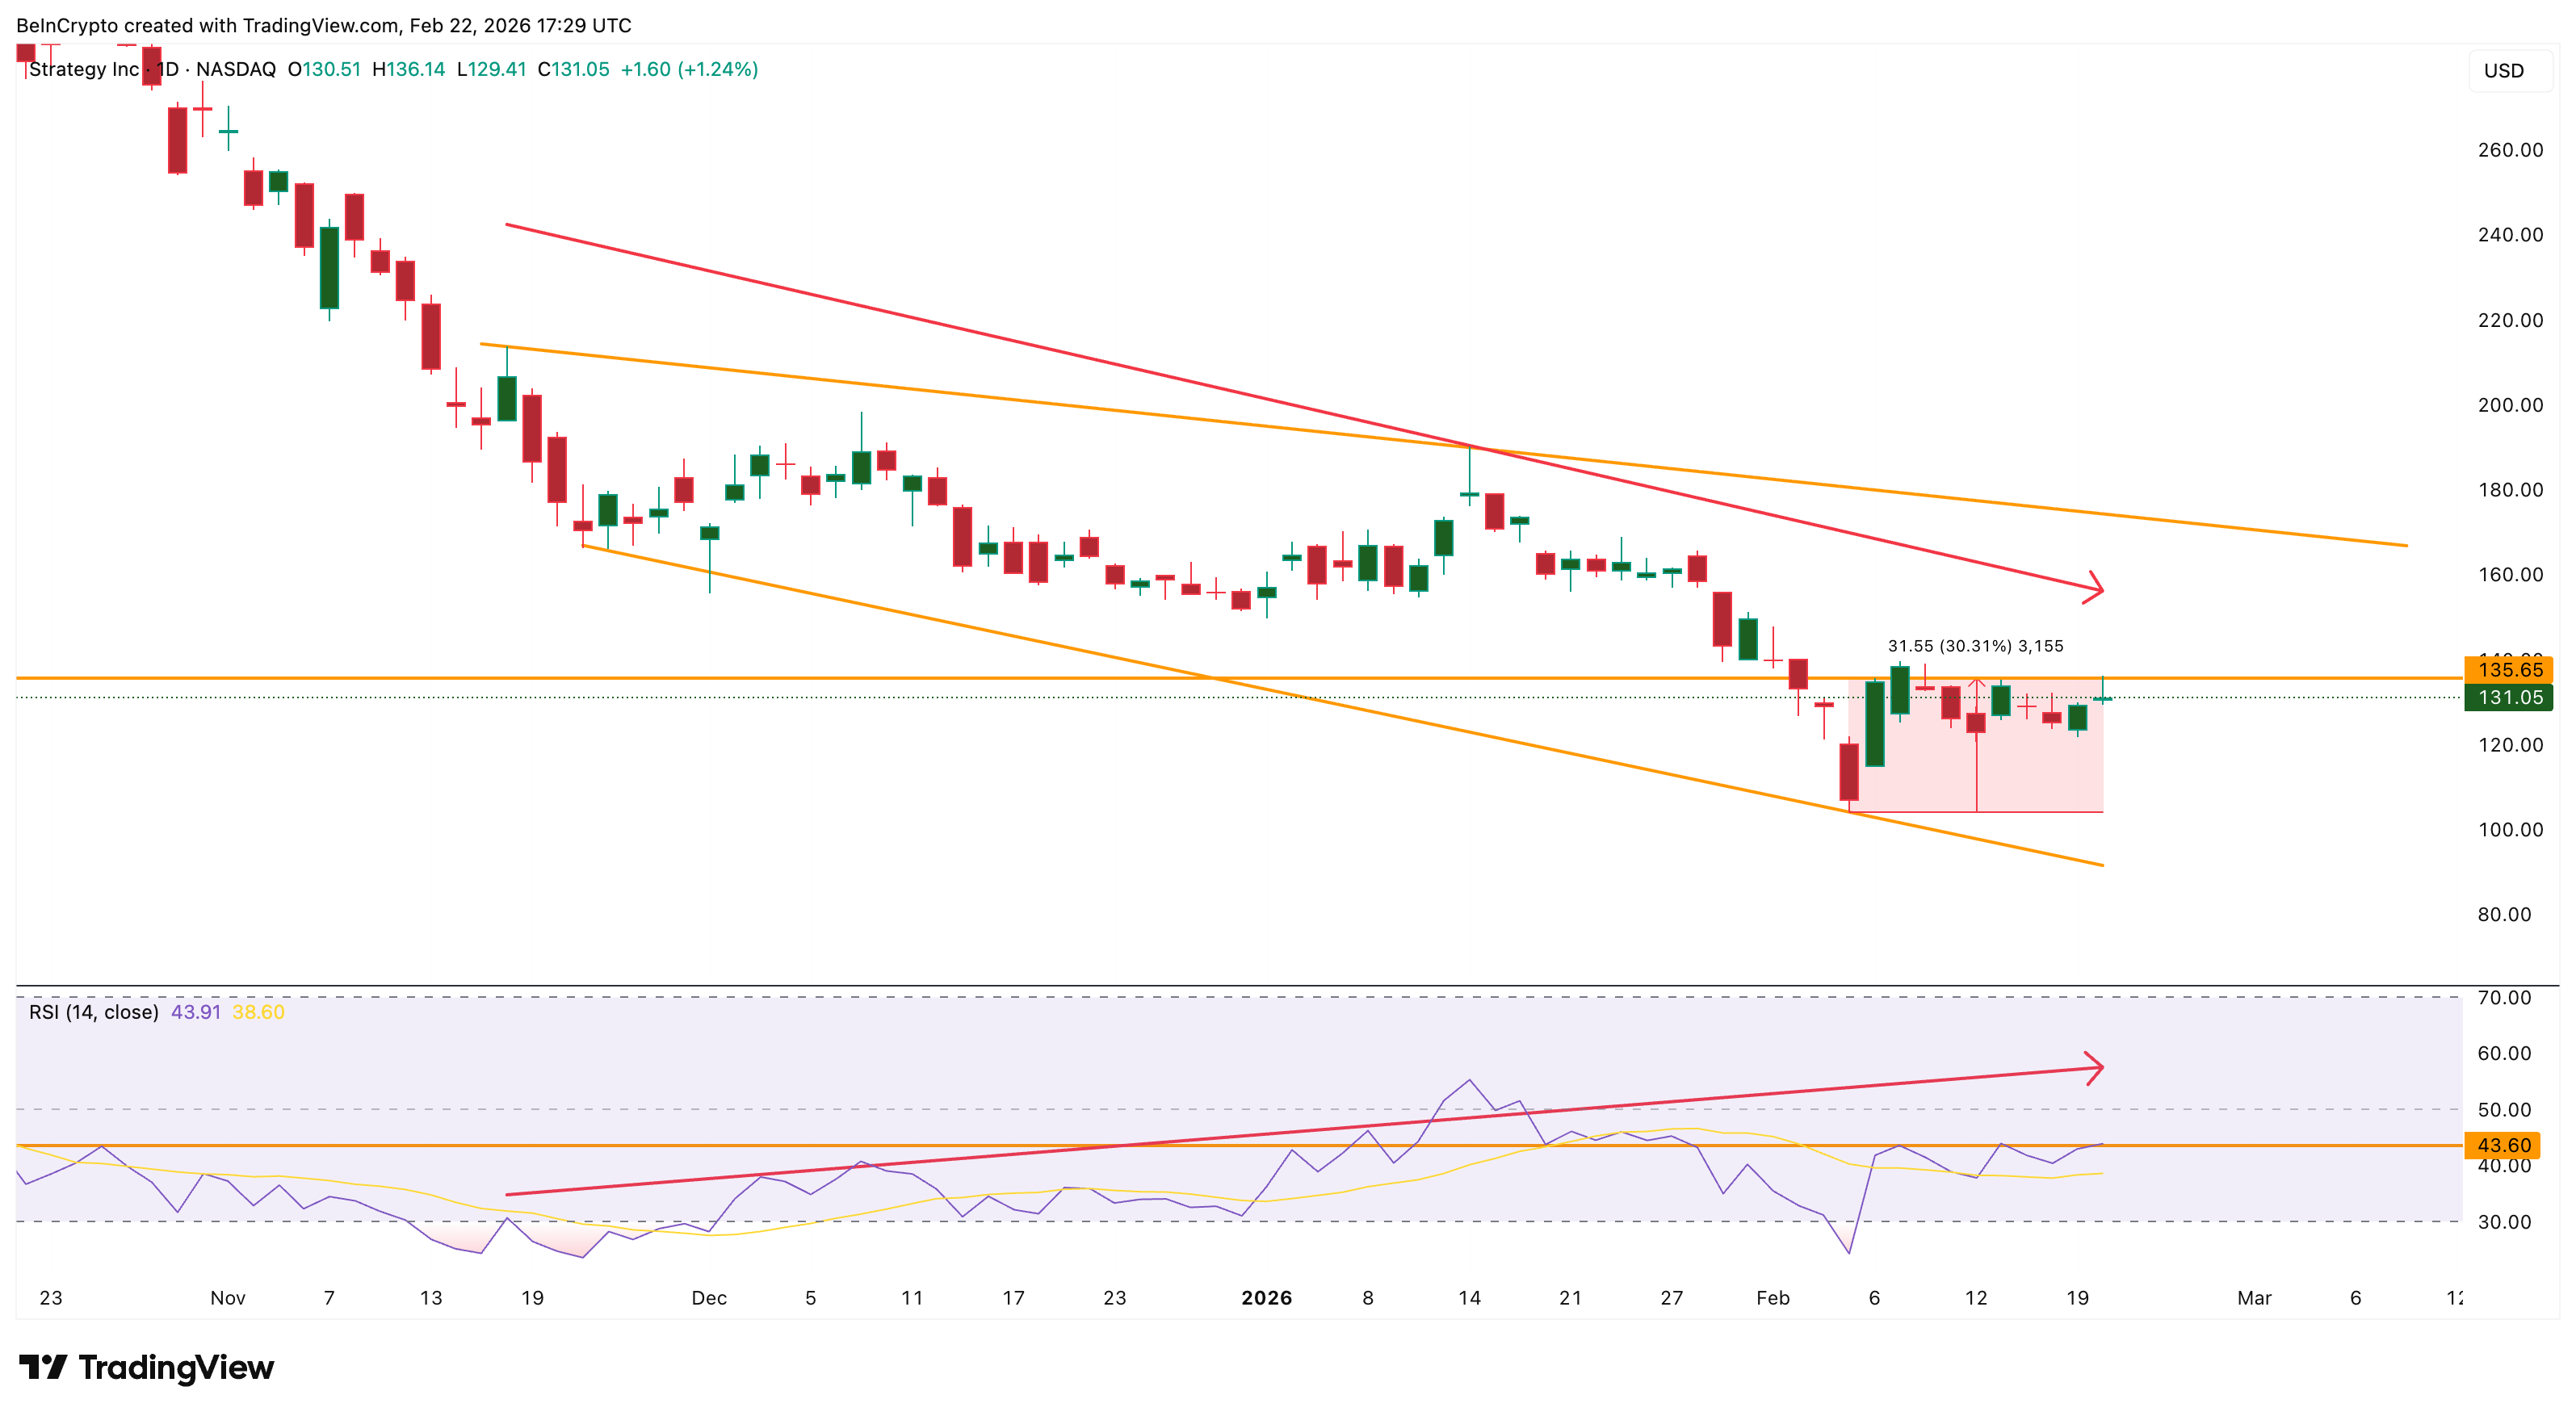 MSTR Divergence: TradingView
Because this divergence is appearing within a broader downtrend, it suggests the recent rebound may be losing strength. This signal would strengthen if the stock fails to break above key resistance near $135.
These filings reveal positioning during the recent decline (reported in the previous quarter), highlighting weakening institutional conviction.
Declining Volume Suggests Weak Conviction Behind the Recovery
Technical volume indicators suggest that remaining support may not be strong.
One key metric is On-Balance Volume (OBV), which tracks cumulative buying and selling pressure. Since February 9, the MicroStrategy stock price has moved mostly sideways, but OBV has fallen much more sharply.
This shows that selling volume has been stronger than buying volume during the recovery.
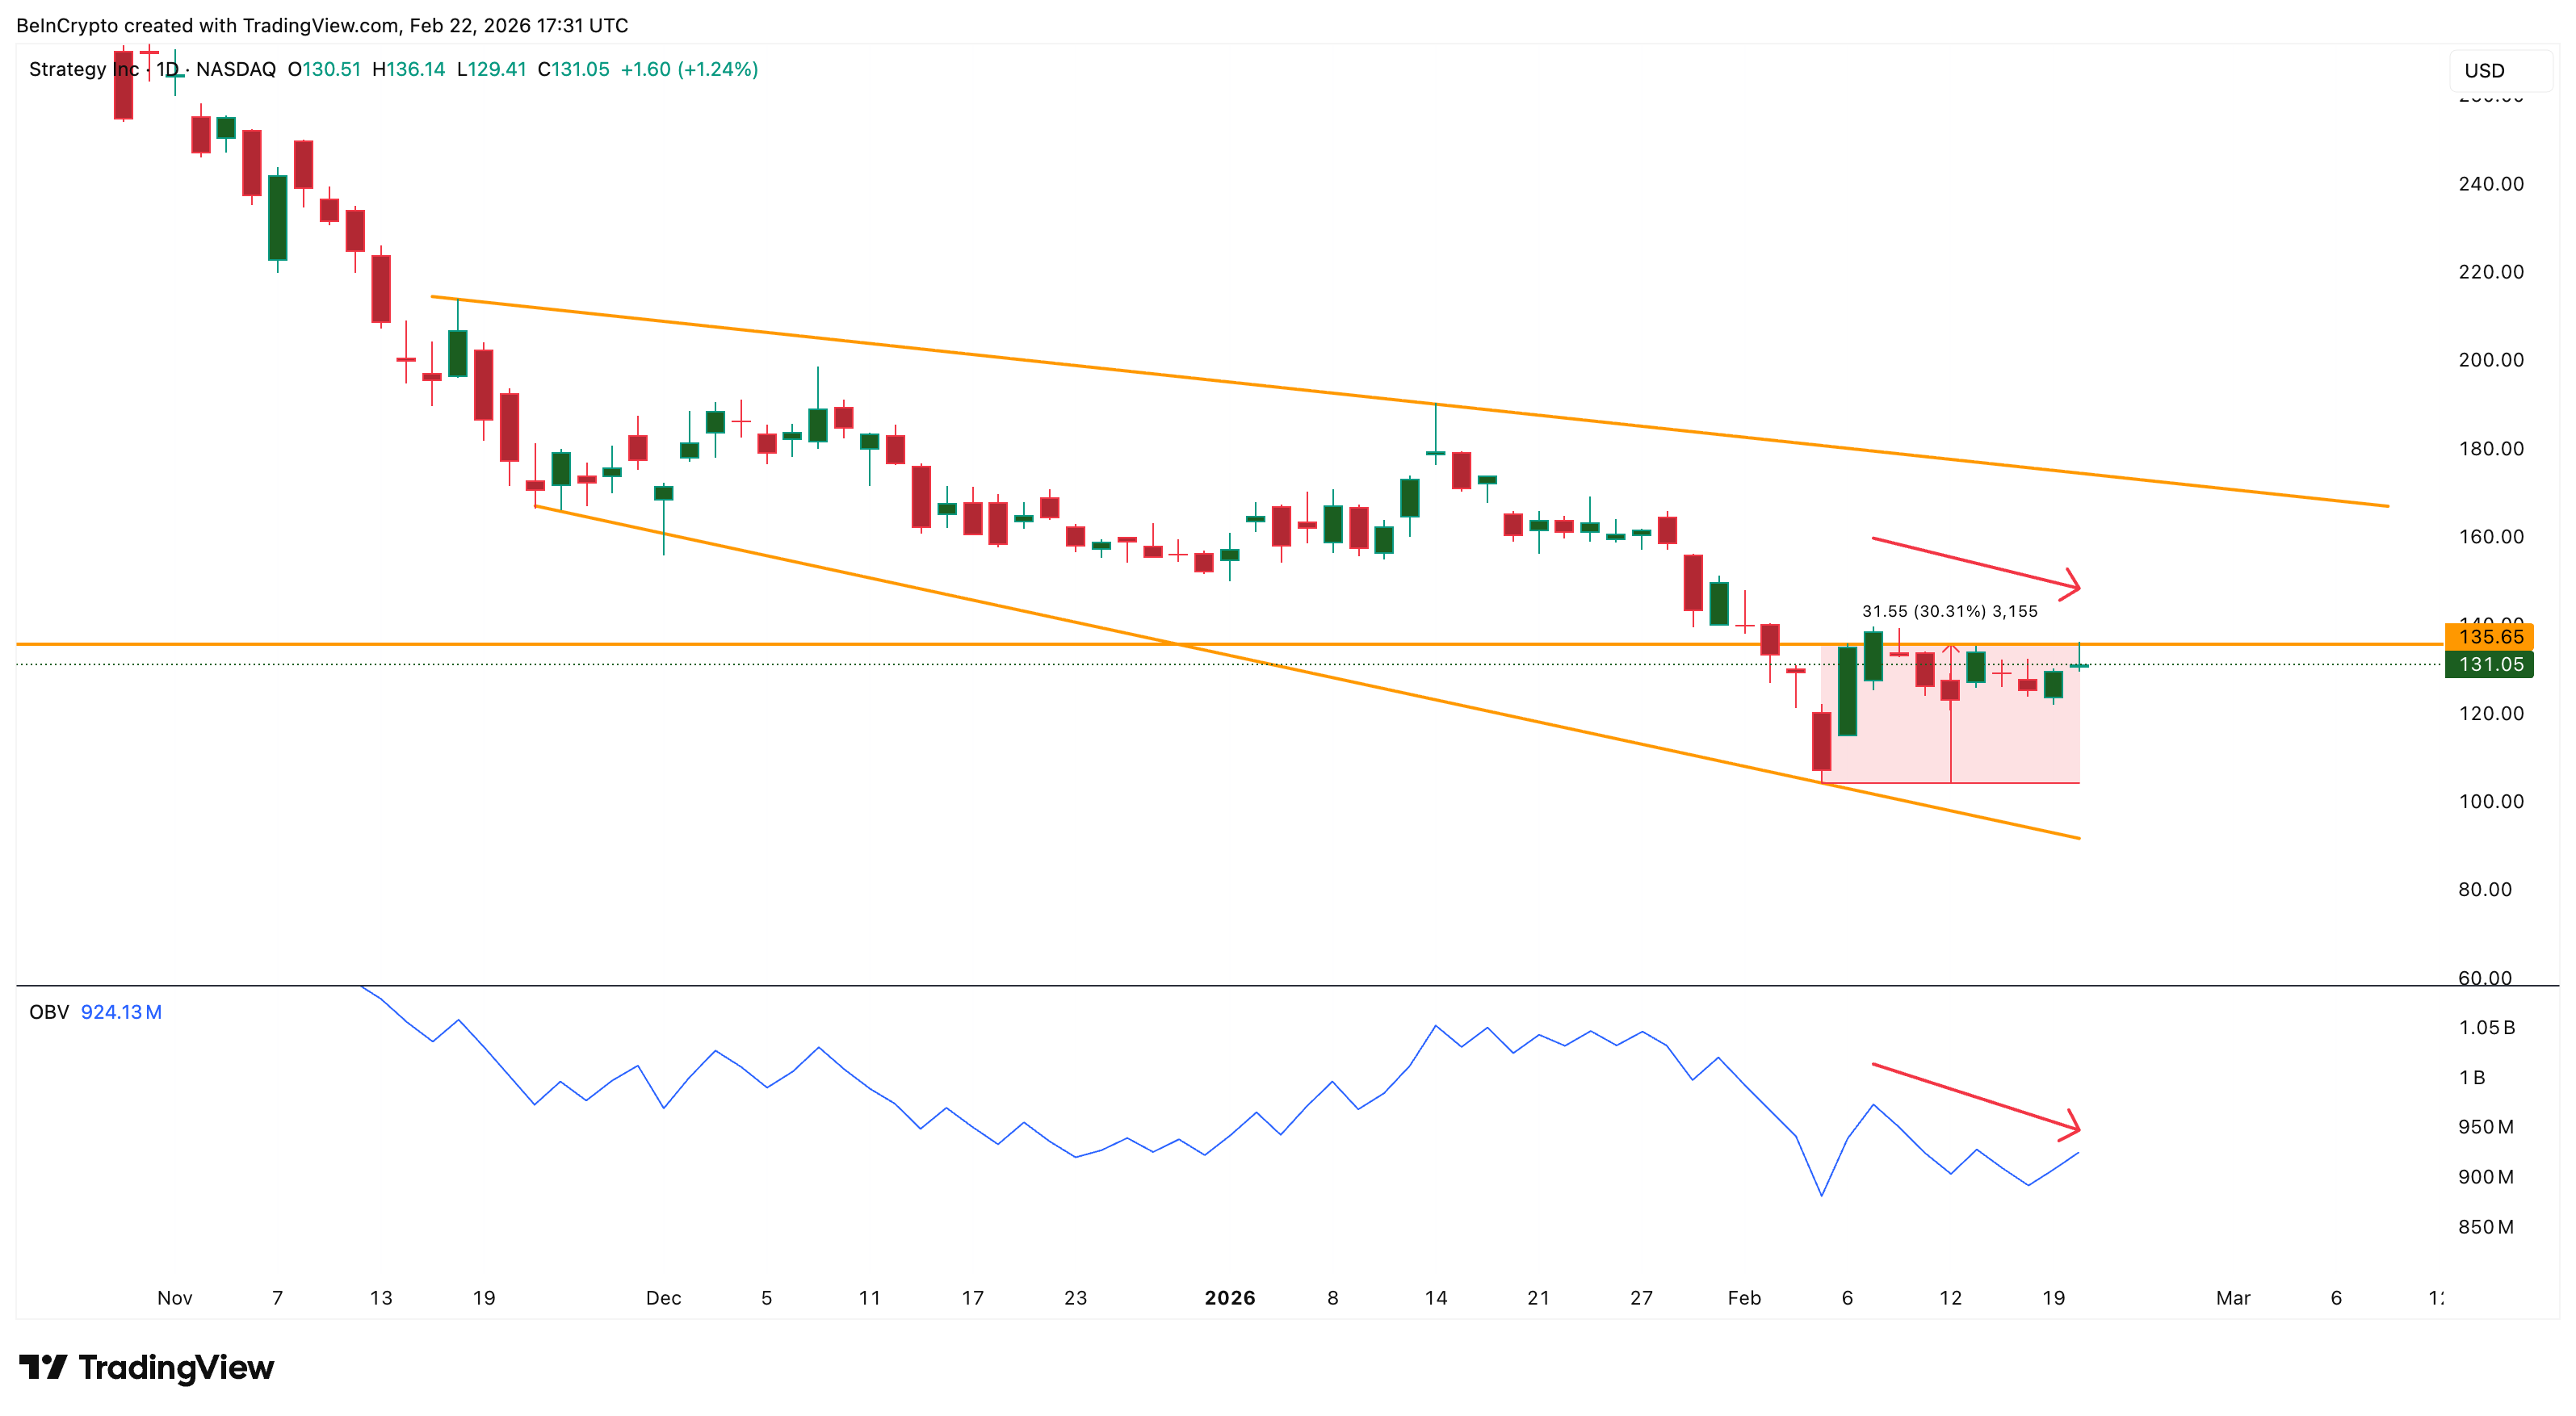 Retail Participation Weakens: TradingView
When OBV declines faster than price, it usually signals weakening conviction among investors, possibly retail. This suggests that fewer participants are willing to accumulate the MSTR stock at current levels.
However, not all signals are negative. The Money Flow Index (MFI), which measures capital inflows and dip-buying activity, shows limited strength.
Between February 5 and February 19, MFI formed a slightly higher high even as the price struggled to continue rising.
 Dip Buyers Active: TradingView
MFI tracks buying and selling pressure using both price and volume. When MFI rises while price stalls, it shows that some investors are still buying dips. This dip buying may explain why MicroStrategy’s stock price has held above recent lows despite institutional exits and weak volume. This also explains 3% green tick over the past 5 days.
But dip buying alone rarely sustains long-term rallies. Without stronger participation from large investors, price recoveries often struggle to continue. This brings the focus to the most important factor now: key MSTR stock price levels.
Key Price Levels Could Decide MSTR’s Next Major Move
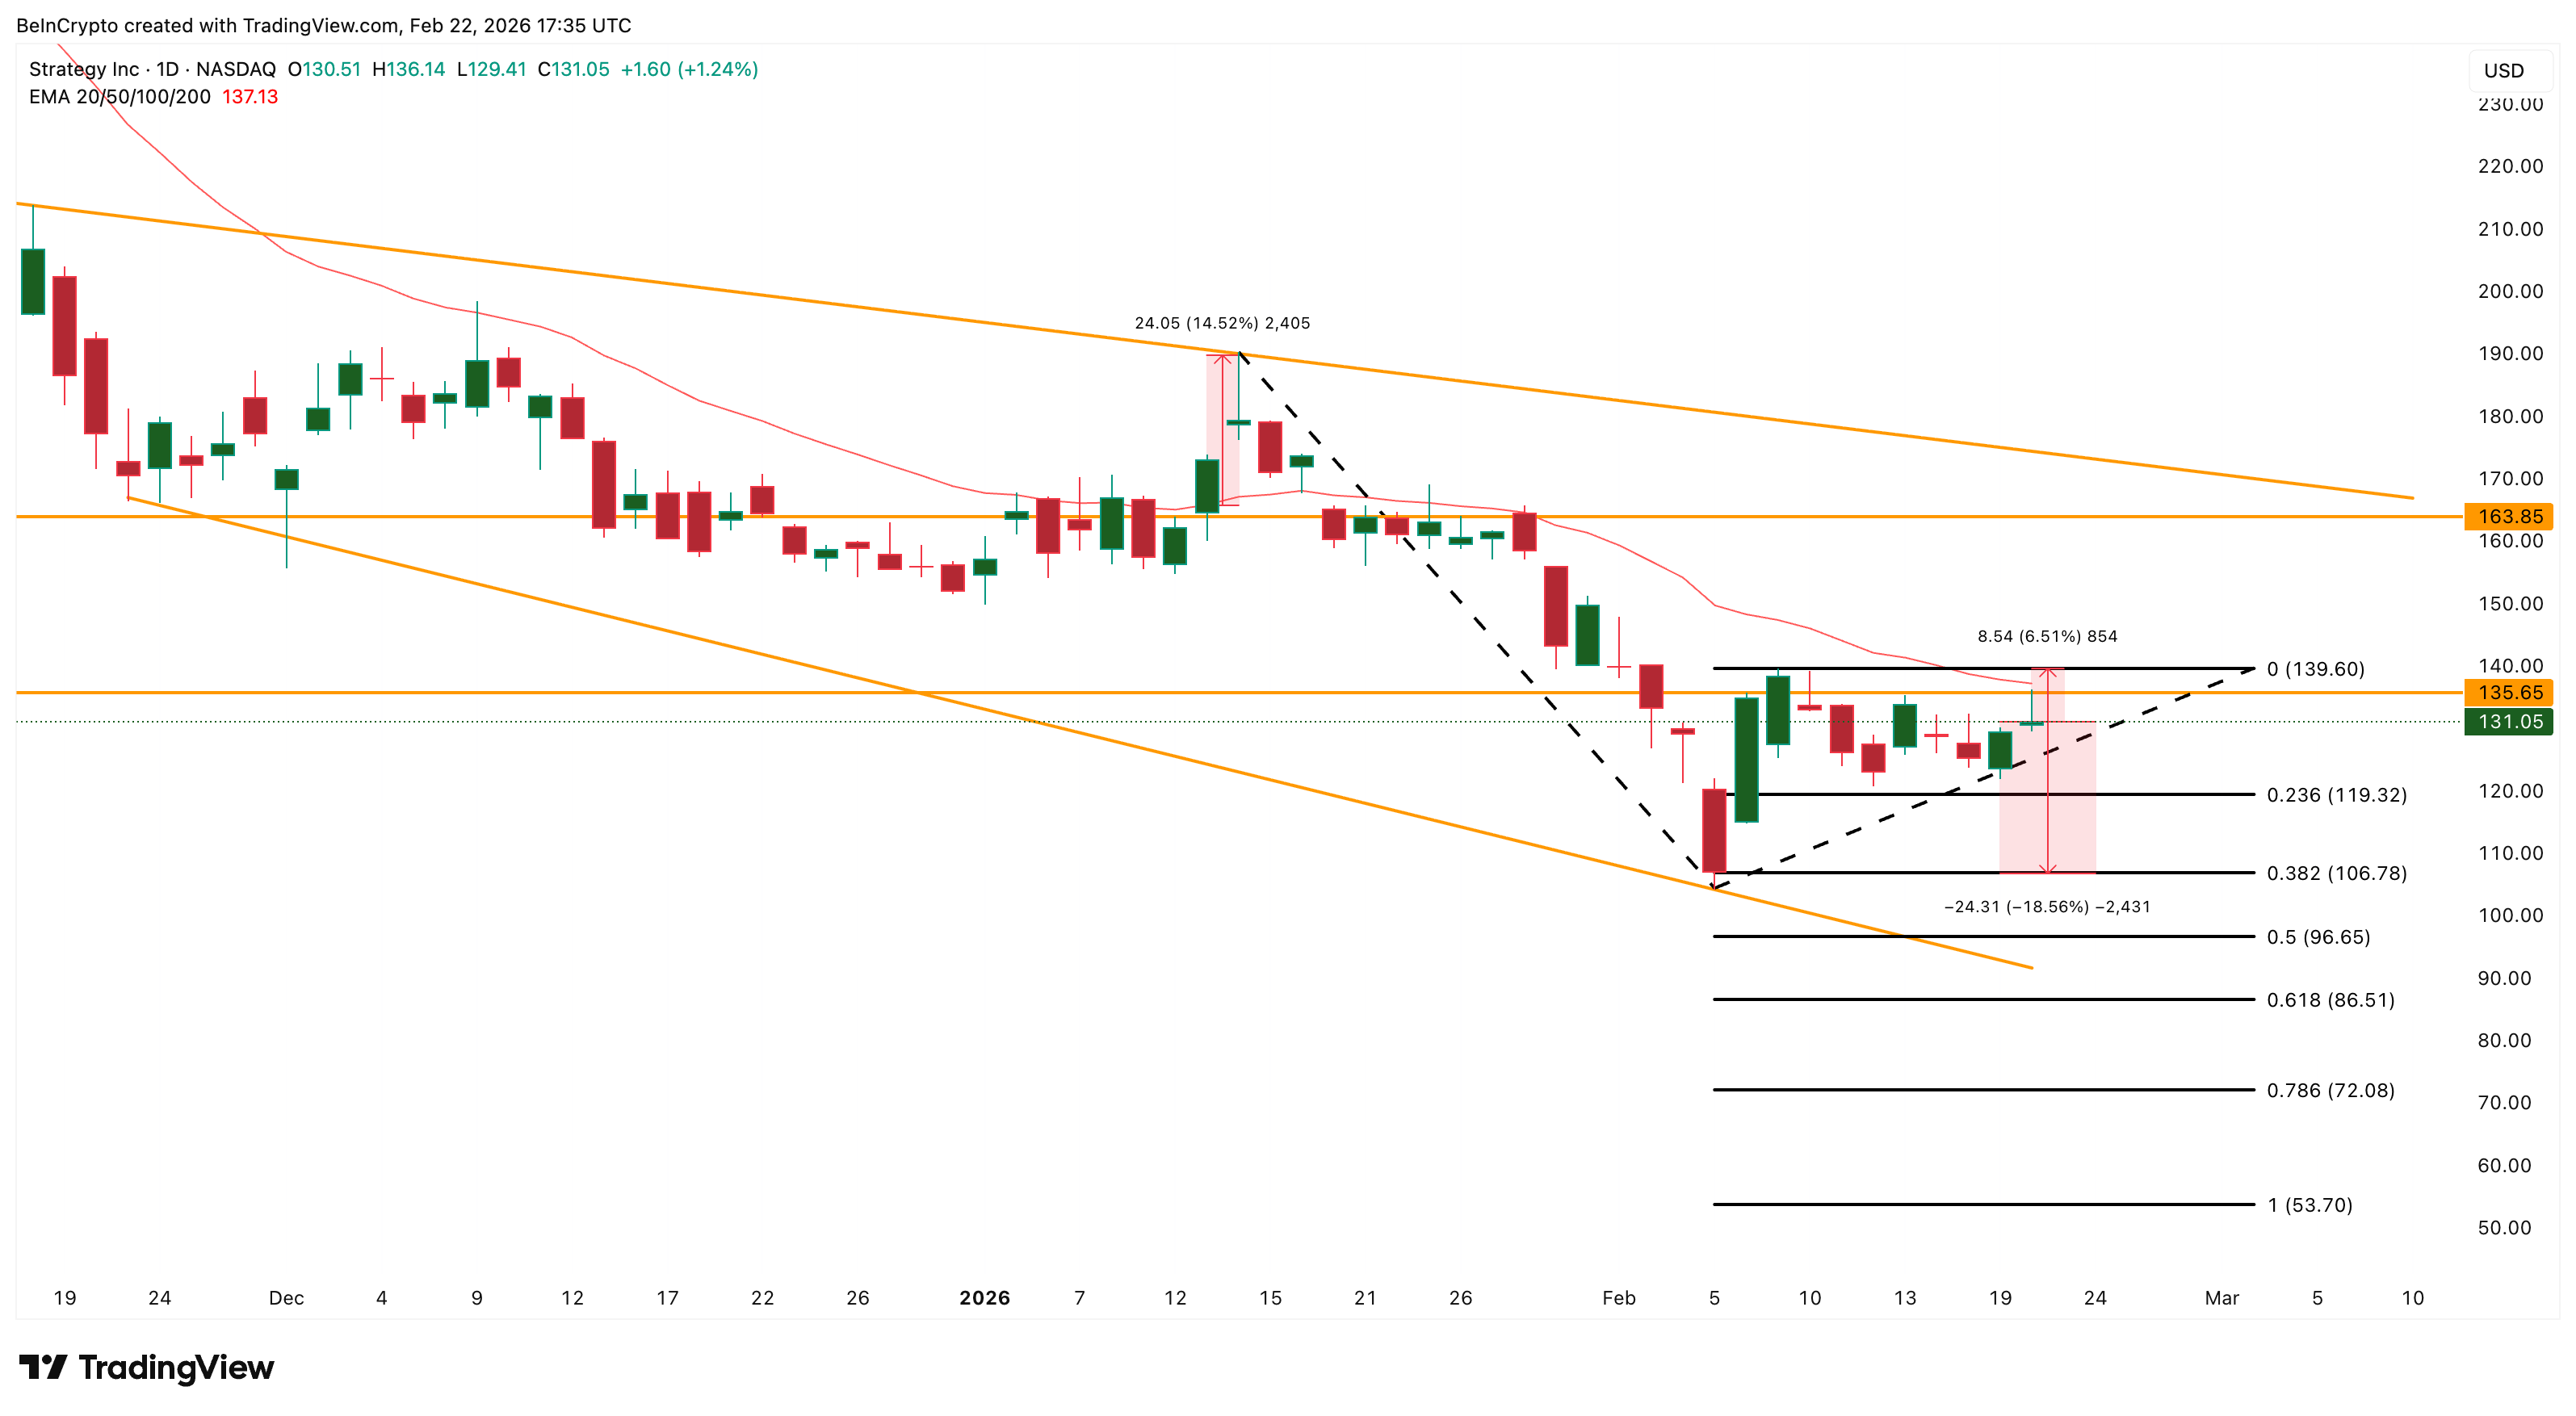
The MicroStrategy stock price is currently trading inside a falling broadening wedge pattern that has been forming since November. This structure reflects ongoing volatility and uncertainty.
For the recovery to continue, MicroStrategy must first break above $139. This level is especially important because it aligns with the 20-day Exponential Moving Average (EMA), a trend indicator that tracks short-term price direction while giving more weight to recent price changes. The last time MicroStrategy reclaimed this level in January, the stock rallied nearly 15% shortly after.
If MSTR breaks above $139, it could gain strength for a move toward $163.
However, downside risks remain significantly stronger. If the MicroStrategy stock price falls below $119, the current structure would weaken considerably. A deeper drop below $106 could open the path toward $96 and potentially $86.
 MSTR Price Analysis: TradingView
This would represent a decline of nearly 20% from current levels. MicroStrategy’s close relationship with Bitcoin makes this risk even more important.
The company currently holds over 717,000 BTC, meaning its valuation remains highly sensitive to Bitcoin price movements, which itself looks weak.
With institutional investor exits surfacing, volume weakening, and resistance overhead, the MicroStrategy stock price now faces a decisive moment. As markets reopen Monday, the next move could determine whether the recent 30% rebound holds or begins to reverse.
0
0


 Manage all your crypto, NFT and DeFi from one place
Securely connect the portfolio you’re using to start.


