
Utya Price Prediction UTYA: Key Support Resistance Levels

0
0

Is UTYA a Good Buy Right Now? The Short Answer
Utya price prediction searches are spiking today for a reason. This coin ripped roughly 50% over the past week, and that kind of move on a sub-$40M meme token grabs attention fast.
Here's where things stand at the snapshot above: UTYA sits near $0.0354, easing back slightly on the latest hourly candle but still sitting inside an ascending channel that's been building since roughly July 11. Support holds near $0.0218. Resistance sits at $0.0425, then $0.0550. Zoom out to the weekly chart, and there's a longer-term descending channel still capping price near $0.0427. The base case invalidation level is a clean break back under $0.0300.
Is this the start of something bigger or a meme coin blowoff that fades by the weekend? That depends on whether volume sticks around after the initial spike, and that's the part nobody can answer from a chart alone. For more setups like this one, the crypto price prediction hub tracks similar breakouts across the market.
Key Takeaways
-
UTYA is trading around $0.0354, up roughly 50% over the past week but easing back about 1% on the latest 1H candle, still holding inside its ascending channel.
-
The move looks volume-led and speculative, not tied to any confirmed fundamental catalyst as of this snapshot.
-
Short-term range to watch: support near $0.0218, resistance near $0.0425, and then $0.0550.
-
On the weekly chart, UTYA is still inside a longer-term descending channel from its May high, with resistance near $0.0427.
-
Base case invalidation: a 1H close back below the ascending channel's lower trendline, roughly $0.0300, would undercut the current bullish structure.
Coin Overview
UTYA trades as part of the broader top meme coins sector, and the table below lays out where it stands as of the snapshot above.
| Field | Detail |
|---|---|
| Name | Utya |
| Ticker | UTYA |
| Blockchain | TON (The Open Network) |
| Contract Address | EQBaCgUwOoc6gHCNln_oJzb0mVs79YG7wYoavh-o1ItaneLA |
| Category | Meme coin |
| Price (Snapshot) | $0.03537 (LBank UTYA market), $0.03722 (CoinGecko UTYA price) |
| 1H Change | -1.06% (LBank) |
| 7D Change | +49.83% (LBank weekly candle) |
| Market Cap | $35.9M (LBank), $37.24M (CoinGecko) |
| Fully Diluted Valuation | $37.24M |
| Circulating / Total / Max Supply | 1,000,000,000 UTYA (all three equal) |
| 24h Volume | $337K (LBank pair), $1.44M (CoinGecko aggregate) |
| All-Time High | $0.06261 (May 7, 2026) |
| All-Time Low | $0.0002191 (Sept 5, 2024) |
| Holders | 8,923 |
Why Is UTYA Pumping Today?
The chart shows a sharp green candle breaking out of a multi-day consolidation range, followed by a small pullback on the most recent hour. The price jumped from the mid-$0.02s to an intraday high near $0.0396, then eased back to around $0.0354.
Volume backs this up. The LBank UTYA trading pair shows roughly 12.39M UTYA changed hands in 24 hours, worth about $337K on that pair alone, against a 24h low of $0.02247 and a high of $0.03957. That's a real spike, not a thin-book wick.
But there's no confirmed news catalyst tied to this move in the data available here. And that matters. Meme coin pumps without a fundamental trigger tend to be driven by momentum traders and social attention rather than new information, a pattern covered in broader looks at why crypto market rallies happen without headlines. Whales noticed first. Retail chased the candle after.
Methodology: How These Levels Were Calculated
Forecast timeframe: Short-term (days), weekly, and a lightly speculative longer-term view.
Chart timeframe used: 1-hour candles on the UTYA/USDT pair for short-term structure, plus the weekly candle chart for longer-term context (LBank via TradingView), covering roughly late April through July 22, 2026.
Indicators used:
-
RSI (Relative Strength Index): a momentum gauge from 0 to 100; above 70 usually flags overbought conditions, and below 30 flags oversold. UTYA's 14-period RSI reads 65.09 on the 1H chart, elevated but not yet in overbought territory.
-
EMA 50 (Exponential Moving Average): a trend line that weights recent price more heavily. It sits at $0.02794, well below the current price, which supports the near-term uptrend structure.
Support and resistance: Pulled directly from horizontal zones marked on the chart where price previously reversed multiple times: support at $0.02179 and $0.01485, and resistance at $0.04245 and $0.05498.
How targets were derived: Bull, base, and bear targets below use the marked resistance/support zones as the primary reference points, combined with the shape of the ascending channel visible on the chart.
Longer-term targets are labeled speculative because they assume continuation of a pattern that's only a few weeks old on a low-cap, low-liquidity token. Treat them as scenario planning, not predictions with any real precision, the same caution that applies across altcoin market news generally.
UTYA Technical Analysis: Ascending Channel Holds Weekly Ceiling
Price broke higher without breaking the ascending channel structure that's held since around July 11, and that's the headline before anything else.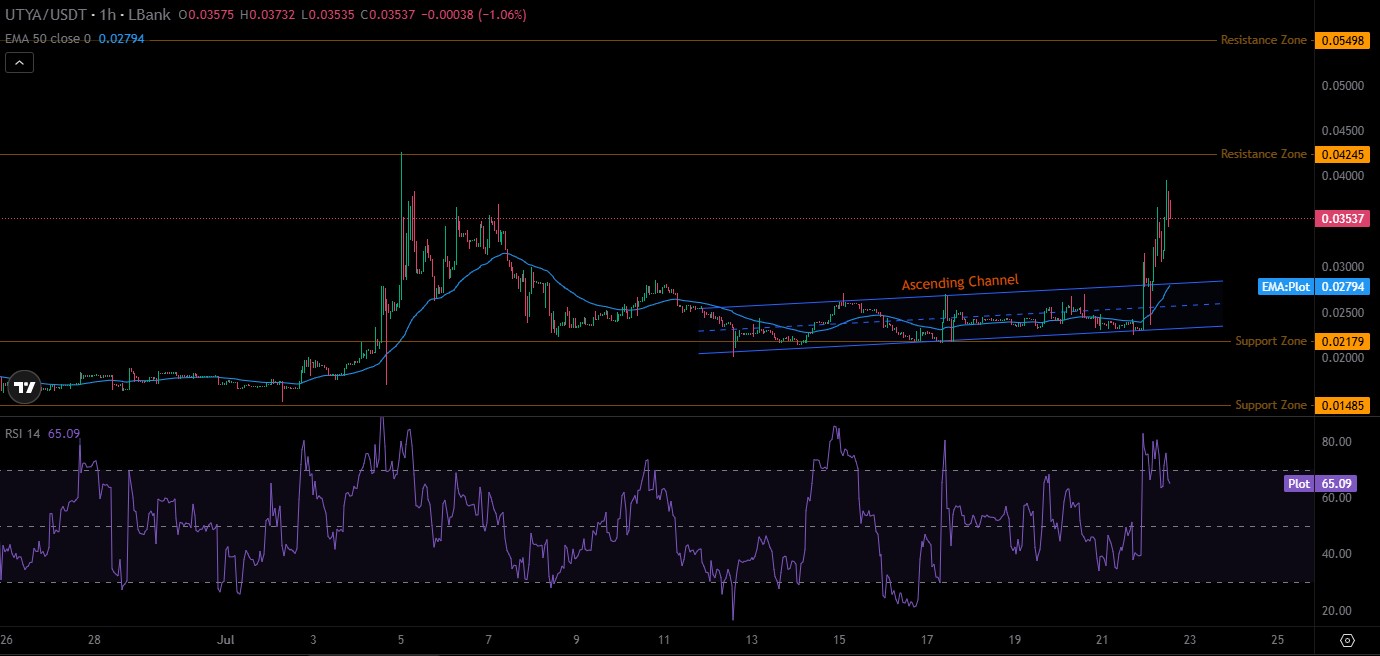
The trendline reading is bullish on the short-term chart. Price sits above both the lower and upper bounds of the 1H channel and above the 50 EMA at $0.02794, meaning the near-term trend is up. RSI at 65.09 is warm but has room before hitting classic overbought territory around 80, based on how it's traded over the past three weeks.
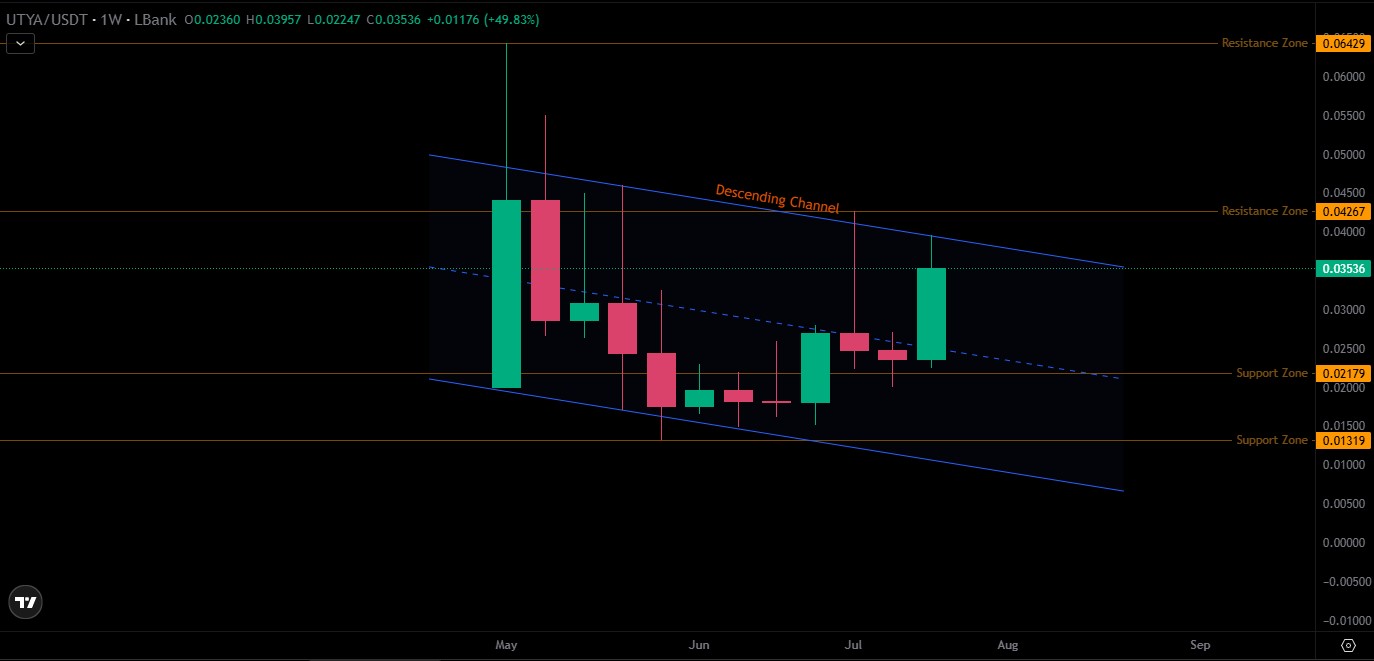
But zoom out to the weekly chart, and the picture gets more mixed. UTYA has traded inside a descending channel since its May high, with the channel's upper trendline now sitting close to the $0.0427 resistance zone. This week's candle is up 49.83%, closing at $0.03536 after opening at $0.02360, and the price is pressing right up against that longer-term ceiling. That's the real test ahead, not the 1H chart alone.
Key levels: support at $0.02179, then $0.01485 on the 1H view (the weekly chart marks a deeper support zone near $0.01319). Resistance sits at $0.04245 on the 1H chart, with the weekly chart flagging $0.04267 and then $0.06429 above that. A clean weekly close above $0.0427 on rising volume would be the stronger continuation signal, since it would also break the descending channel. A 1H close back below roughly $0.0300, the current short-term channel floor, would flip the near-term thesis. Large caps show a similar setup logic in the Bitcoin bull-bear case, just at a very different liquidity scale.
Source: TradingView, UTYA/USDT 1H chart, LBank UTYA data feed, July 22, 2026.
On-Chain Snapshot: Holder Concentration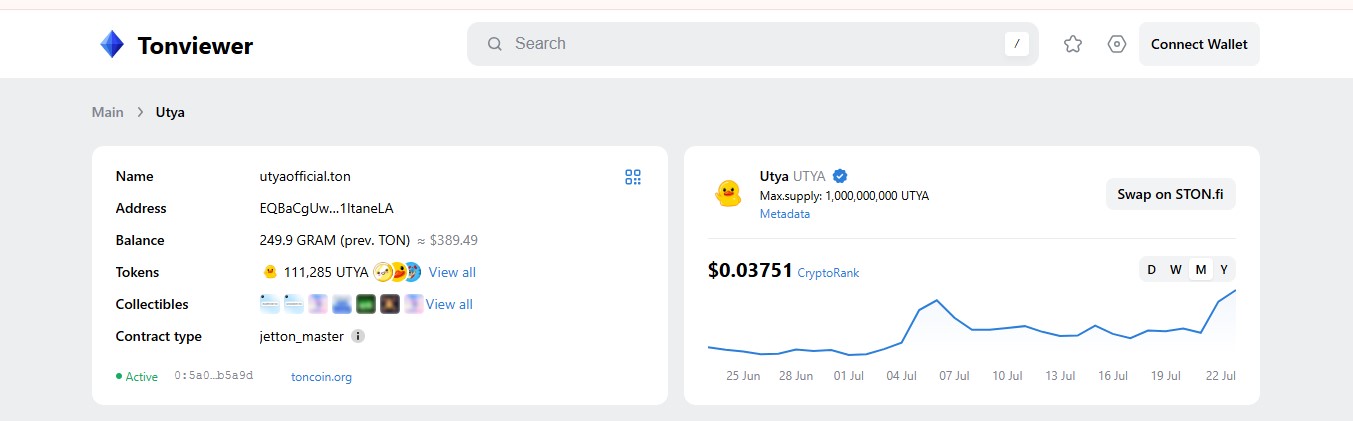
Utya's holder base sits at 8,923 wallets, per Tonviewer. That's a modest but real distribution for a meme coin this size.
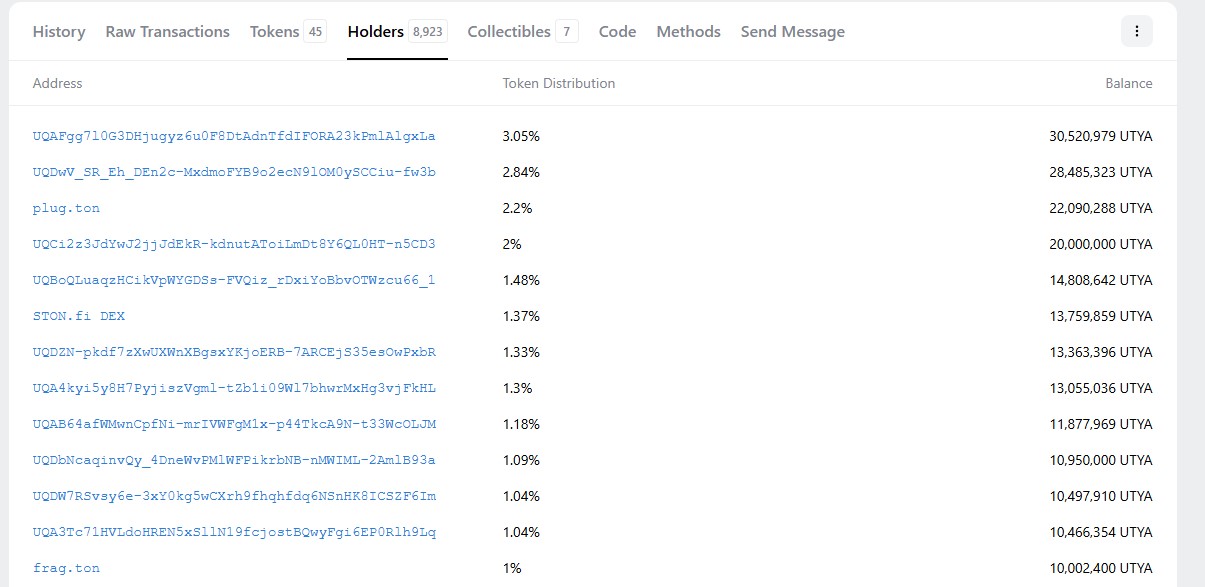
Concentration is worth flagging. The top holder controls 3.05% of supply (roughly 30.5M UTYA), and the top twelve wallets shown on-chain, including the STON.fi DEX pool at 1.37%, add up to close to a fifth of total supply.
That's not extreme for a meme coin, but it's high enough that a single large wallet moving could swing price meaningfully in either direction, given daily volume is still under $2M. This kind of wallet-level detail is worth checking against broader blockchain ecosystem news whenever a token spikes suddenly.
Source: UTYA jetton holder data via Tonviewer.
Tokenomics And Supply Risk
Utya runs a fixed-supply model. Circulating supply, total supply, and max supply are all 1,000,000,000 UTYA, per the CoinGecko UTYA price page. There's no visible emissions schedule or unlock cliff in the data reviewed here, which removes one common source of sell pressure that plagues newer token launches.
That doesn't remove risk entirely. With supply fully circulating, the risk shifts from unlocks to concentration; see the holder breakdown above. If there's a team or treasury wallet among the top holders, its activity should be tracked directly on Tonviewer rather than assumed. It's also worth comparing how the token trades across crypto exchange listings beyond just LBank.
Original Analysis: Liquidity-to-Market-Cap Check
Here's a number that doesn't show up on a standard price page: UTYA's 24h volume on CoinGecko ($1.44M) against its market cap ($37.24M) puts the volume-to-market-cap ratio at roughly 3.9%.
For context, a healthy, liquid token usually trades in the 10-20%+ range during active periods. A sub-5% ratio on a day when price is already up over 50% suggests this move is running on relatively thin liquidity. That's not automatically bearish, but it does mean slippage risk is real for anyone trying to enter or exit a meaningful position, and it means the pump could reverse just as fast as it built if buyers step back. Larger assets like the ethereum price outlook rarely face this kind of ratio problem, which is part of why mega-cap and micro-cap setups don't compare cleanly.
Historical Context: ATH, ATL, And Where UTYA Sits Now
UTYA's all-time high sits at $0.06261, set May 7, 2026, per the CoinGecko historical price data. The current price near $0.0358-0.0372 puts the token roughly 40-43% below that high, even after today's rally.
At the other end, UTYA's all-time low was $0.0002191 back on September 5, 2024. From that low, the token is up over 16,900%. That's the kind of range that's normal for a meme coin with a long tail of early history and a much more recent spike into relevance, not unlike the volatility seen in the Solana price outlook during its own early growth phase.
The practical read: today's rally is a recovery move within a broader drawdown, not a fresh all-time-high breakout. That changes the risk profile. Buying a recovery inside a drawdown carries different risks than buying a breakout to new highs.
Why TON Ecosystem Activity Matters For UTYA Specifically
UTYA runs as a jetton on TON, not on Ethereum or Solana, and that detail actually matters for this token specifically.
TON's meme coin activity is heavily tied to Telegram distribution and STON.fi as the dominant DEX for jetton swaps. UTYA's liquidity pool sits directly on STON.fi, per the holder data above, which means the token's tradability depends on TON wallet adoption (Tonkeeper, Tonviewer-linked wallets) and STON.fi's own liquidity depth, not on broader EVM meme coin trends. A liquidity migration or a STON.fi outage would hit UTYA's tradability in a way that wouldn't apply to an ERC-20 meme coin with liquidity spread across multiple chains and DEXs, a distinction covered in latest crypto market news roundups too.
Price Scenarios: Bull, Base, And Bear Case
| Scenario | Conditions | Target | Timeframe | Invalidation |
|---|---|---|---|---|
| Bull Case | Volume holds above recent average, price clears both the $0.04245 short-term resistance and the weekly descending channel's $0.0427 ceiling on rising volume, broader TON meme coin sector stays hot | $0.0550-$0.0643 | 1-3 weeks | Rejection at the $0.0425-$0.0427 zone with falling volume, or a close back under $0.0300 |
| Base Case | Price consolidates inside the current ascending channel, chops between support and resistance while momentum cools, weekly descending channel resistance keeps a lid on it | $0.0300-$0.0425 range | 1-2 weeks | A daily close below the channel floor near $0.0290, breaking channel structure |
| Bear Case | Today's rally fades as thin liquidity can't absorb profit-taking; whale wallets reduce exposure, RSI rolls over from current 65.09 | $0.0218, then $0.0148 | 1-4 weeks | Recovery condition: reclaiming and holding $0.0300 for 48+ hours on rising volume |
The bear case here isn't a footnote. Given the volume-to-market-cap ratio sits under 5%, a fade back toward the $0.0218 support zone is a realistic outcome if this turns out to be a one-day spike rather than a trend change. Watch whether volume stays elevated over the next 48-72 hours. That's the real tell.
Risks To Watch
-
Thin liquidity: a low volume-to-market-cap ratio means larger orders can move price fast in either direction.
-
Holder concentration: top wallets controlling meaningful supply chunks can add volatility.
-
No confirmed catalyst: Today's move isn't tied to a verified news event in the data reviewed, which raises the odds this fades without follow-through.
-
Meme coin sector risk: broad risk-off moves in crypto or a cooling TON meme coin narrative would likely hit UTYA harder than large-cap assets.
-
Single-chain liquidity: UTYA's tradability depends heavily on TON ecosystem tools and STON.fi specifically.
-
Resistance rejection: sharp rallies that stall at resistance, similar to the setup covered in the XRP price prediction at its own resistance zone, can reverse fast once momentum traders exit.
Final Verdict On UTYA Price Prediction
UTYA's rally is real on the chart and backed by genuine volume, but it's happening on thin liquidity, inside a broader drawdown from May's all-time high, without a confirmed catalyst behind it. That's not a reason to dismiss it. It's a reason to size any position around the invalidation levels above rather than the headline percentage gain.
This is speculative analysis based on technical and on-chain data available at the snapshot time above, not financial advice. UTYA is a low-cap meme coin, and prices on assets like this can move sharply in either direction with limited warning. Always verify live prices, volumes, and on-chain data before making any decision, and never risk more than you can afford to lose on a token this volatile.
Disclaimer
This article is for informational and educational purposes only. It is not financial, investment, trading, or legal advice, and nothing here should be treated as a recommendation to buy, sell, or hold UTYA or any other asset.
Cryptocurrency markets, and meme coins in particular, are highly volatile and can lose significant value quickly. Price targets and invalidation levels in this piece are speculative scenarios built from technical and on-chain data at the snapshot time stated above, not guarantees or predictions of future performance. Past performance, including UTYA's prior highs and lows, does not indicate future results.
Do your own research and consult a licensed financial advisor before making any investment decision. Neither the author nor this platform holds any position in UTYA at the time of writing, and this content is not sponsored by the Utya project.
Sources referenced: LBank (UTYA/USDT market data), CoinGecko (Utya price page), Tonviewer (UTYA jetton contract and holders), and TradingView (UTYA/USDT chart). All figures reflect the July 22, 2026 snapshot provided and should be reverified before publishing or acting on them.
0
0

 Manage all your crypto, NFT and DeFi from one place
Securely connect the portfolio you’re using to start.


