Bitcoin Loses $63,000 As Miner Capitulation Extends, Yet Expert Sees Hope at $60,000

0
0

Bitcoin has slipped below the $63,000 level, extending its monthly decline to nearly 30%. The drop reflects more than short-term volatility. It shows deeper structural weakness building across the network and institutional flows.
This weakness is appearing even as Bitcoin enters its longest miner capitulation phase, year-on-year. At the same time, institutional demand through ETFs continues to deteriorate. Together, these forces are now pushing Bitcoin toward one of its most important support zones this cycle.
Bearish Pattern And Miner Income Collapse Explain Weakness
Bitcoin’s price structure has started to break down on the 8-hour chart. A head-and-shoulders pattern has formed, and the neckline of this pattern now sits near the $60,000 zone, making this level the most important short-term support.
Want more token insights like this? Sign up for Editor Harsh Notariya’s Daily Crypto Newsletter here.
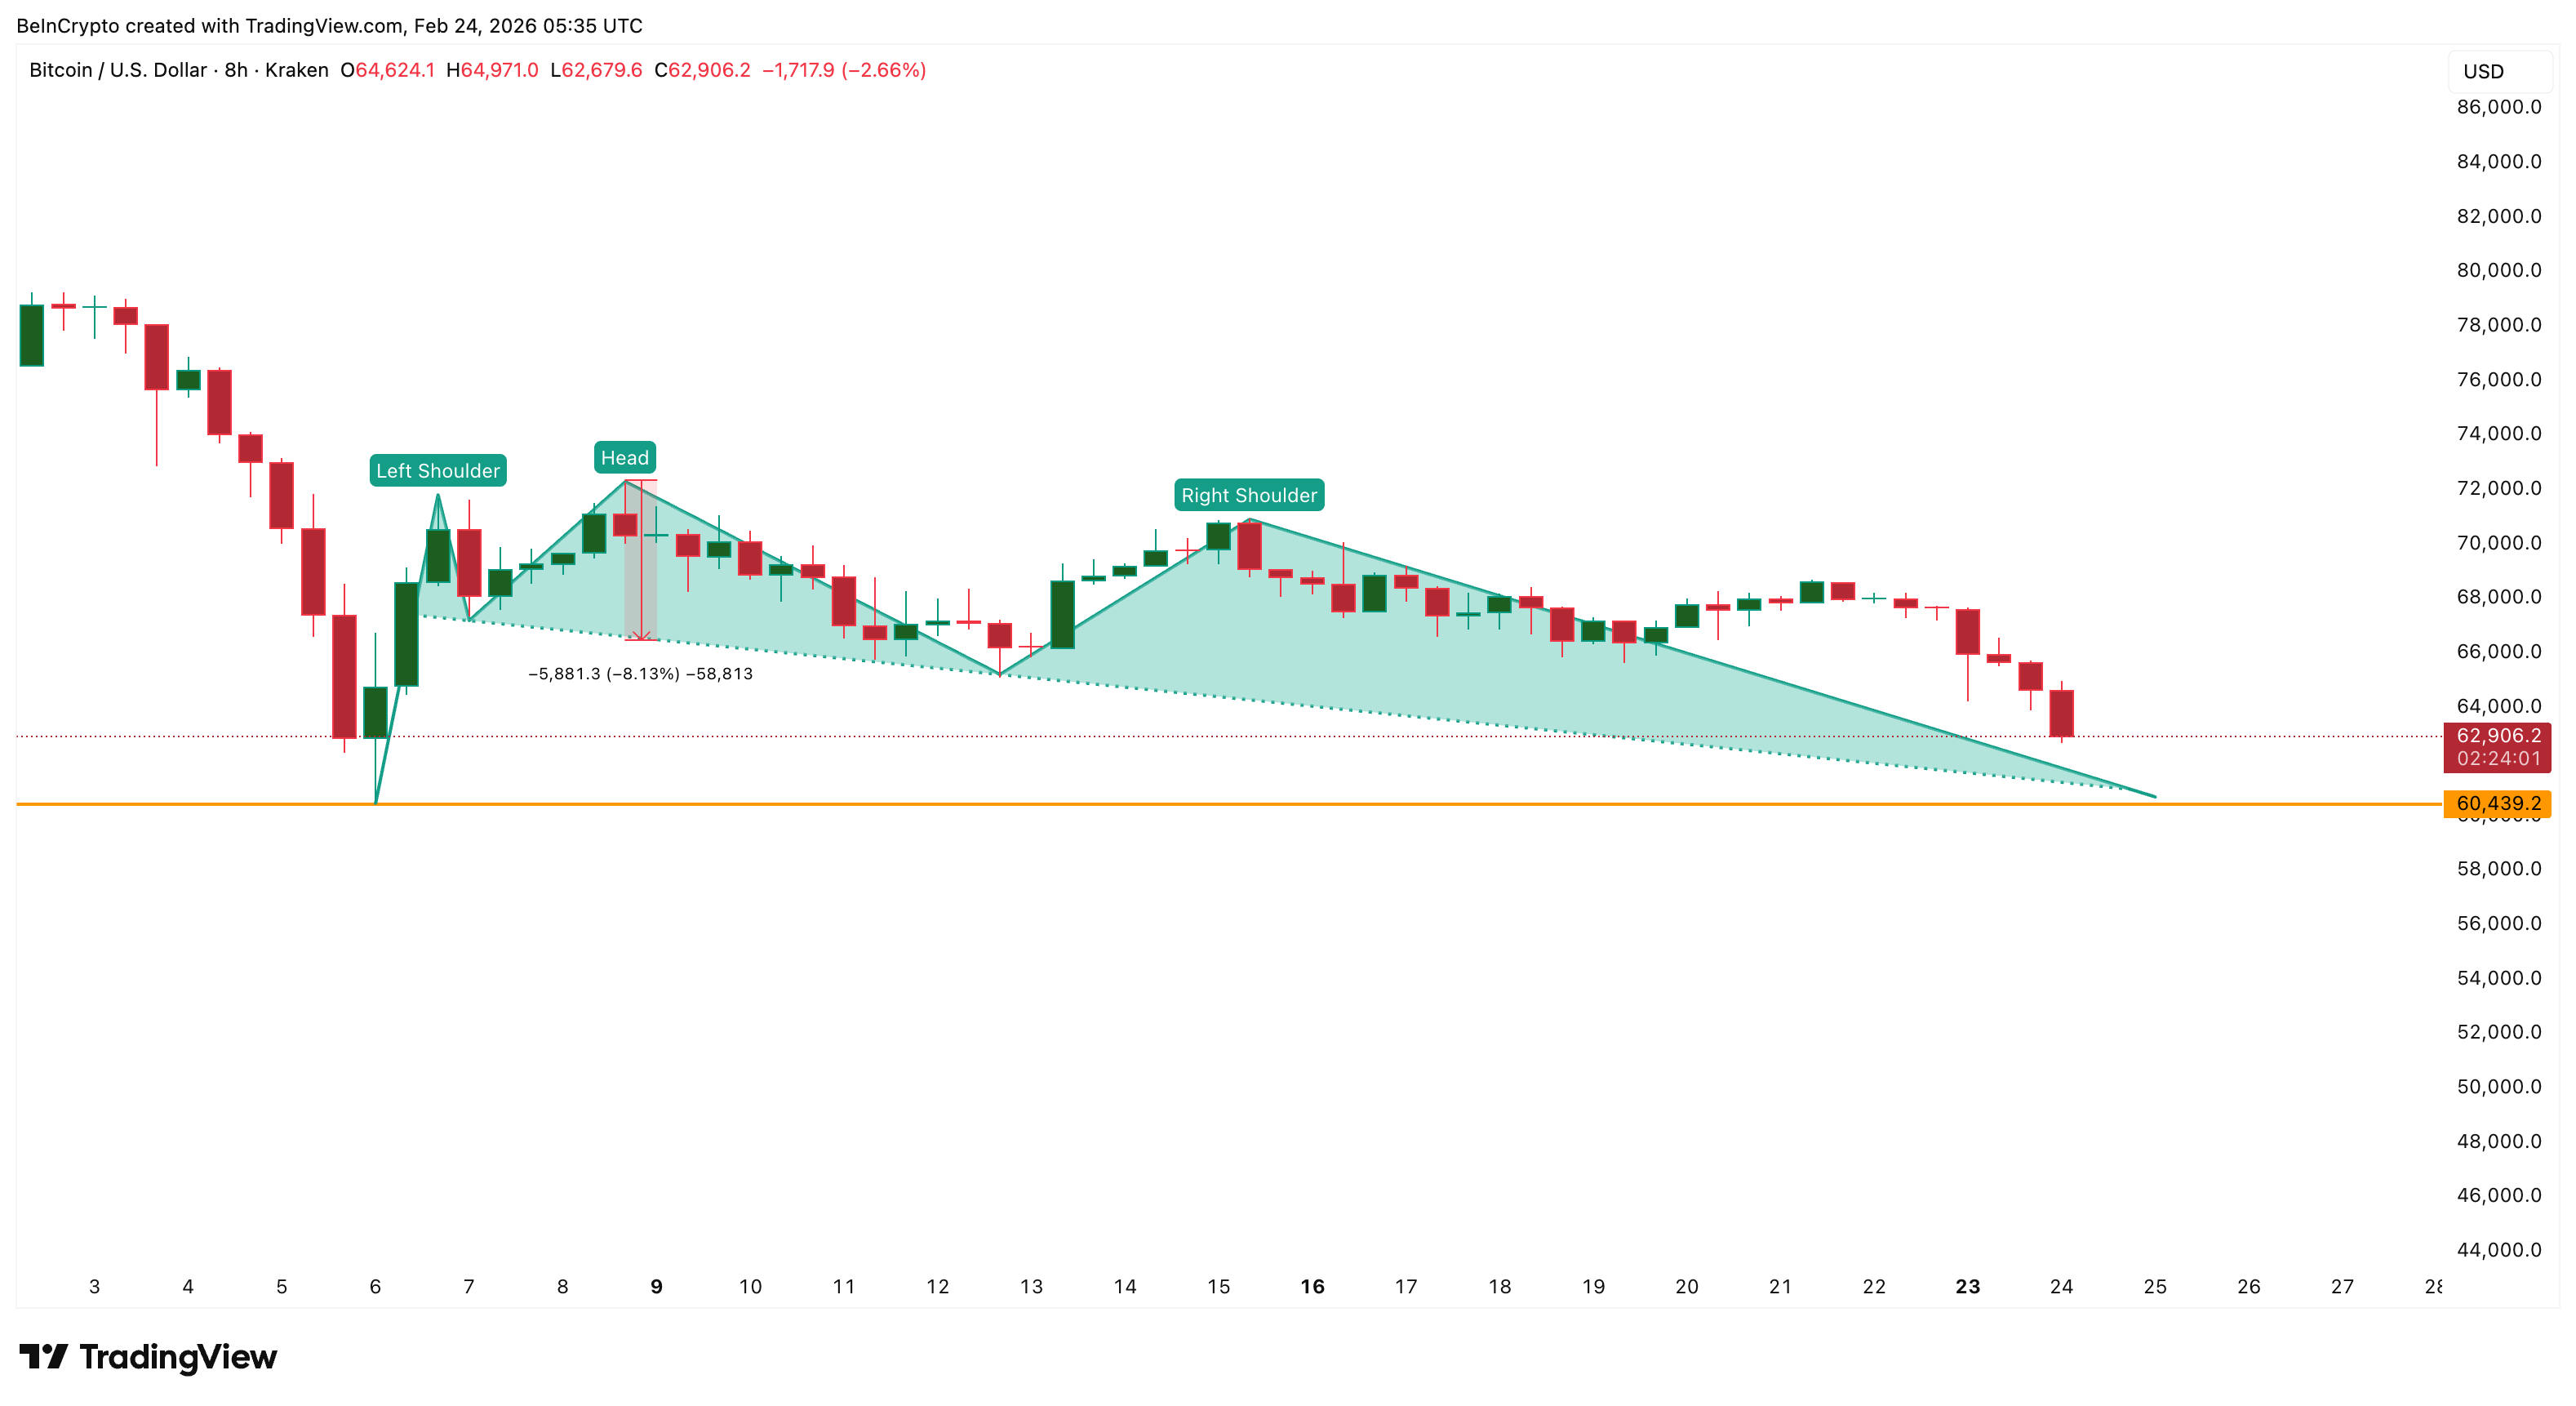 BTC Structure: TradingView
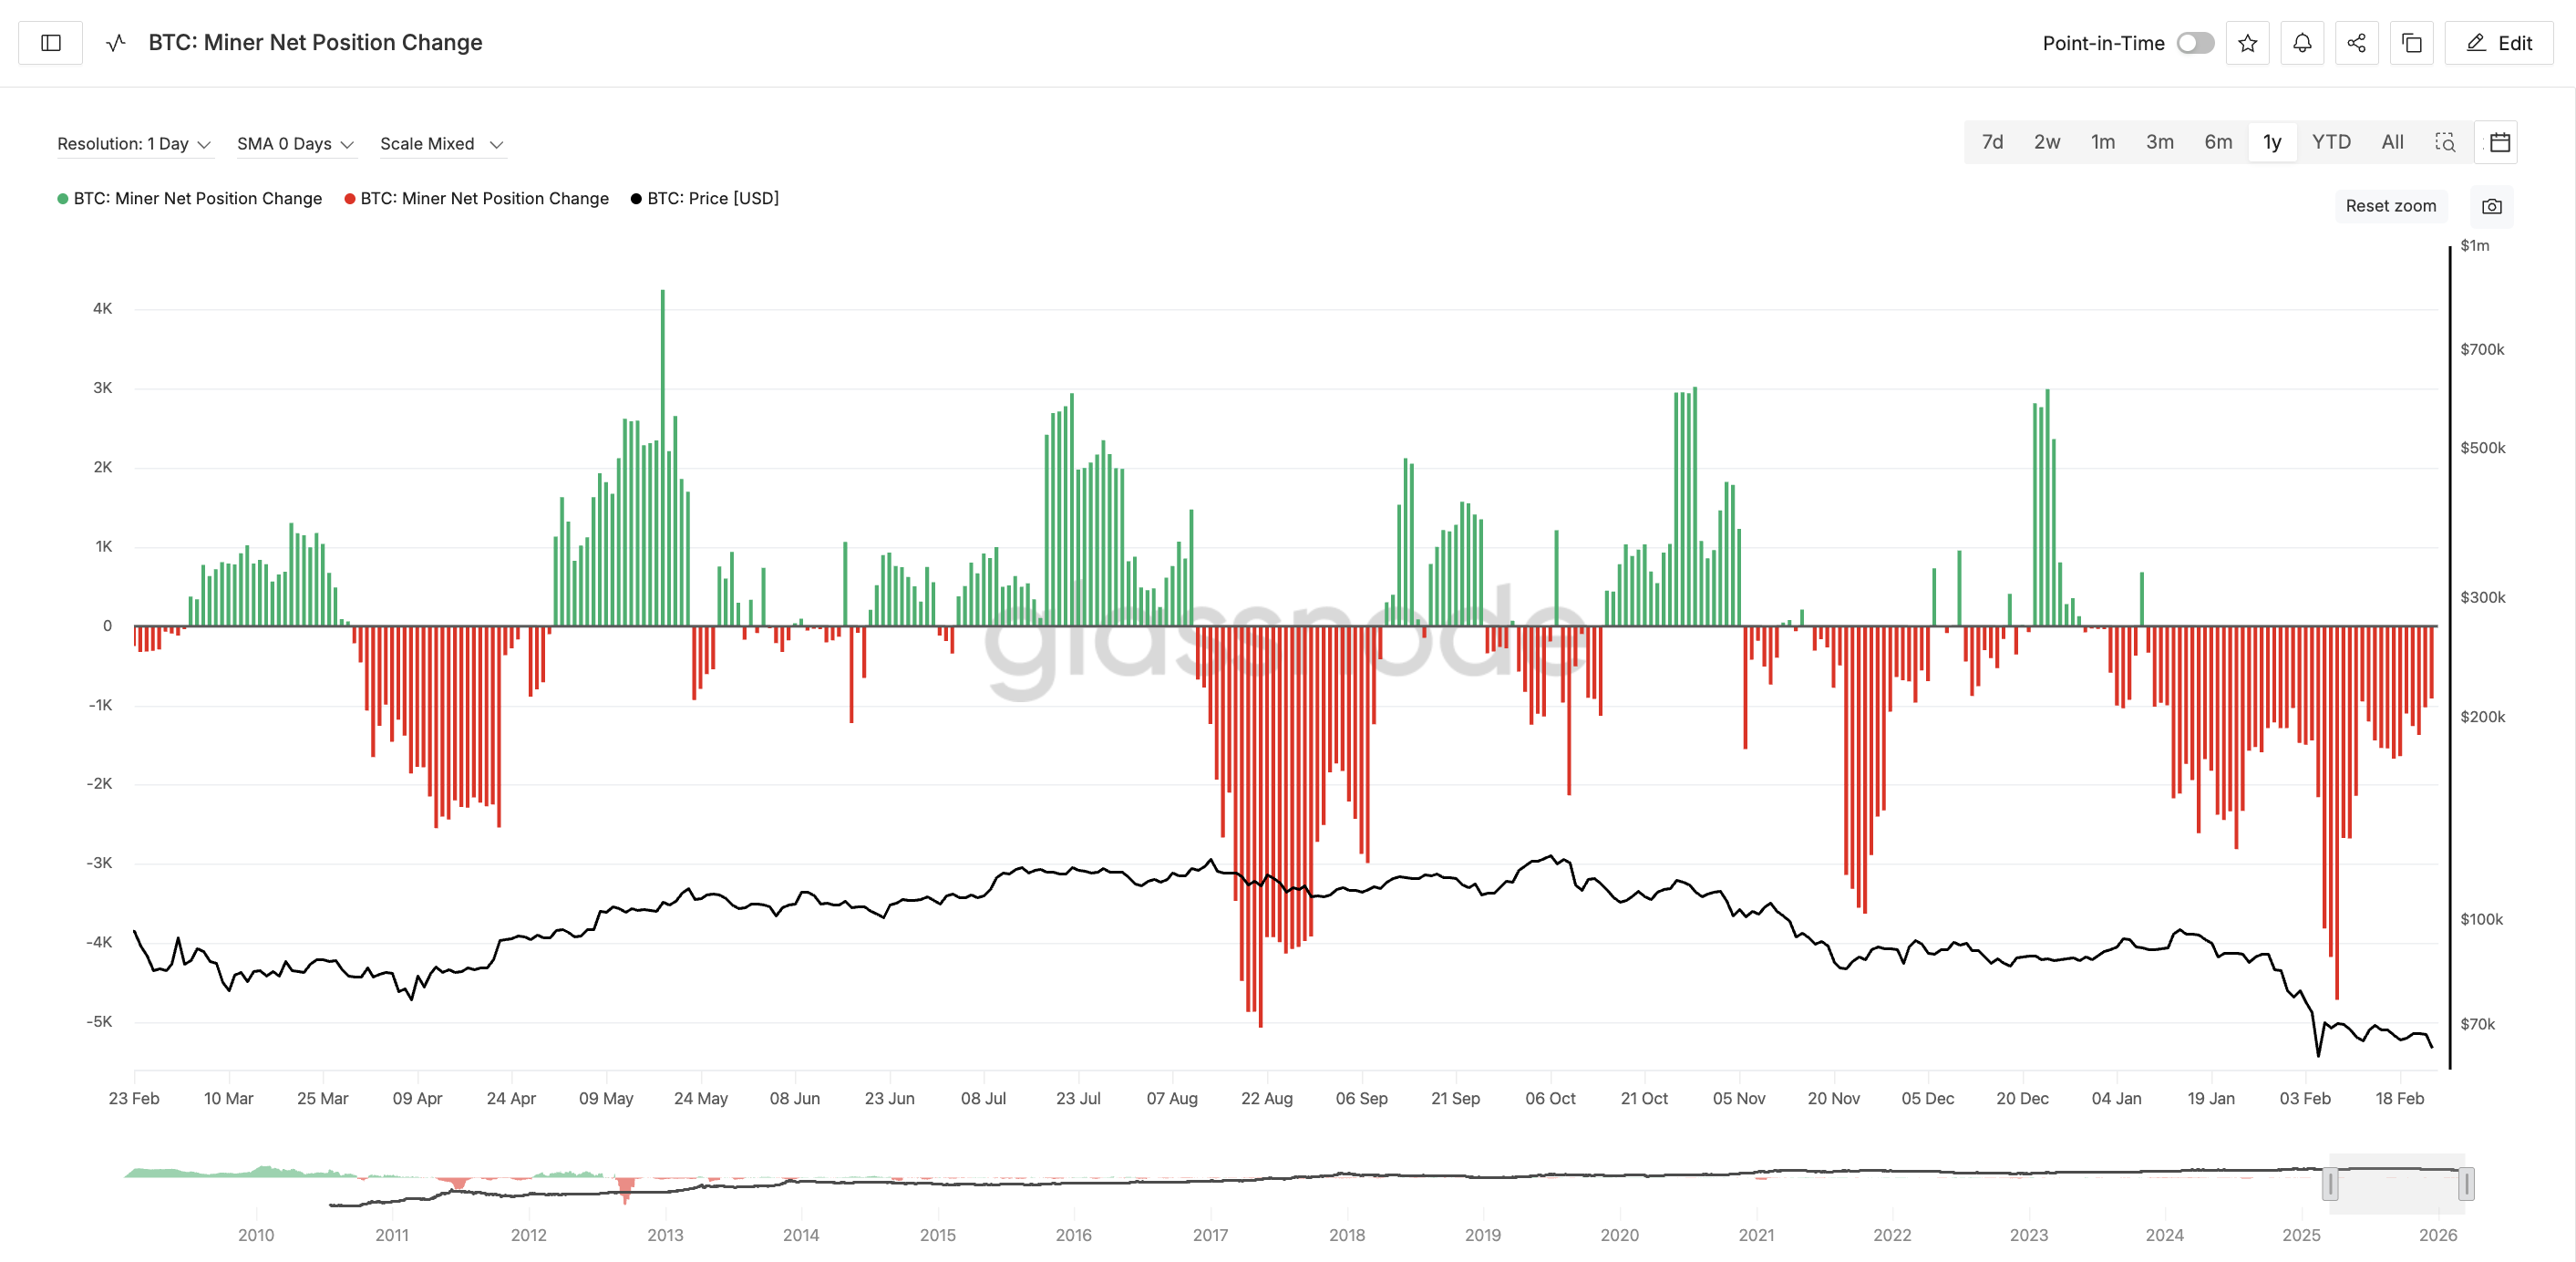
This technical weakness comes as miners continue selling aggressively. Glassnode data shows the miner net position change metric has remained negative continuously from January 9 through February 23. This 46-day stretch marks the longest uninterrupted miner capitulation phase in the year-on-year timeframe. The peak of this stretch was seen on February 6, two days after the BTC price bottomed around $60,400.
 Miner Capitulation Phase: Glassnode
Miner capitulation happens when miners sell more Bitcoin than they accumulate. This usually reflects financial pressure rather than profit-taking.
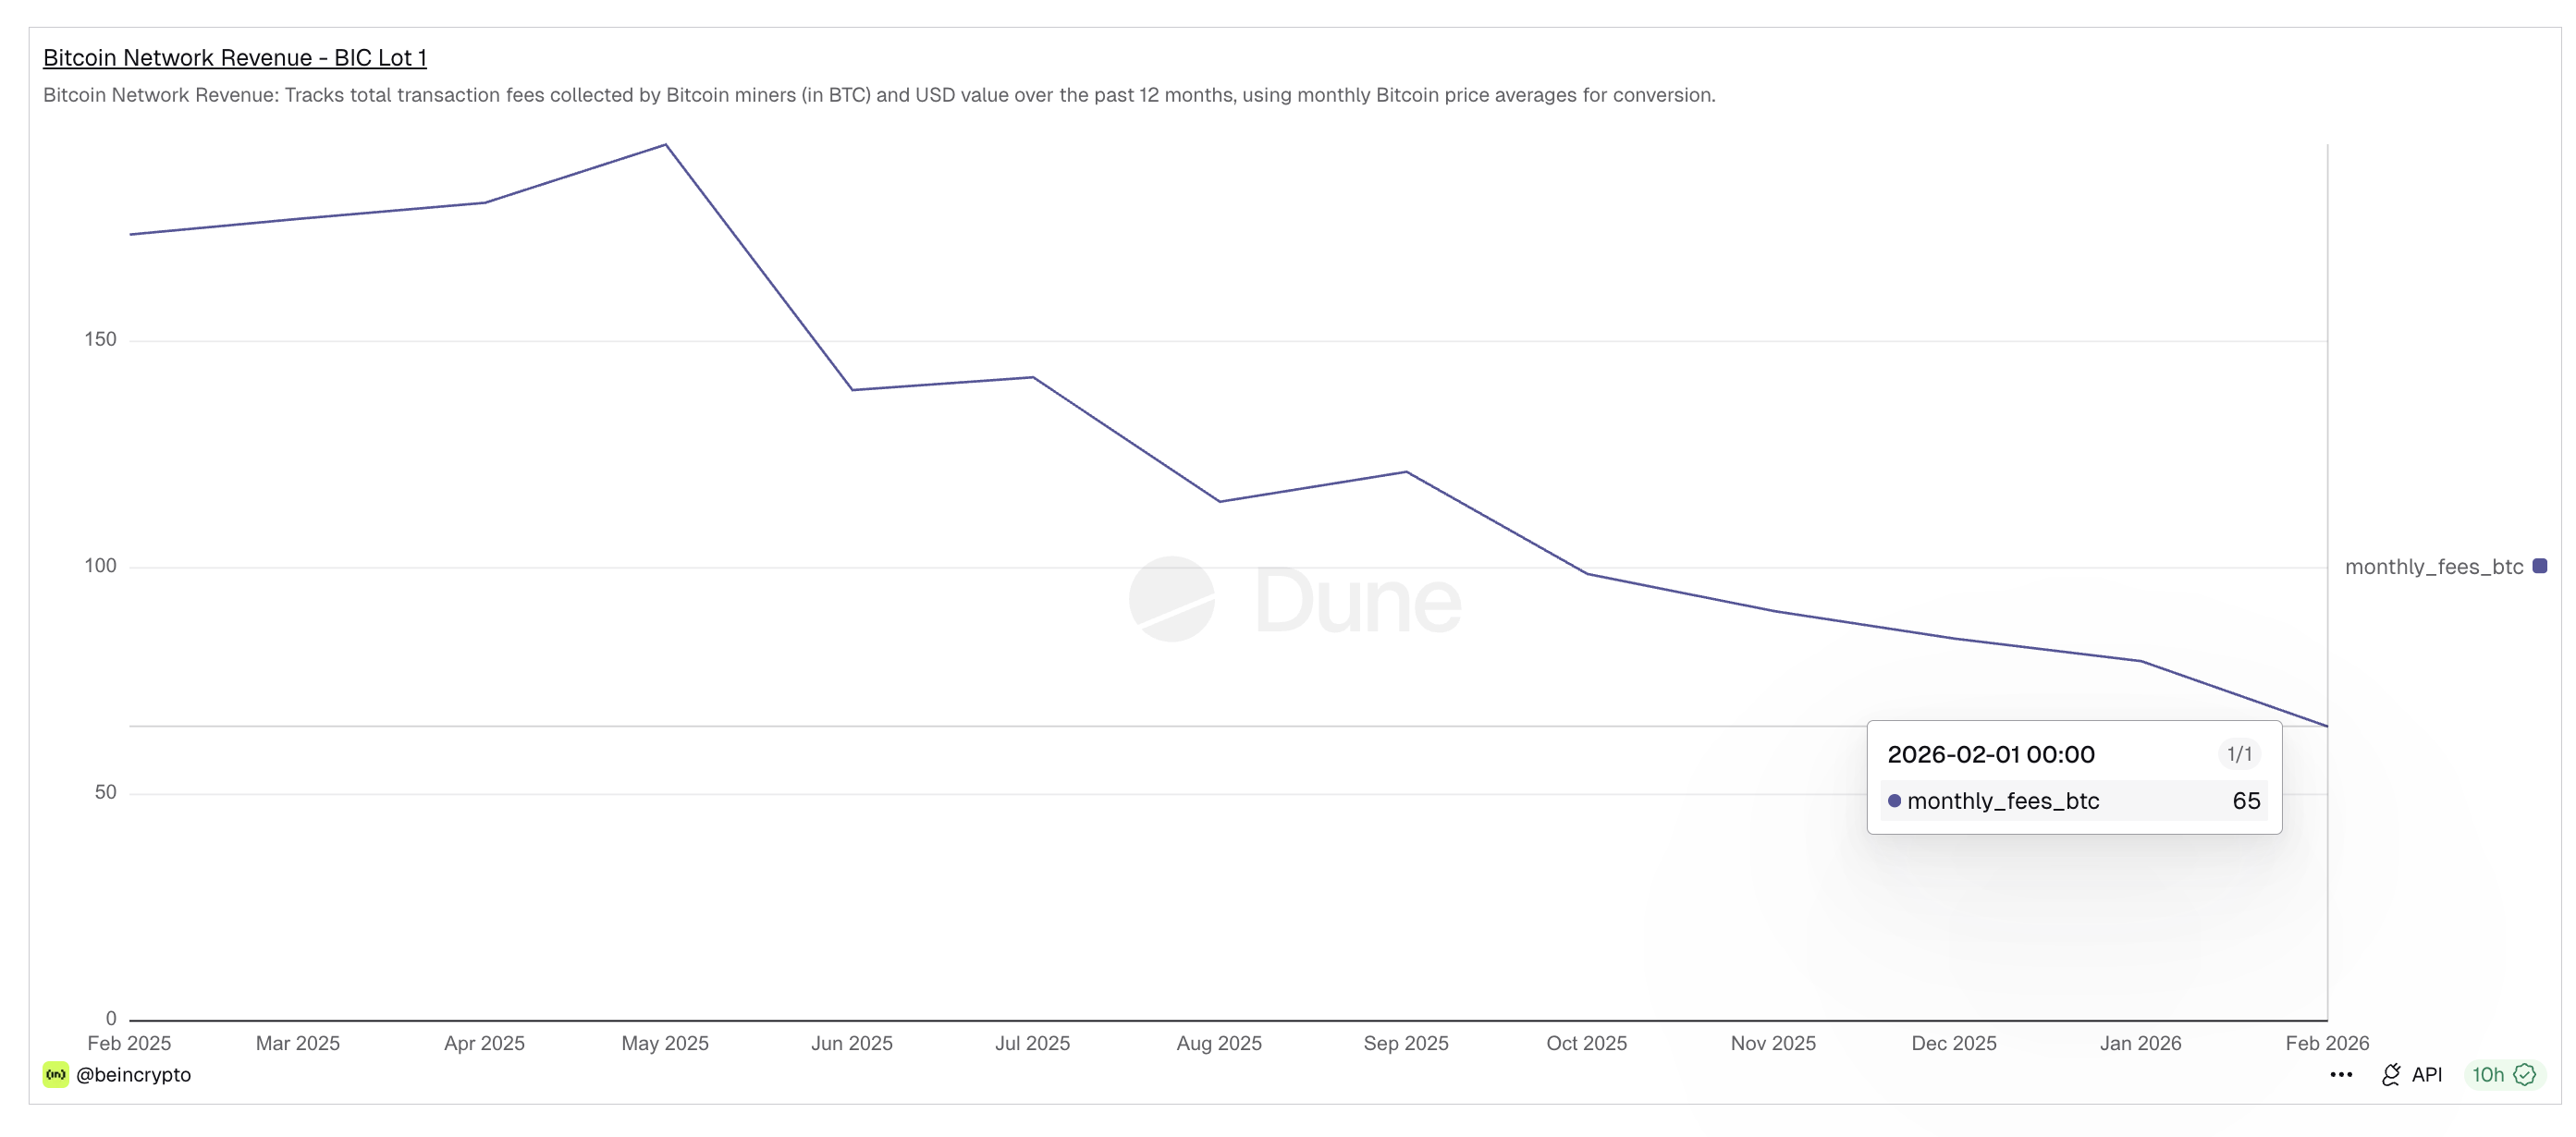
BeInCrypto’s exclusive Dune dashboard helps explain the reason behind this shift. Bitcoin network revenue, which tracks transaction fees earned by miners, has collapsed sharply over the past year. Monthly fees fell from 194 BTC in May 2025 to just 65 BTC by February 2026. This represents a nearly two-thirds drop in miner income.
 Miner Income Dropping: Dune
With earnings falling and BTC correcting, miners have fewer incentives to hold Bitcoin. Instead, they are forced to sell reserves, increasing supply in the market. This sustained selling pressure has weakened Bitcoin’s structure. But miners are not the only group stepping away.
Institutional demand has also started to deteriorate, raising new risks around the critical $60,000 support zone.
ETF Outflows And Realized Price Align With Bitget CEO’s Warning About Critical Support
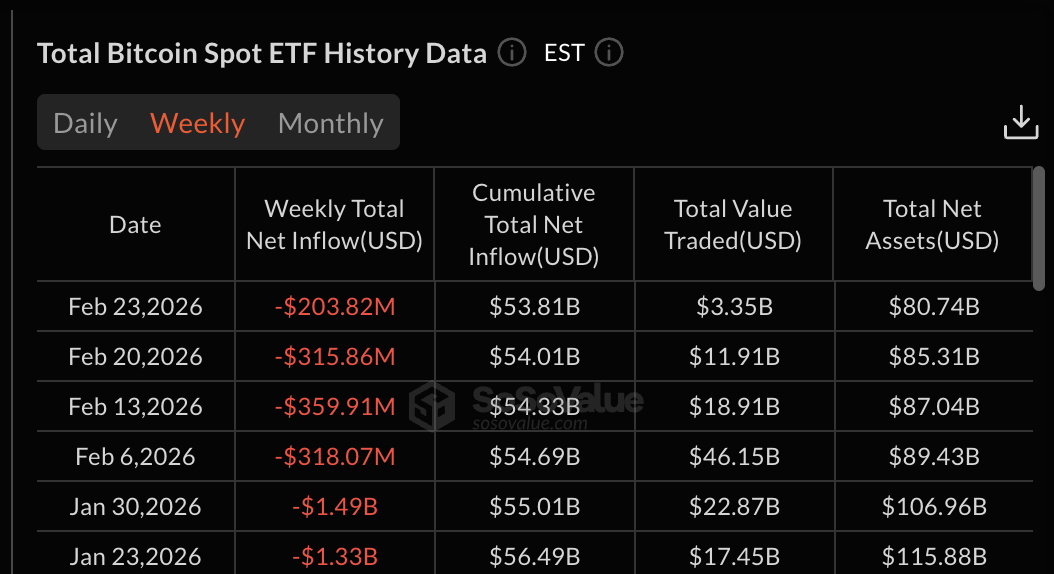
Institutional demand through Bitcoin ETFs has weakened significantly in recent weeks. Bitcoin has now recorded six consecutive weeks of ETF outflows. This marks the longest sustained weekly exit period since spot Bitcoin ETFs launched.
These outflows signal that large investors are reducing exposure instead of accumulating.
 Weak ETF Flows: SoSo Value
Gracy Chen, CEO of Bitget, directly addressed this fragile setup yesterday, right before BTC lost $63,000. She said:
“Today, Bitcoin is trading in the $64,000–$66,000 zone, and we believe macro factors are doing most of the work. Selling pressure is still tangible and heavy, so the asset has become highly sensitive to headlines, and recent turbulence around tariffs has put even more pressure on risk sentiment,” she said.
She also identified the most important level now:
“On the technical side, we think $60,000 remains the key support level so far, while a move lower, caused by a significant macro event, or accelerating ETF outflows could drag the asset down to $50,000. Liquidity there is deep, and support is substantial, so we’d expect a bounce from either level and a renewed attempt higher,” she added.
Her statement highlights how closely ETF flows and macro pressure are now tied to Bitcoin’s structure. This risk becomes clearer when compared with Bitcoin’s realized price.
Realized price currently sits near $54,700. This level represents the average cost basis of all Bitcoin in circulation. Historically, Bitcoin tends to stabilize near this level because it reflects the market’s aggregate holding cost.
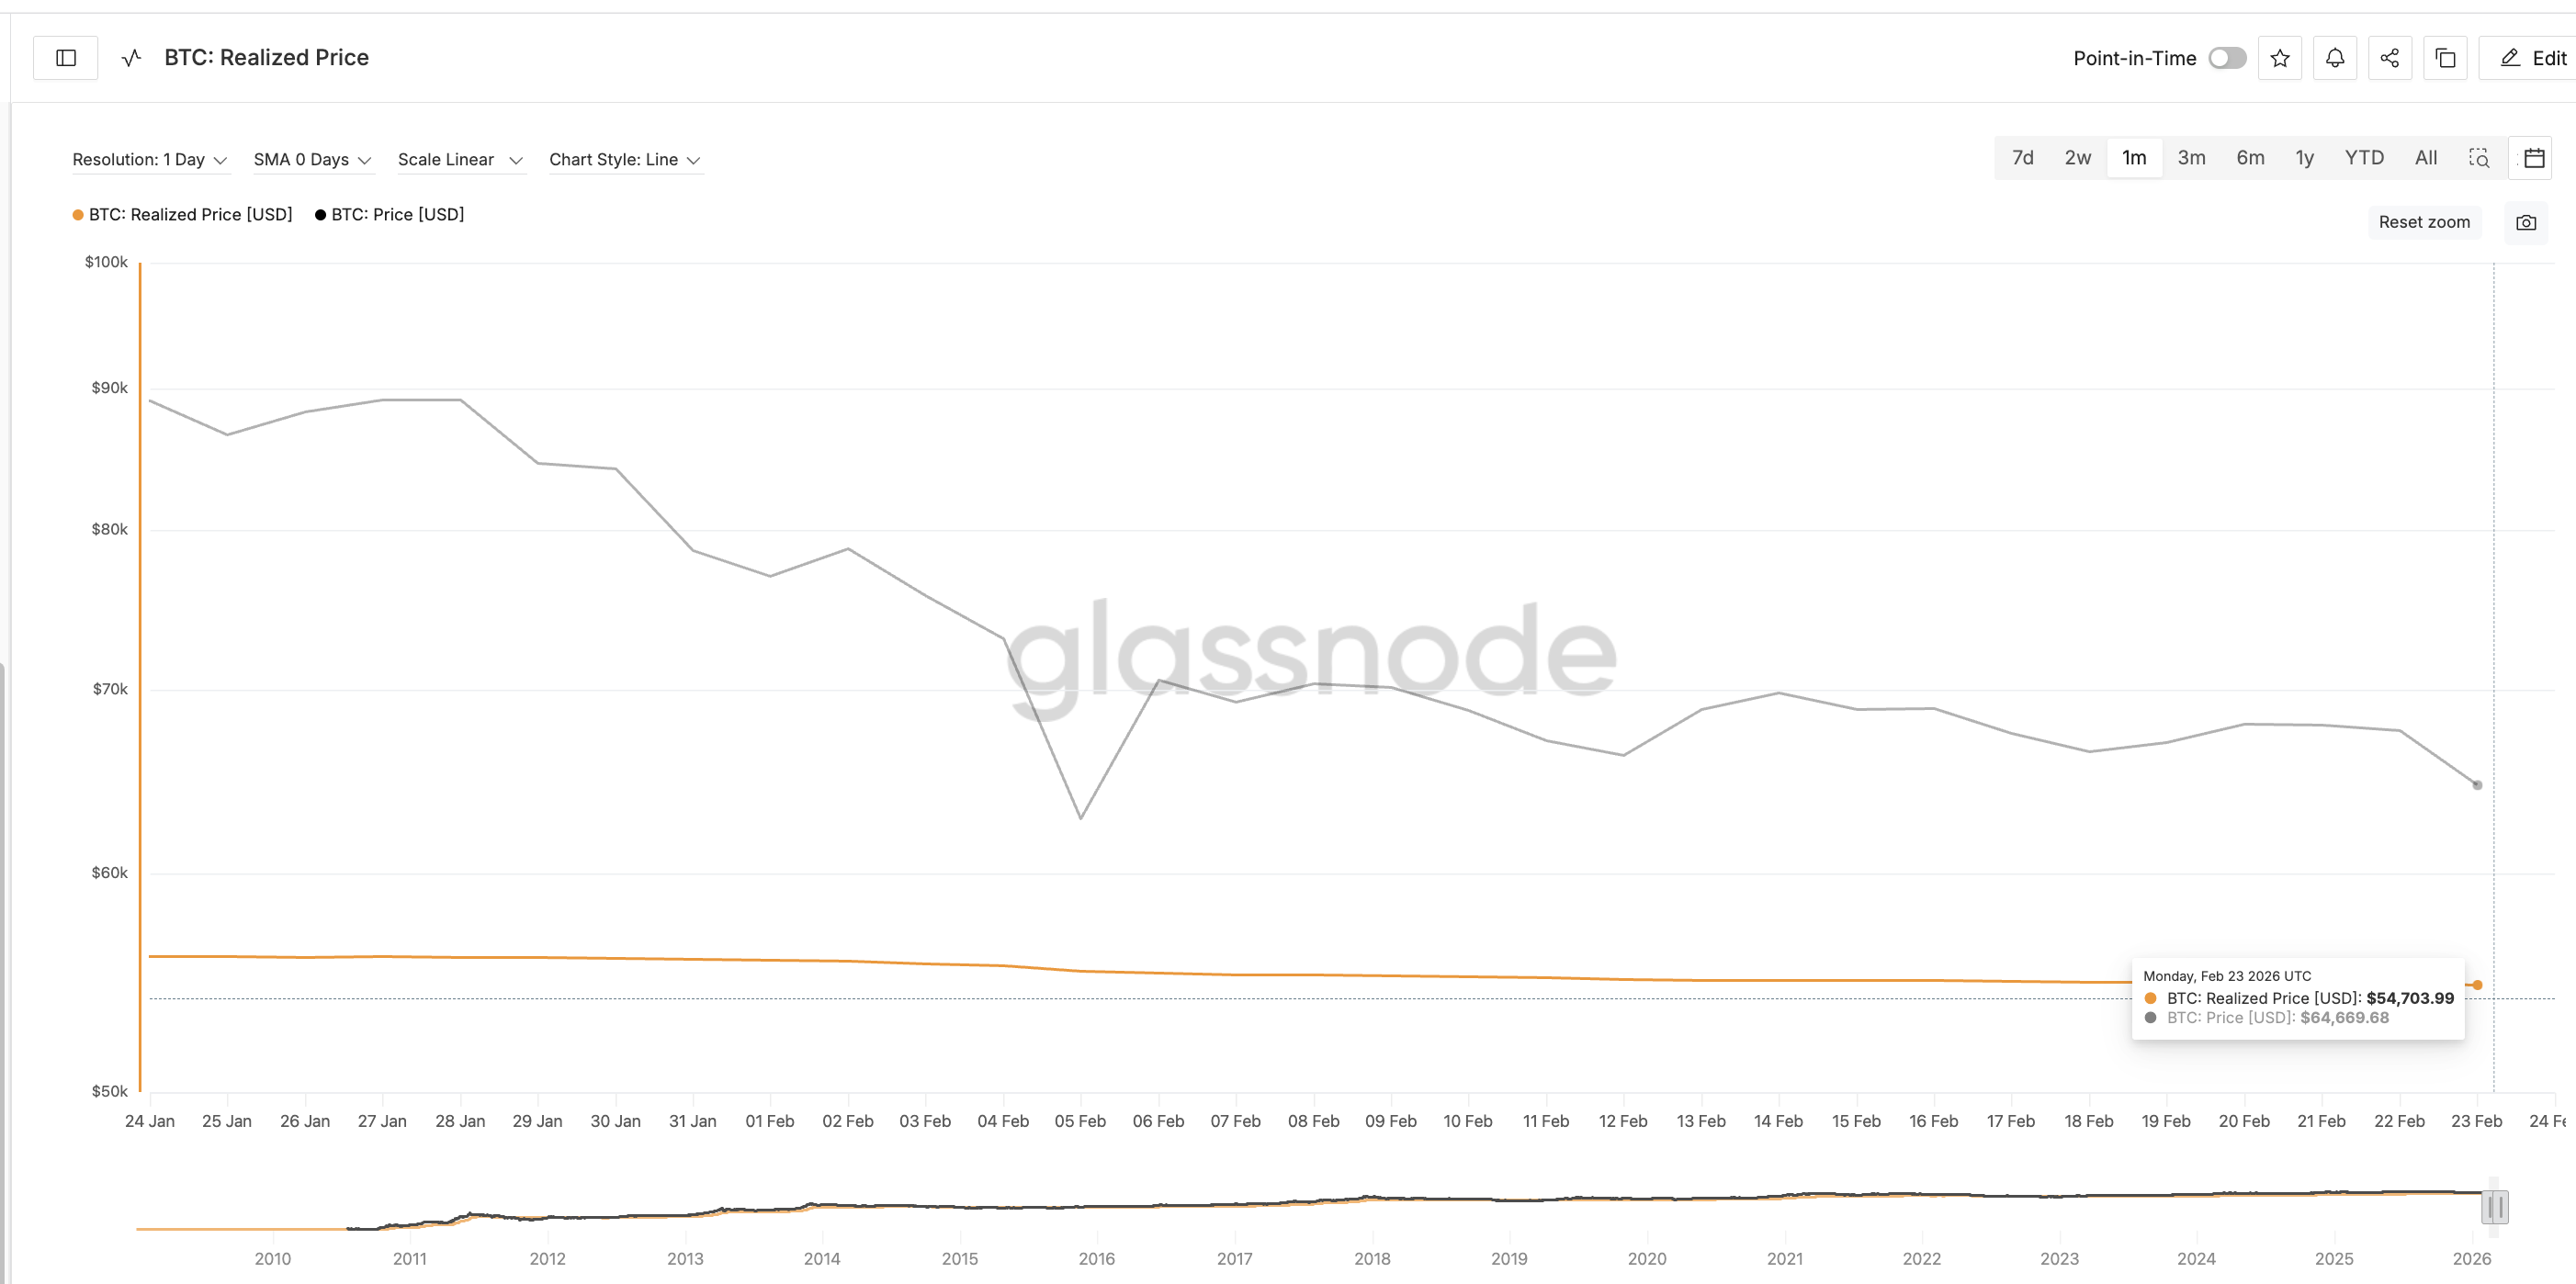 Bitcoin Realized Price: Glassnode
If ETF demand continues weakening and Bitcoin loses $60,000, the realized price could become the next major support zone. This makes the current BTC price region especially critical.
Bitcoin Price Levels Show Why The $60,000 Zone Is The Key
Bitcoin’s recent price action confirms the importance of the $60,000 zone, already highlighted by the Bitget CEO. This level previously served as support on February 6, around the time when miner capitulation reached its current cycle peak. The same level now aligns with a key Fibonacci retracement zone near $60,100.
This convergence makes the area both psychologically and technically important. If Bitcoin manages to hold above this zone, it could stabilize and attempt recovery.
However, a confirmed break below $60,000 would confirm the head-and-shoulders breakdown. Based on the pattern’s structure and technical retracement levels, this could trigger a decline toward $54,800. This level aligns almost exactly with Bitcoin’s realized price.
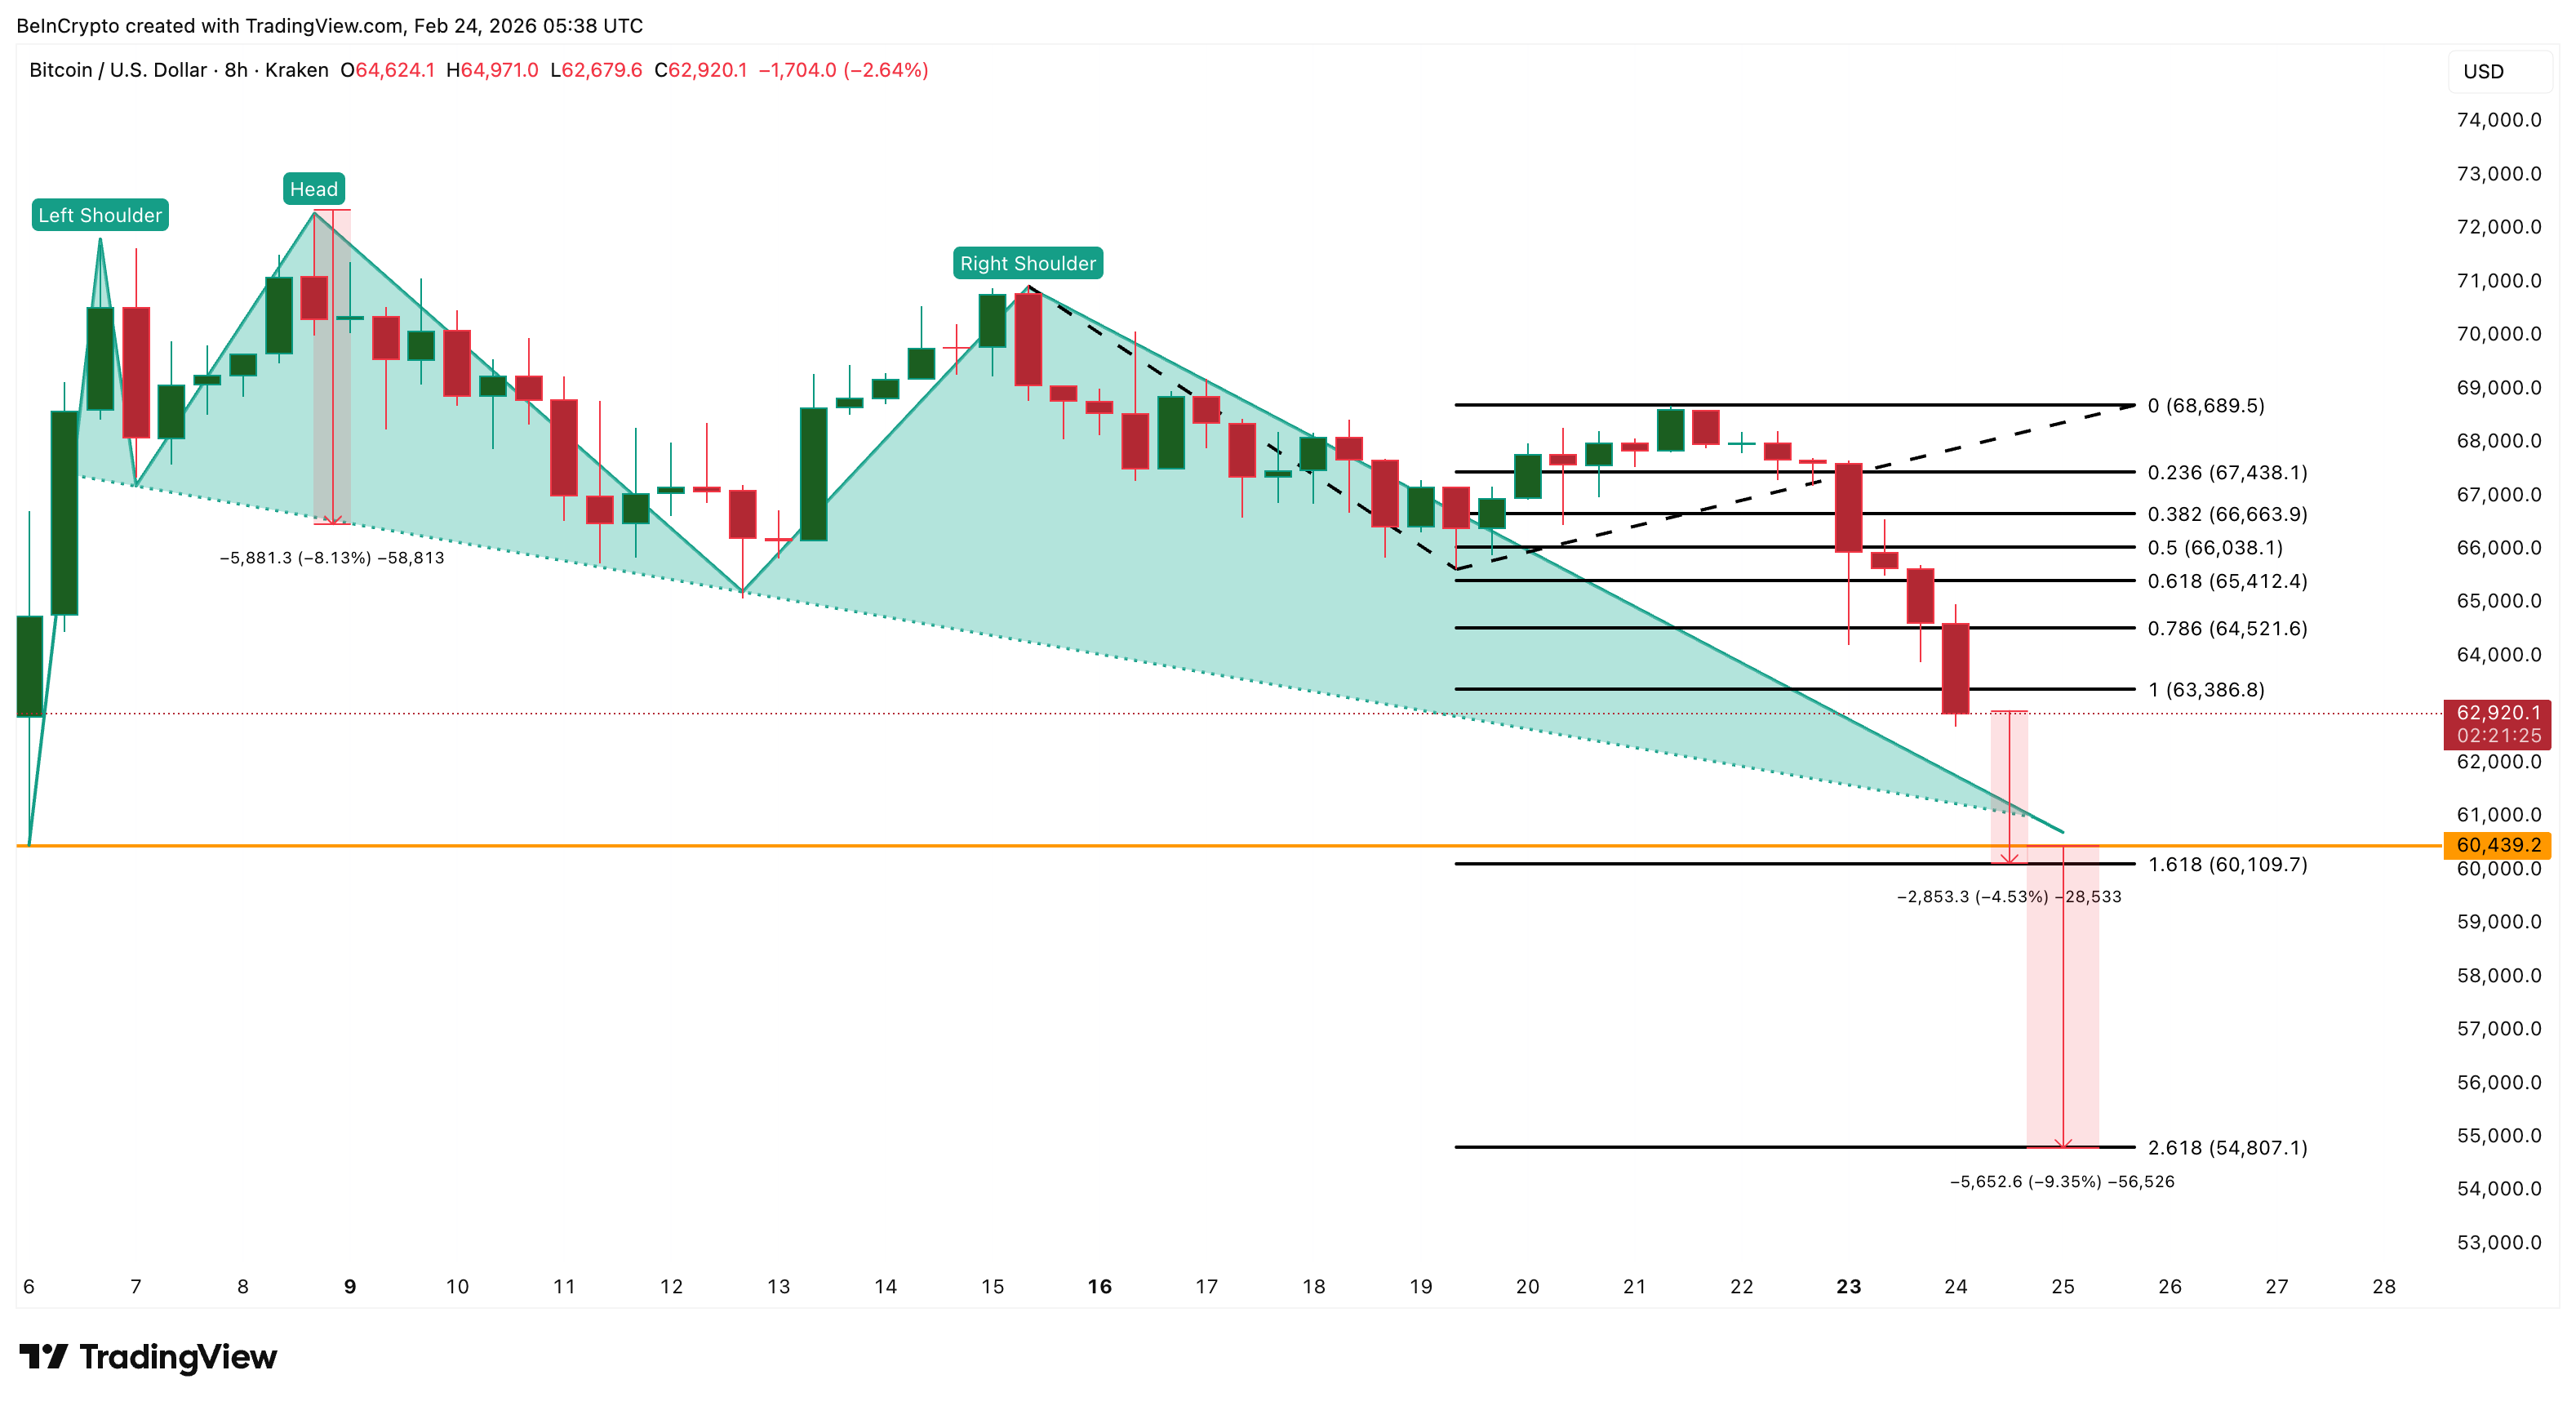 Bitcoin Price Analysis: TradingView
Gracy Chen’s warning reinforces why this zone matters. Her view that $60,000 remains key support, with deeper downside possible if ETF outflows continue, aligns closely with Bitcoin’s current technical structure. For now, Bitcoin stands at a decisive point.
Some strength returns if the BTC price recovers and reclaims the crucial resistance at $63,300, followed by $65,400. However, complete bearish structure invalidation remains out of bounds for now.
Miner capitulation continues to increase supply, while ETF outflows signal weakening institutional demand. Until these pressures ease, the $60,000 level remains the line separating stabilization from a deeper correction.
0
0


 Manage all your crypto, NFT and DeFi from one place
Securely connect the portfolio you’re using to start.

0
0

0
0

0
0

0
0