Solana Price Analysis – SOL Risks a Fall to $76 Amid Weak Derivatives Market

0
0

Highlights:
- The Solana price has decreased by 5% to trade at $80 today.
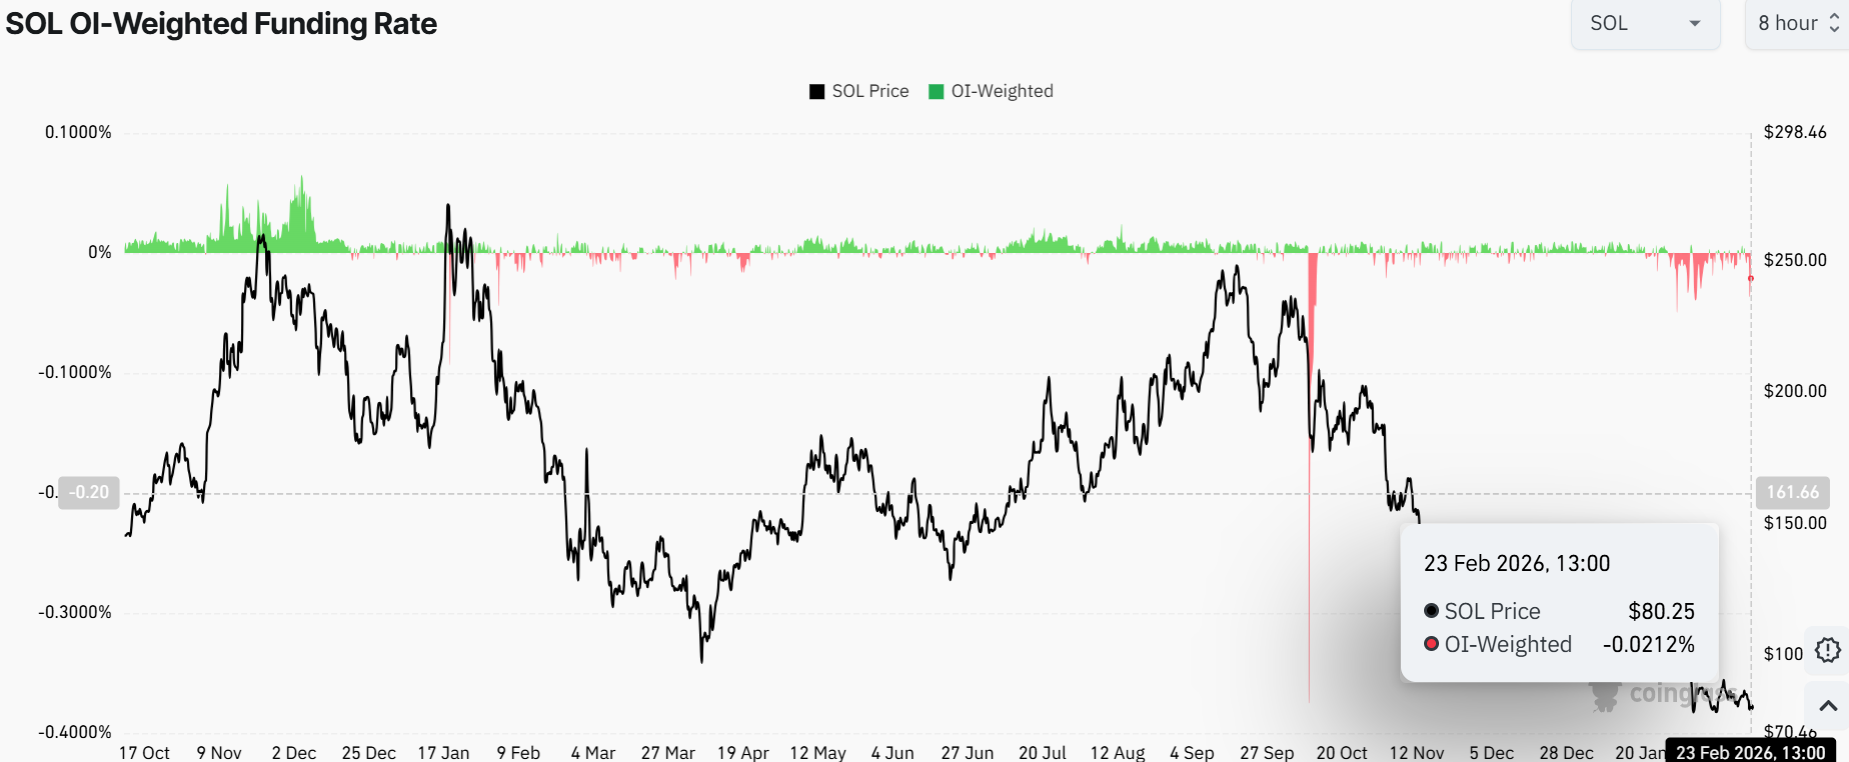
- The derivatives market shows a negative funding rate, as the bearish grip builds.
- The technical picture signals SOL price risks a fall to $76.
On Monday, the Solana (SOL) price remains in the red as the broader crypto market wobbles, led by Bitcoin. Solana is currently down about 5% to $80, despite the daily trading volume rising by 89%. Meanwhile, the derivatives information proves the presence of a bearish mood. This is reinforced as the short bets of SOL have increased in tandem with negative funding rates. On the technical front, the bears are having the upper hand, as SOL price risks further downside to $76.
The long-to-short ratio of Solana is 0.97 on Monday. This value, which is lower than 1, shows that there is bearishness because traders are wagering on a fall in the asset price.

Also helping to add negativity to the outlook is the fact that the funding rates of SOL are at a level that would support a bearish outlook. The data shows that the capital investment rate of SOL had reversed, becoming negative on Saturday. It is currently at -0.0212% on Monday, which is close to the rate of the February 6 lows. Such a negative rate indicates that short positions are being covered by long positions and suggests a bearish mood.
SOL Price Risks a Fall to $76 as Bearish Mood Builds
The SOL/USD 4-hour chart shows the altcoin price action trading below the 50-day Simple Moving Average at $83, signaling a bearish tone. Further, the 200-day SMA at $98 is acting as a long-term barrier, which is cushioning the bulls against any upside movement. The latest drop has seen a massive volume spike by about 80%, indicating panic selling in the SOL market.
Meanwhile, the RSI sits at 37.89, creeping from the oversold territory. This might signal a potential bounce back if the bulls build strength. However, its position below the 50 level indicates that the sellers still have control in the market. In the meantime, investors are in indecision, as the momentum indicators are showing mixed sentiment.
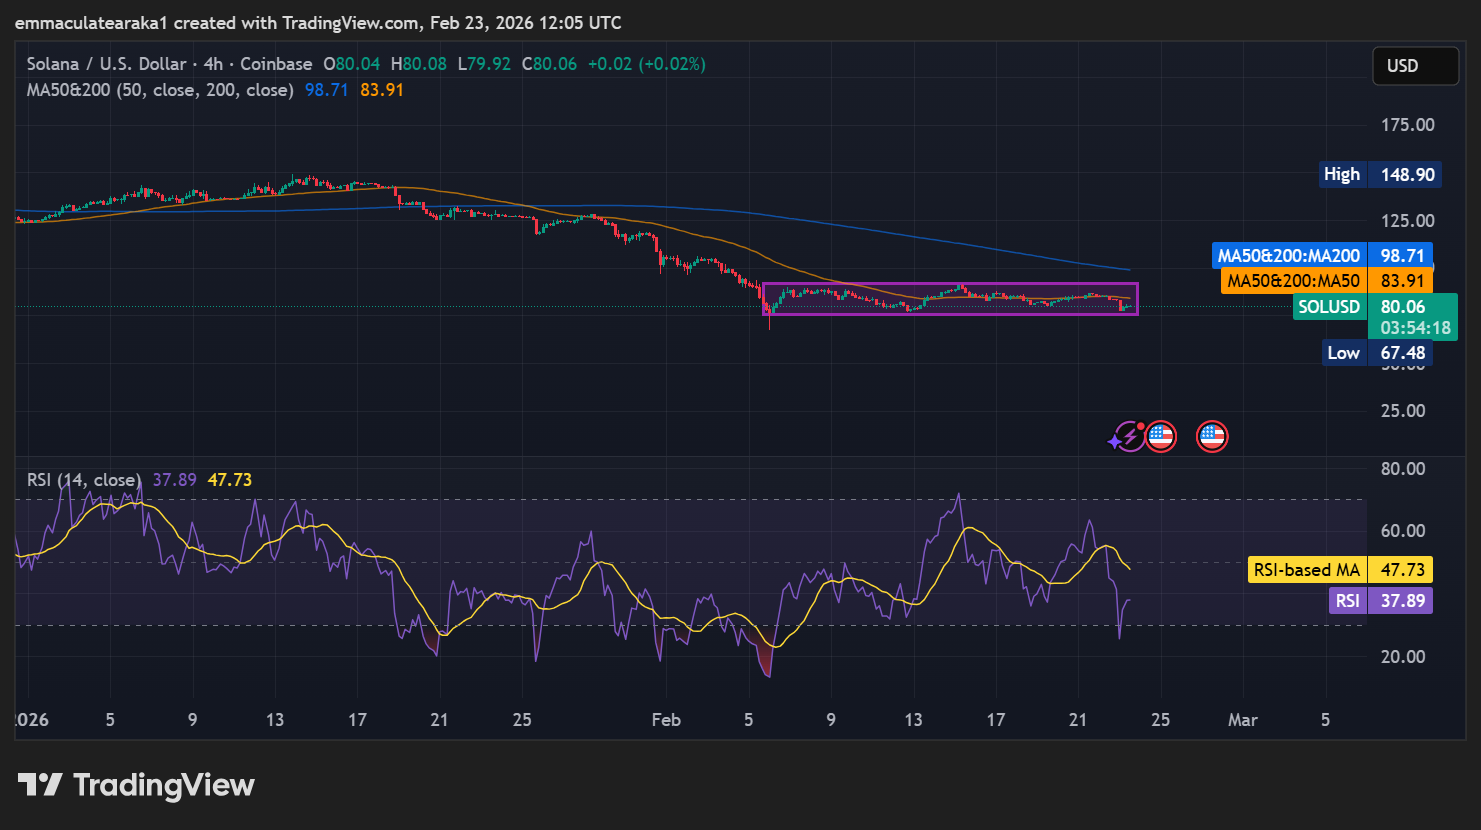
Looking ahead, the short-term outlook is looking bearish. If the SOL price fails to hold above the $83 immediate barrier, there might be a slide to $76-$73. A decisive close below this zone will open the door to a recent low at $67, seen on Feb 6. Moreover, Ali Martinez has noted that the Solana price Super Trend indicator has flashed a sell signal. This may cause SOL to plunge towards $53, $35, and $23 if the $76 support zone breaks.
If you’re holding Solana $SOL, watch this! pic.twitter.com/tel7rI5cjw
— Ali Charts (@alicharts) February 22, 2026
Conversely, a breakout above $83 with solid volume could signal a bullish reversal. This could potentially push Solana toward the $86-$98 zone. For now, SOL traders should watch the $76 support levels keenly as the chart is signaling caution. If there won’t be any clear catalyst, the Solana price may follow the consolidation grind or dip further to $67.
0
0

 Manage all your crypto, NFT and DeFi from one place
Securely connect the portfolio you’re using to start.


0
0

0
0