Ethereum Whales And HODLers Follow Vitalik’s Cue As $1,800 Risk Grows

0
0

Ethereum price remains under pressure in early February as selling momentum builds across both on-chain and technical indicators. The token has slipped below key support levels following a confirmed chart breakdown, while fresh data shows large holders and long-term investors beginning to reduce exposure.
With Vitalik Buterin selling ETH and accumulation slowing, the $1,800 zone is now emerging as a critical near-term downside risk.
Head-and-Shoulders Breakdown Aligns With Vitalik’s ETH Selling
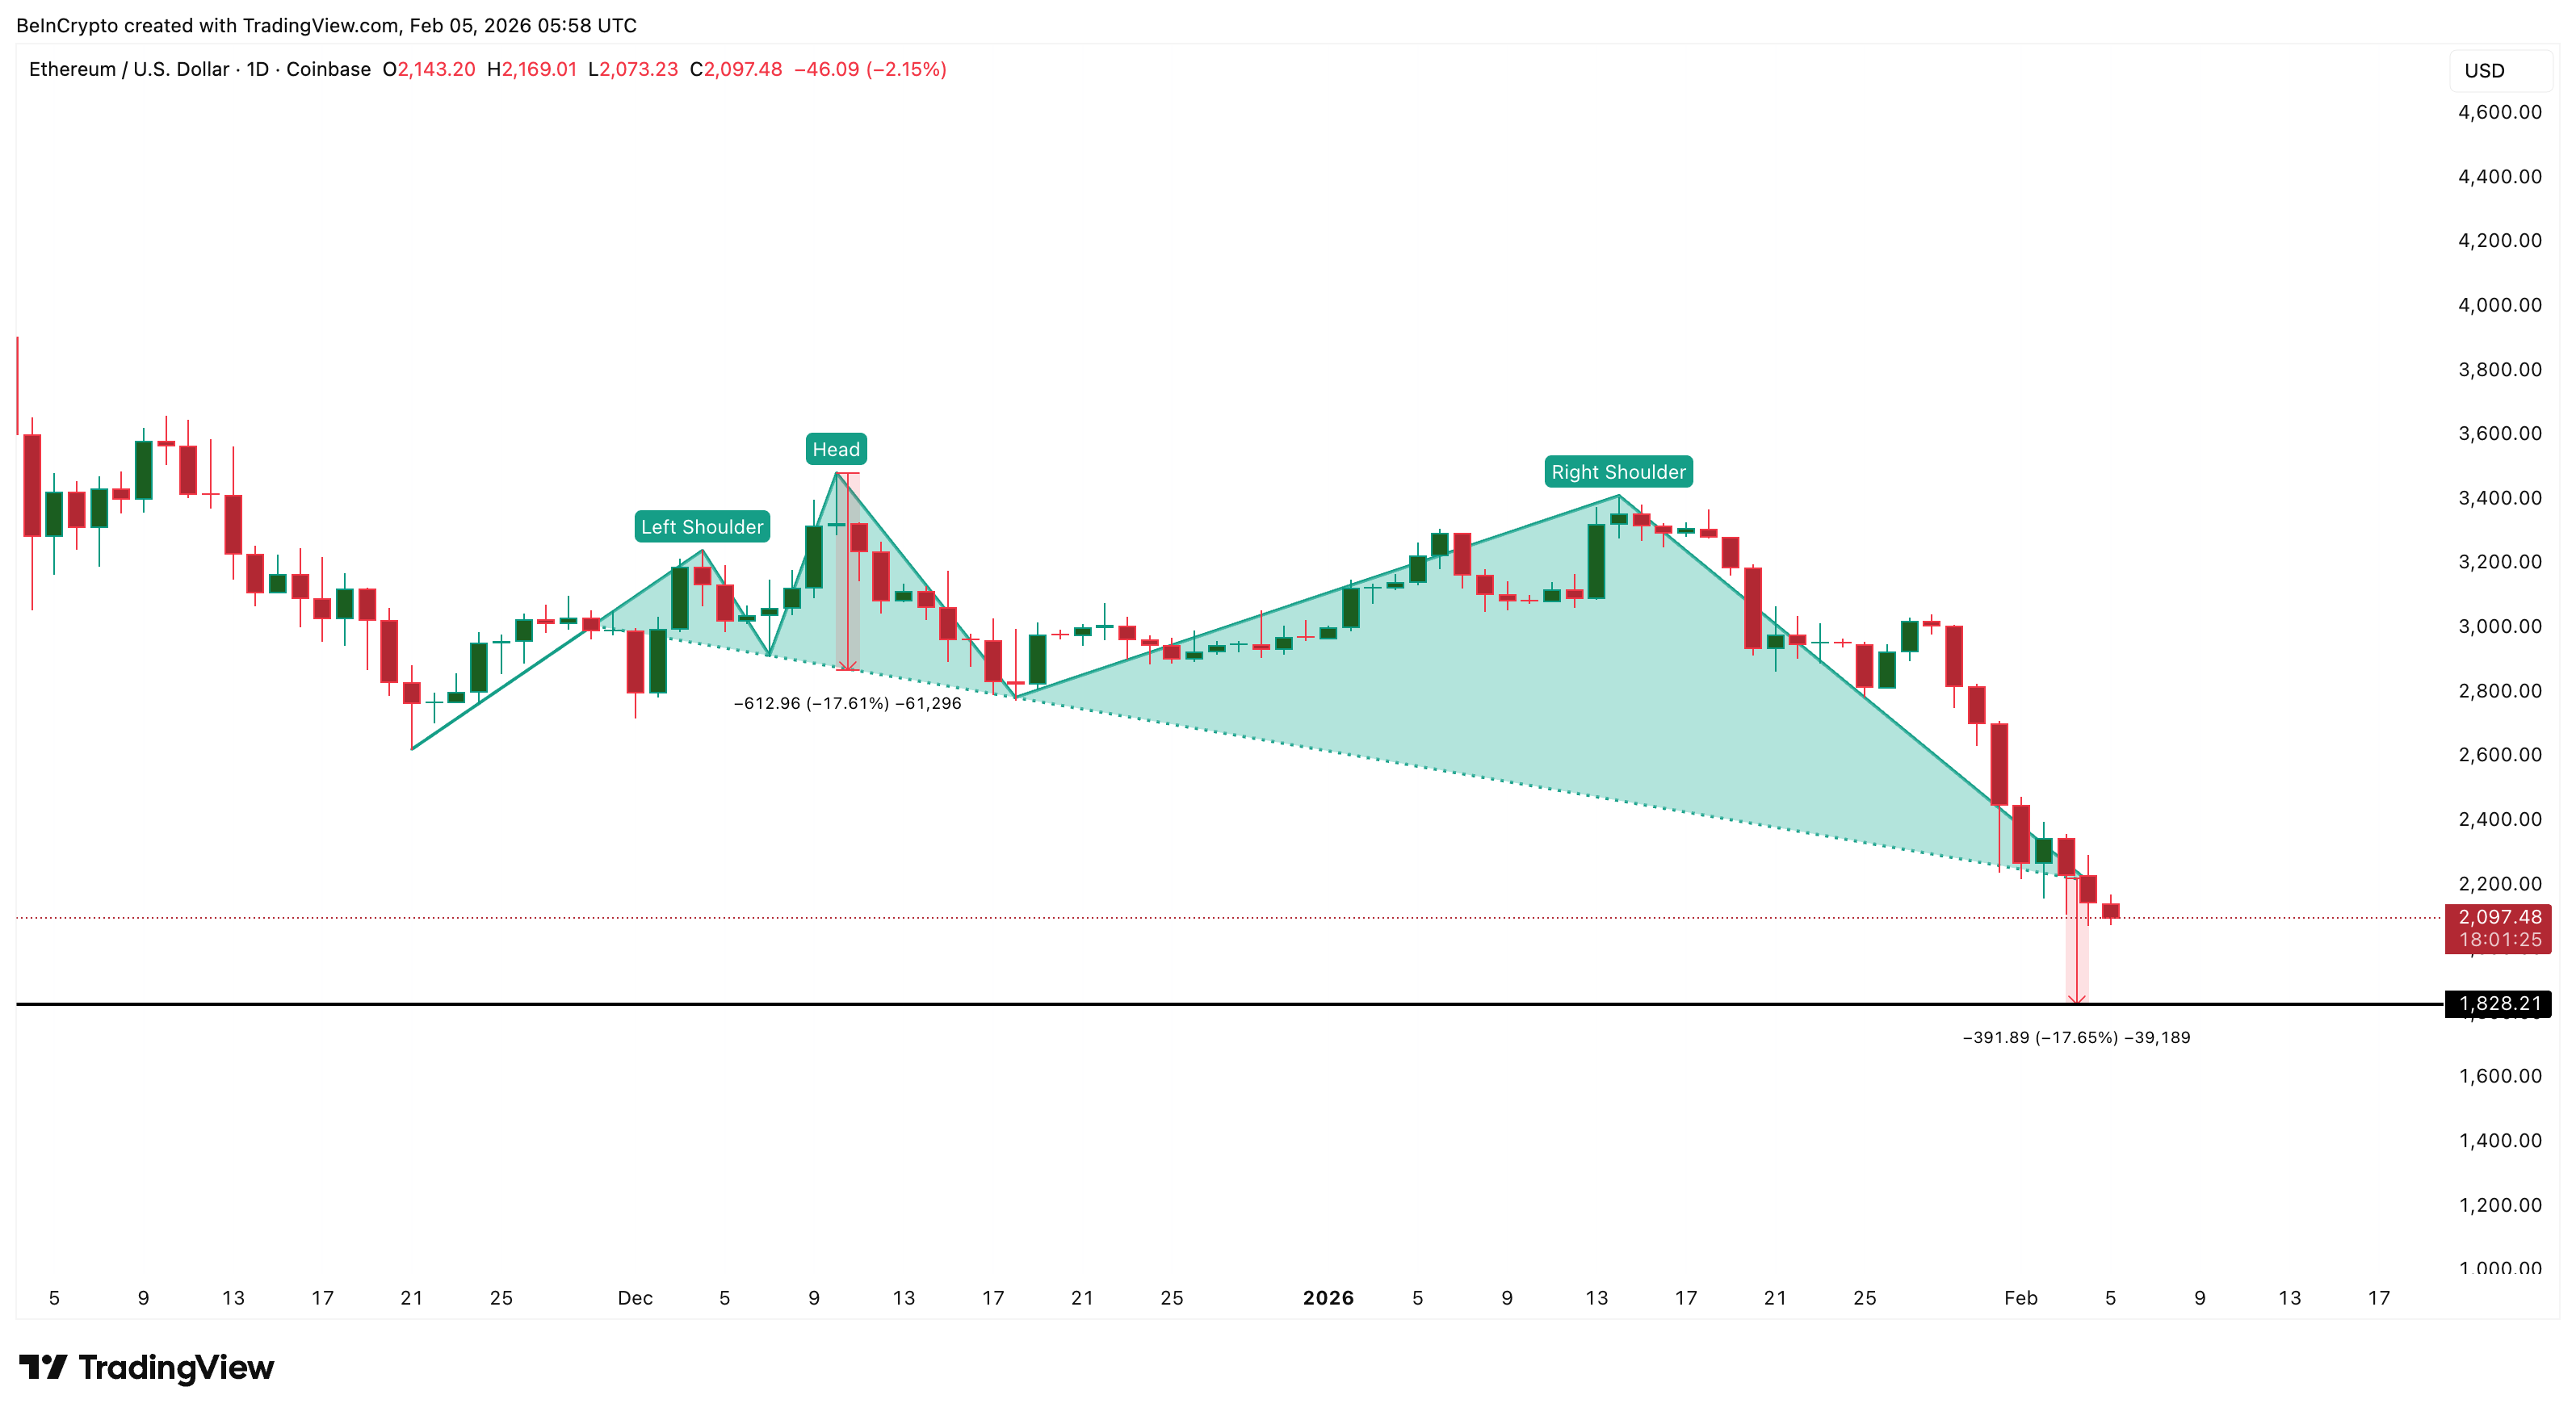
Ethereum’s latest decline accelerated after a clear technical breakdown on February 3.
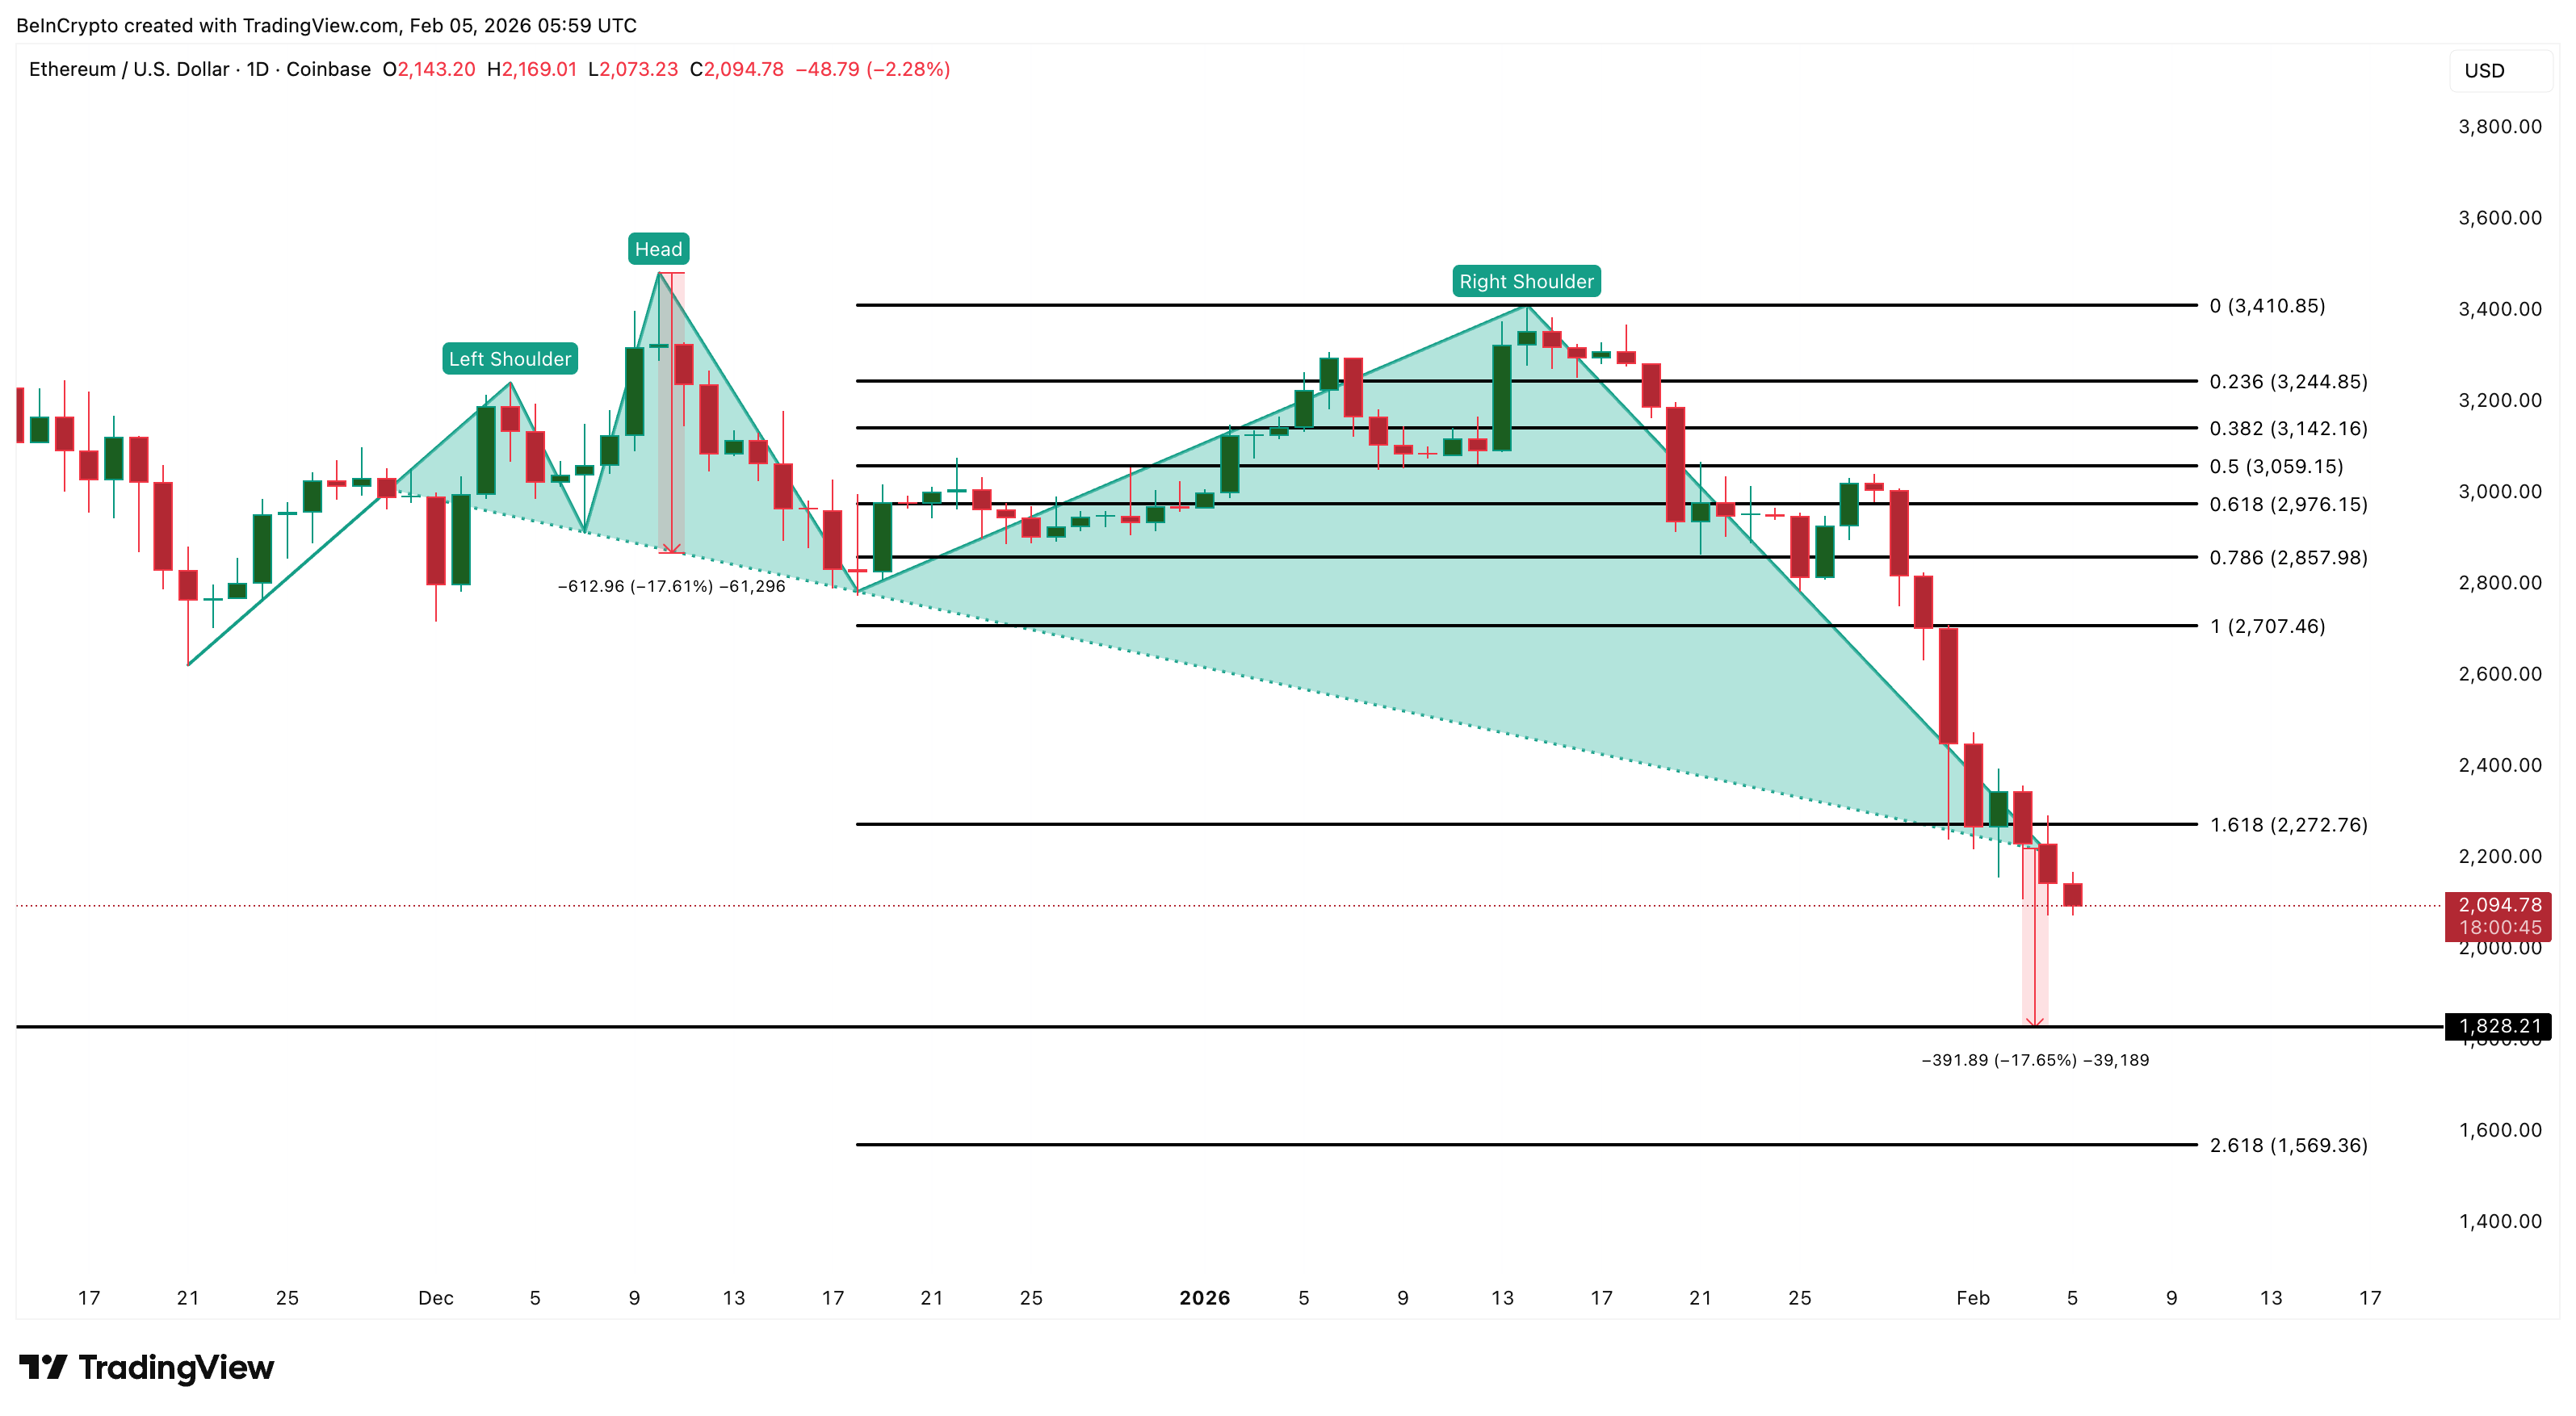
On the daily chart, ETH completed a head-and-shoulders pattern that had been forming since mid-November. When the ETH price failed to hold above the neckline and broke lower on February 3, the bearish pattern was confirmed.
 Bearish Price Structure: TradingView
Want more token insights like this? Sign up for Editor Harsh Notariya’s Daily Crypto Newsletter here.
Head-and-shoulders formations typically signal trend reversals. The projected downside target is calculated by measuring the height of the pattern and applying it below the neckline. In Ethereum’s case, this points toward the $1,820 zone.
At around the same time, on-chain data showed that Vitalik Buterin had begun selling ETH.
Over the past three days, Vitalik sold around 2,961 ETH worth roughly $6.6 million at an average price near $2,228. The selling began just as Ethereum was losing technical support and has continued through the breakdown.
This timing is important. When a major ecosystem figure reduces exposure during a chart breakdown, it often weakens market confidence. Instead of stabilizing sentiment, Vitalik’s sales reinforced the bearish signal coming from price action.
As a result, the technical breakdown and high-profile selling combined to mark February 3 as a major turning point for Ethereum.
Whales and Hodlers Start Selling After February 3 Signal
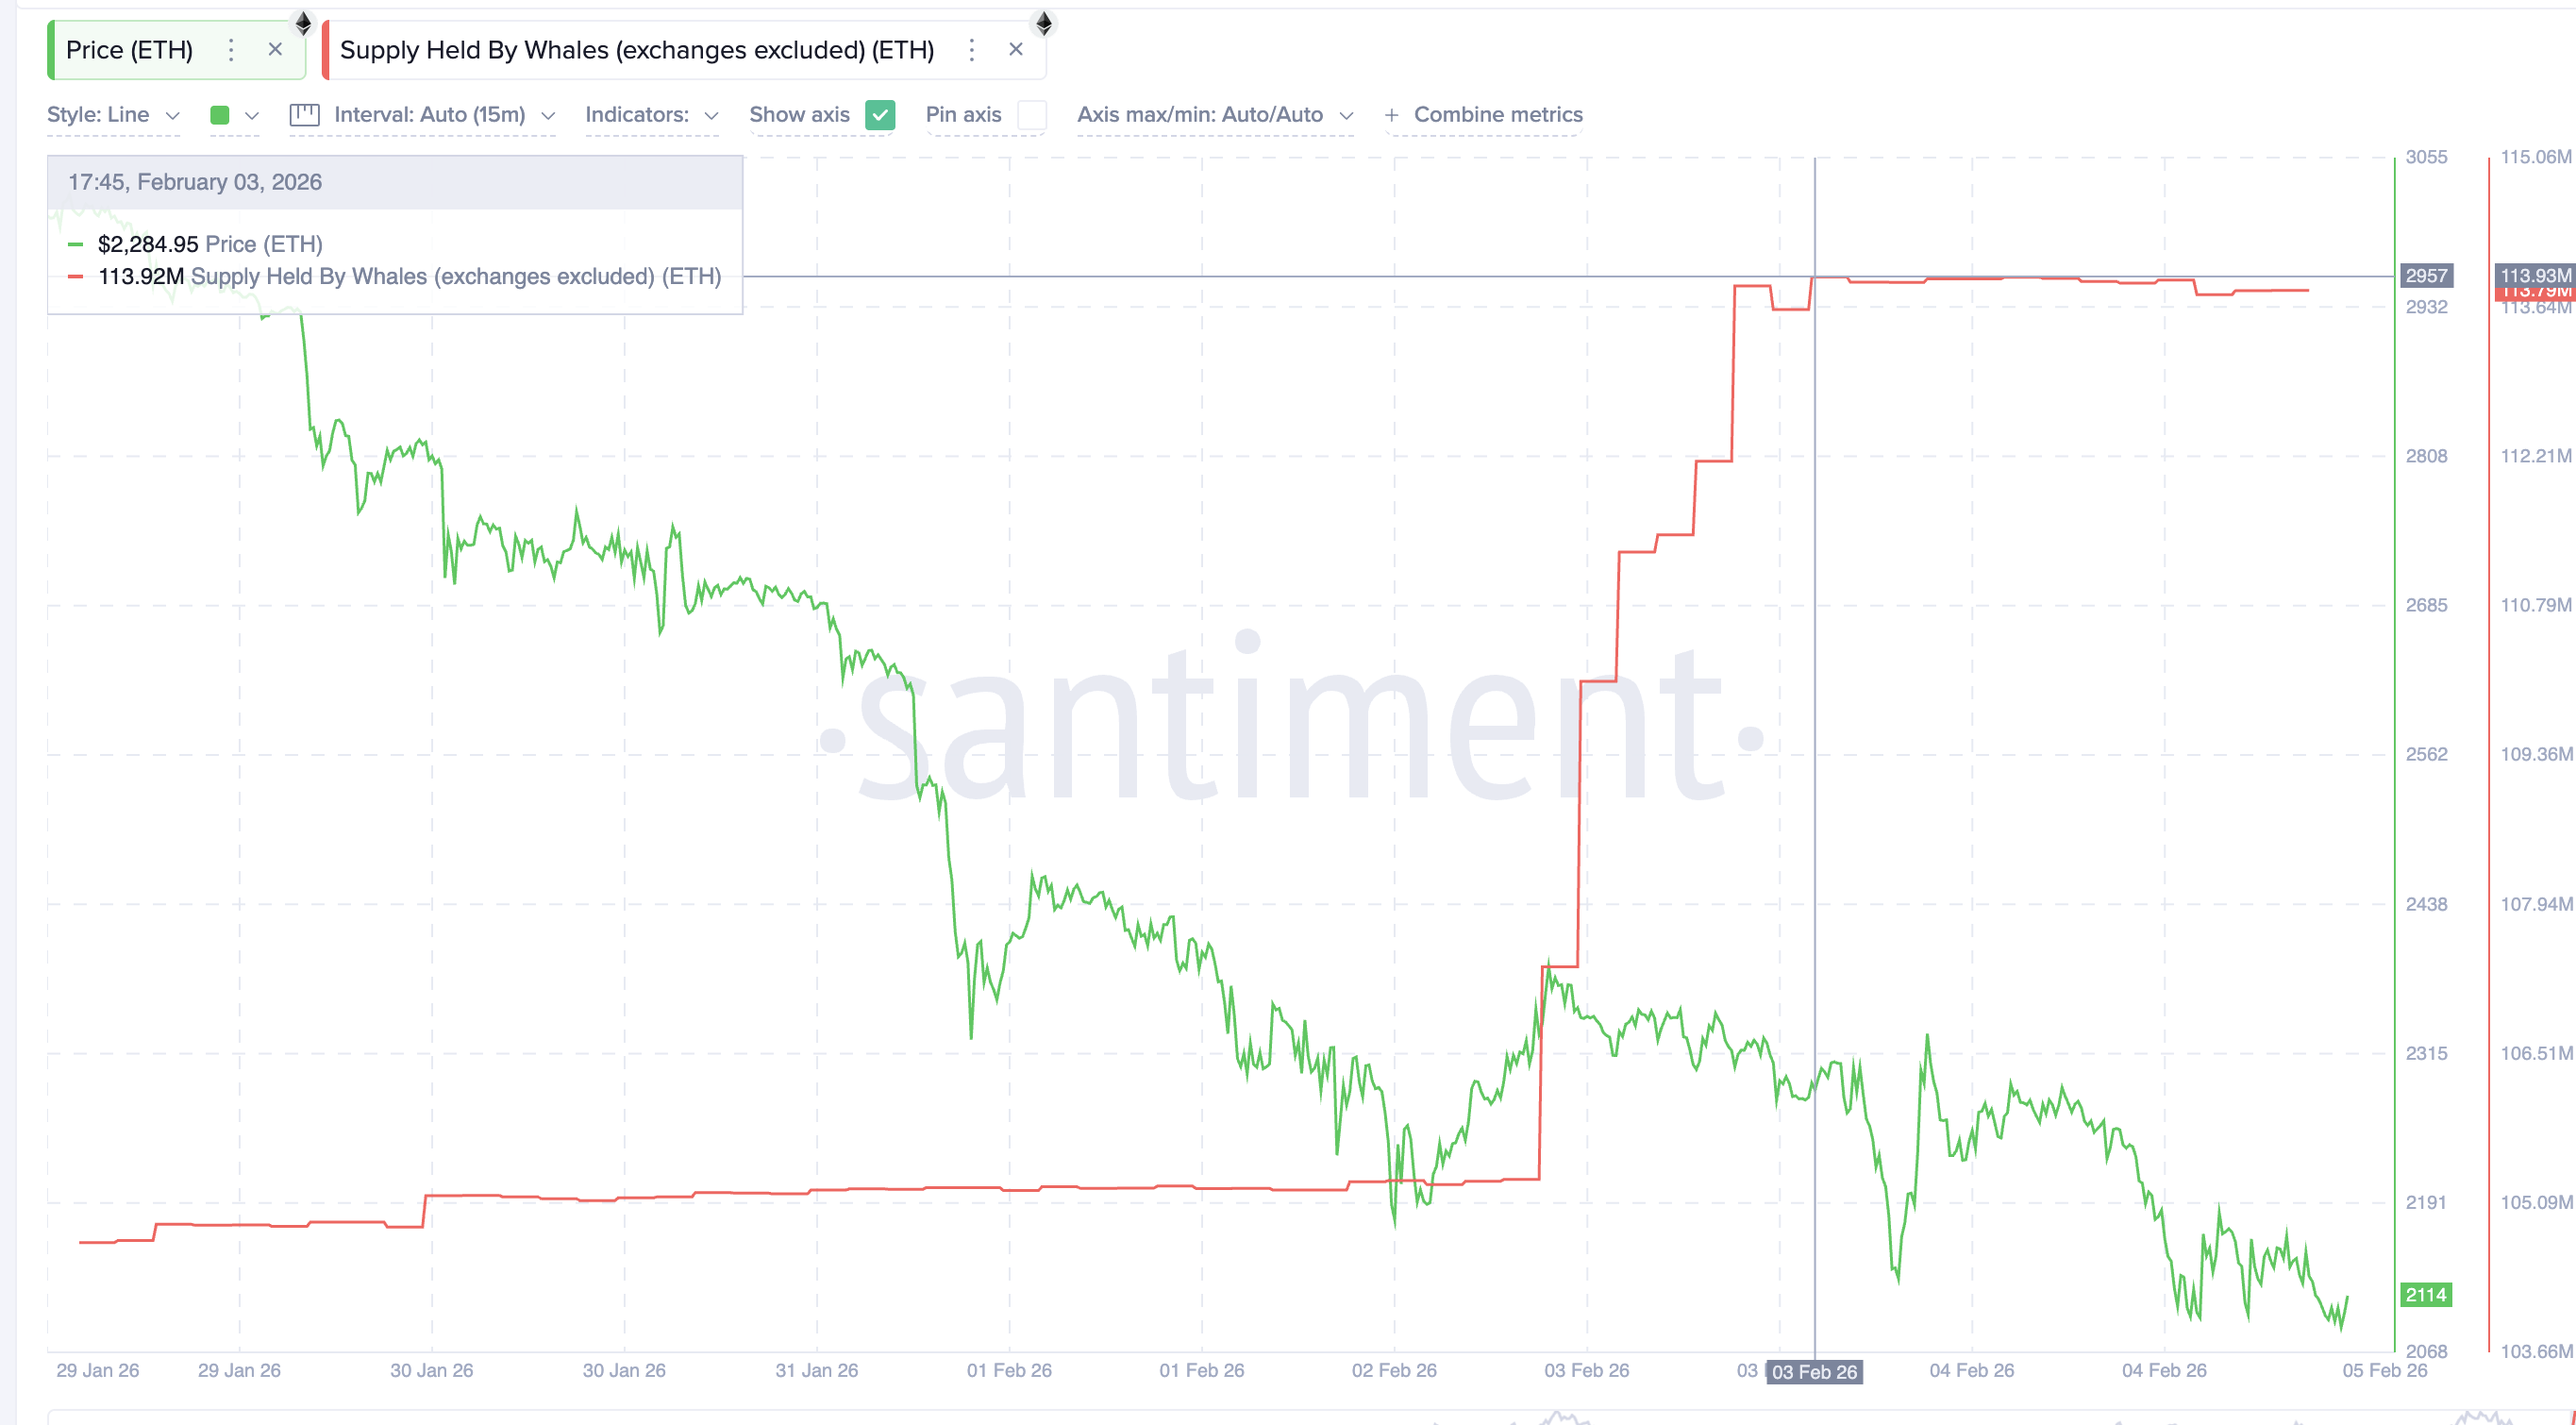
After the breakdown and Vitalik’s sales, large and long-term holders also began changing their behavior.
Data shows that Ethereum whales, excluding exchange wallets, increased their holdings significantly between February 2 and February 3 as they attempted to buy the dip. However, once the price failed to recover, that accumulation quickly reversed.
On February 3, whale holdings stood near 13.93 million ETH. They have since fallen to around 13.79 million ETH, a reduction of roughly 140,000 ETH, worth over $290 million. This decline suggests cautious distribution rather than confident long-term buying.
 ETH Whales Start Selling: Santiment
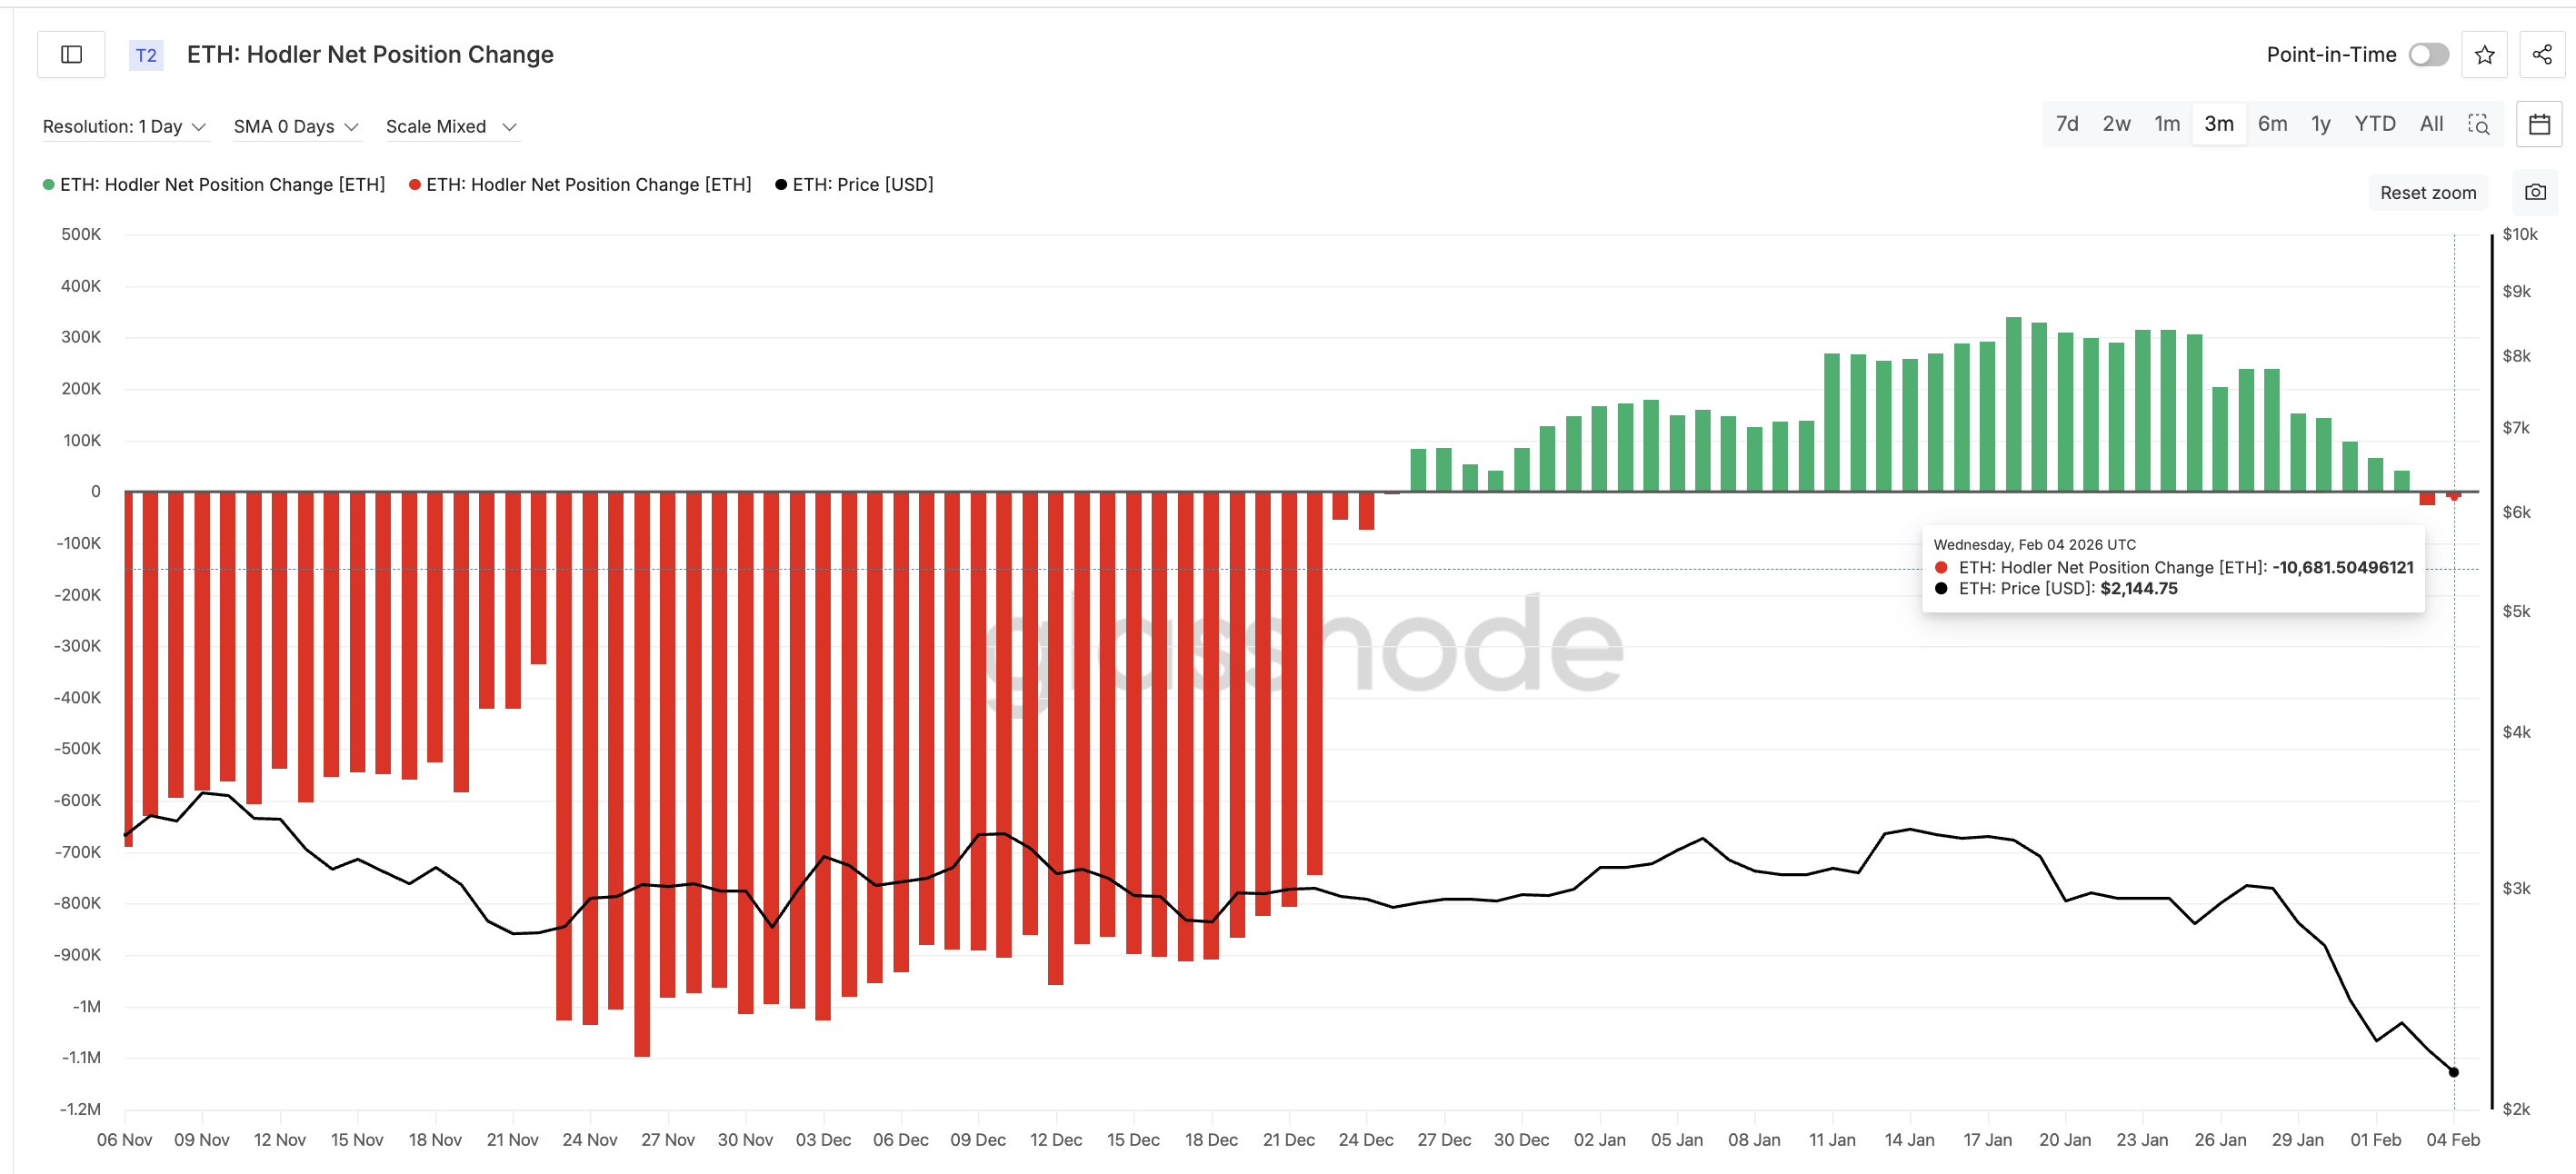
At the same time, long-term holders also started selling.
Hodler Net Position Change tracks the net movement of ETH held by wallets that have not moved coins for more than 155 days. These wallets are considered long-term investors. Positive readings indicate accumulation, while negative values show net selling.
Since late December, this metric had remained positive, meaning long-term holders were steadily adding to their positions. However, on February 3 and 4, it turned negative for the first time in weeks.
The latest reading shows net selling of around 10,681 ETH. This shift indicates that even patient investors have begun trimming exposure following the breakdown.
 Hodlers Back To Dumping ETH: Glassnode
Together, these signals show a clear sequence. Vitalik reduced holdings, the chart structure failed, whales began selling, and long-term holders followed, all around the same time. This coordinated shift suggests weakening conviction across multiple investor groups.
When both large holders and hodlers step back at the same time, downside risks usually increase.
On-Chain Cost Clusters Point to $1,800 as Key Ethereum Price Zone
On-chain supply data now helps explain where Ethereum may find its next major support.
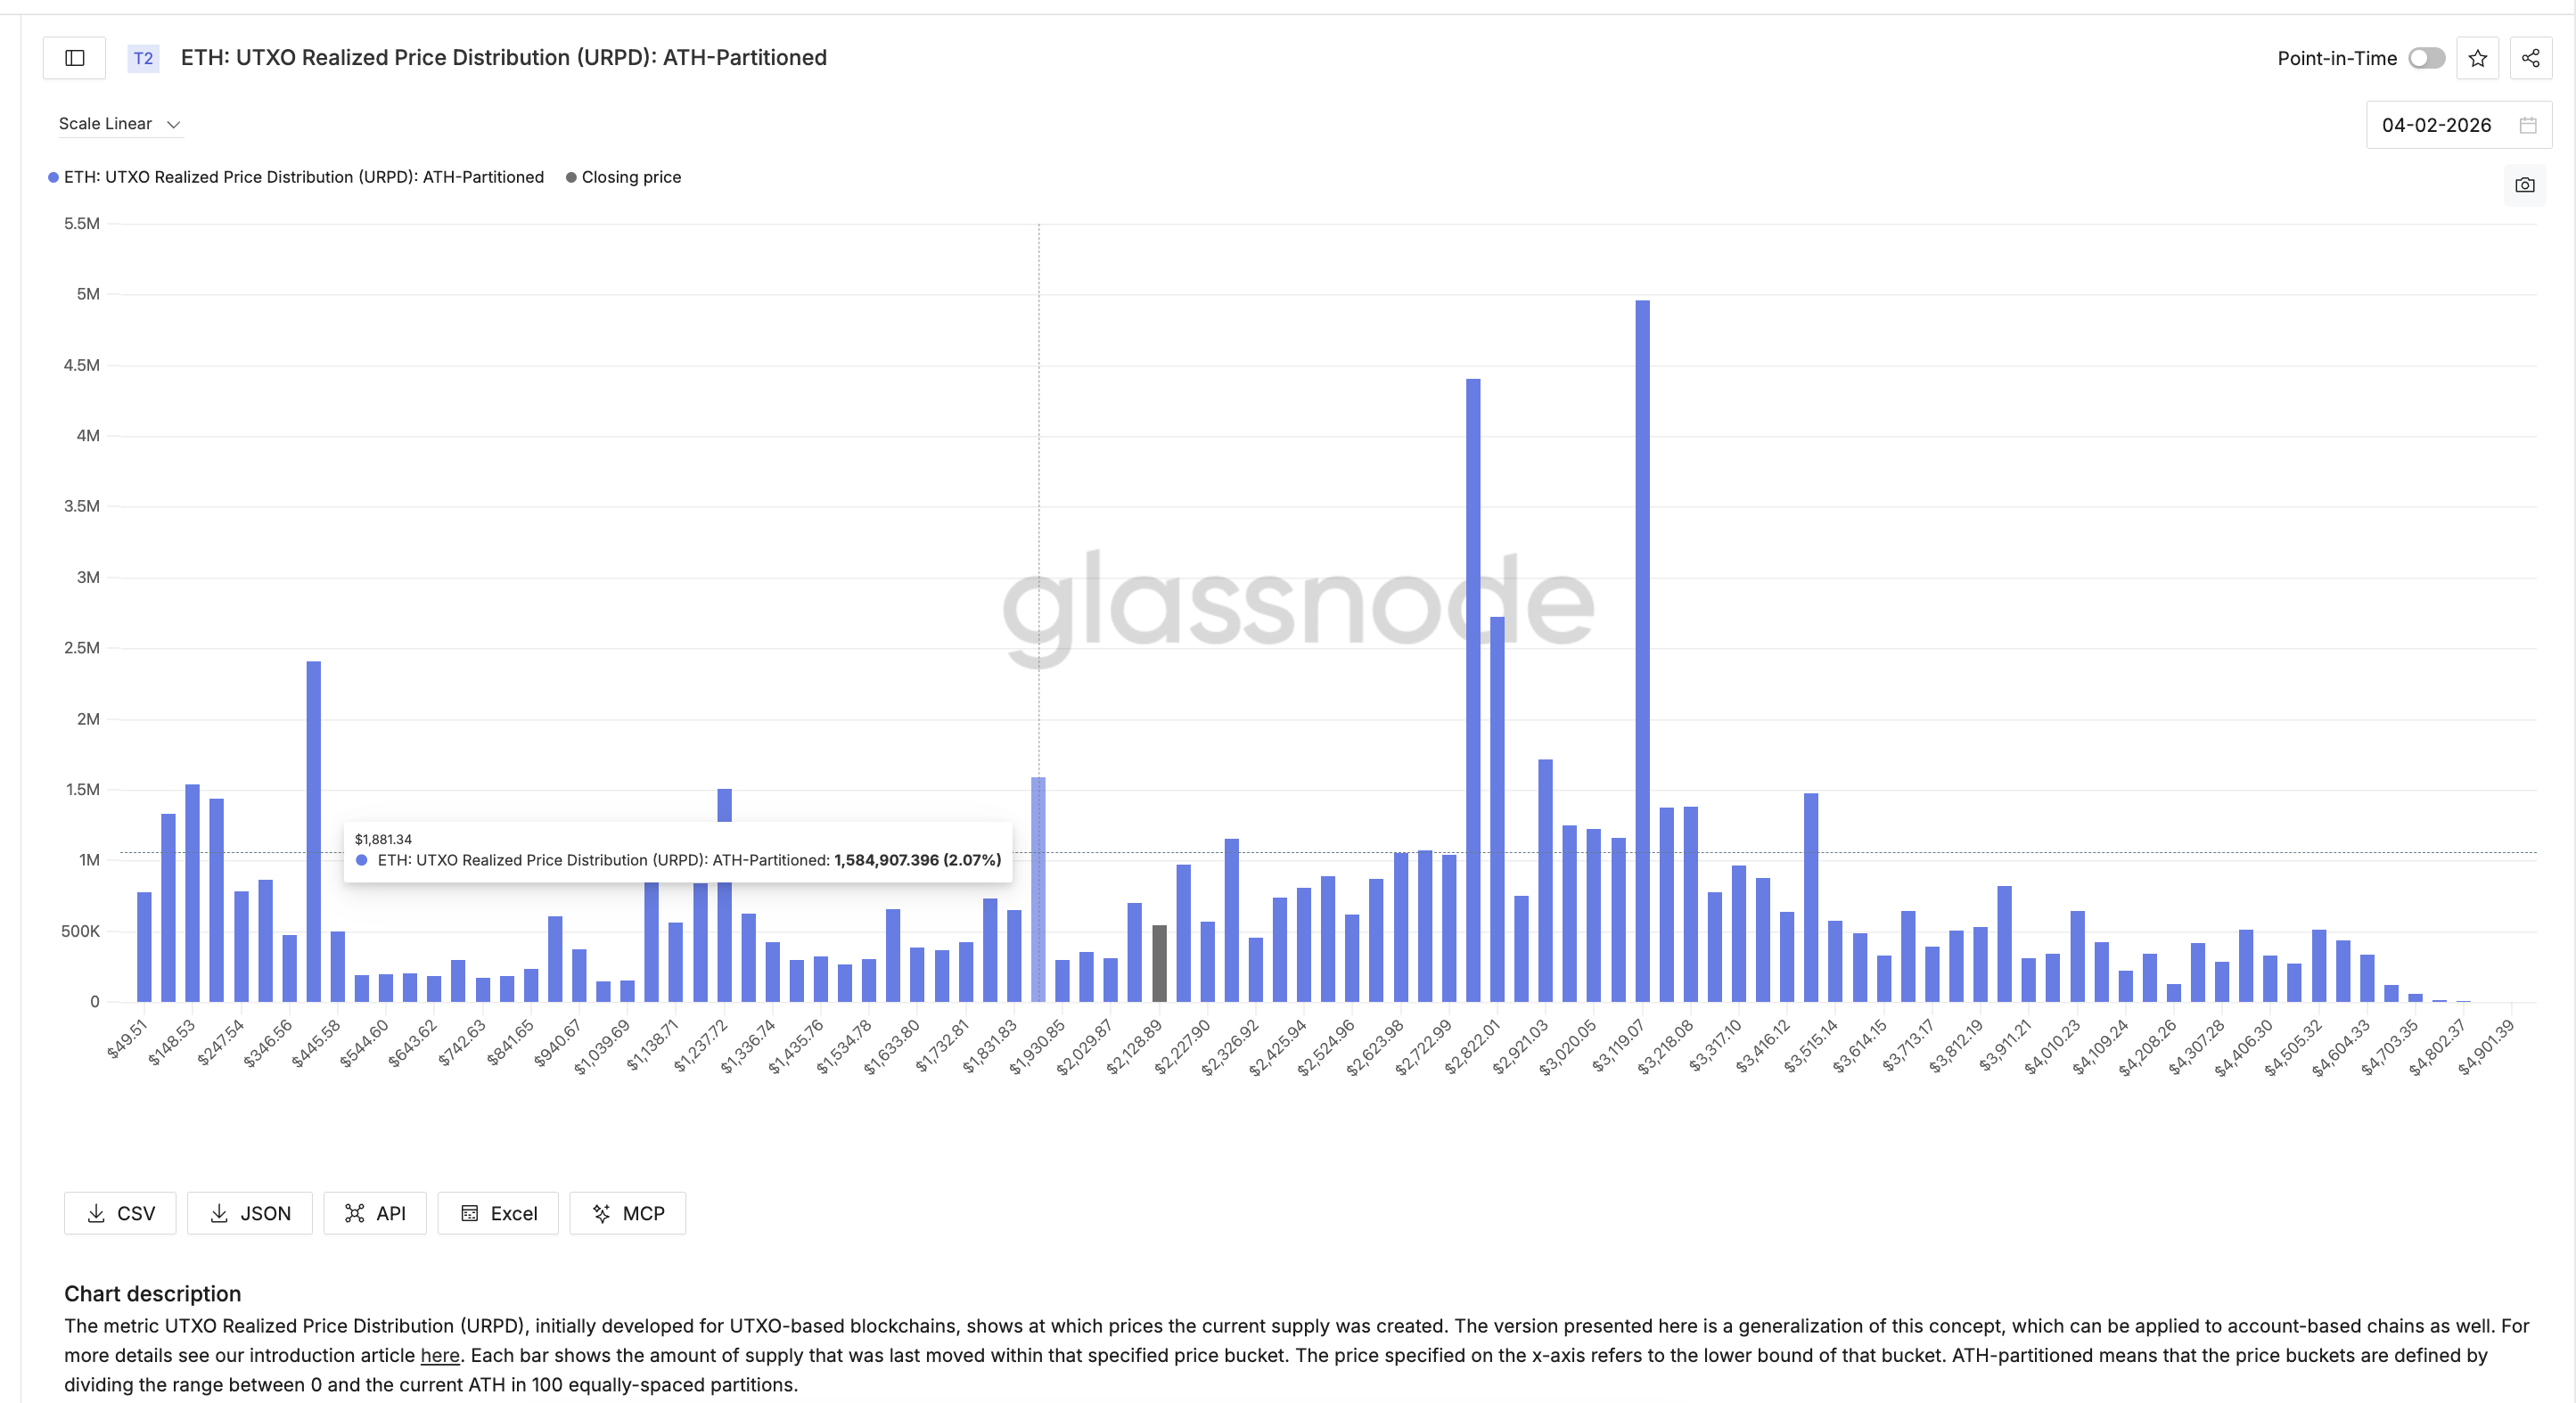
The UTXO Realized Price Distribution (URPD) shows where the current supply last moved on-chain. While the metric was originally designed for UTXO-based blockchains like Bitcoin, Glassnode has since generalized it for account-based networks such as Ethereum.
Each bar represents how much ETH last changed hands within a specific price range. Large clusters often act as support or resistance because many holders have their cost basis in those zones.
Current data shows one of the strongest supply clusters near $1,880. Around 2% of circulating ETH last moved in this range, making it a key psychological and structural support area.
 Cost Basis Clusters Generalized For ETH: Glassnode
This aligns closely with the technical projection from the head-and-shoulders pattern, which points toward $1,820.
Ethereum has already lost the $2,270 support level. With price now trading near $2,090, the next major test sits between $1,880 (per the on-chain cluster)and $1,820.
If this zone fails, the next ETH downside target appears near $1,560 based on downside Fibonacci extensions.
 Ethereum Price Analysis: TradingView
On the upside, the bearish setup would weaken only if Ethereum reclaims $2,270 and then $2,700, and holds above them on the daily timeframe. Without that recovery, all Ethereum price bounces are likely to face selling pressure.
0
0


 Manage all your crypto, NFT and DeFi from one place
Securely connect the portfolio you’re using to start.

0
0

0
0

0
0
