Solana Declines, But Tightening Bollinger Bands Hint at Big Upside Move

0
0
Solana and the rest of the market have been declining since Sunday, threatening to retest previous lows and even slip lower.
During the previous intraday session, the asset lost almost 3% as it retraced to $82. The 1-day chart shows that it was first red after three days of green. However, current price action suggests that it may be the start of something worse.
Solana retraced on Monday, dropping to a low of $77. Although it is seeing a slight rebound, it remains down by over 5%. It is poised to end the day with significant losses, kicking off the new week with notable losses.
In addition to the price decline, the bulls saw significant losses in the derivatives market. Traders lost almost $600 million over the last 24 hours, with the longs accounting for more than 80% of the total liquidations. On SOL, they lost over $25 million, with most of the losses occurring during the first half of the day.
In hindsight, the asset started previous weeks with losses on the first day, and they ended the same way. There is a high chance the current week will follow the trend.
In response to the two-day decline, several indicators have since flipped bearish. For example, the moving average convergence divergence shows the first signs of flipping negative. A closer look shows that its histogram printed shorter bars, indicating that the 12 EMA has halted its uptrend. A decline will happen if the price downtrend continues, signaling an impending bearish crossover.
The relative strength index is also declining. While its downturn is in response to current price action, a closer look reveals a new pattern. The metric was below 30 a few weeks ago, but recovered and surged to 38. However, it soon retraced and rebounded again. This time, it stalled at the same level.
Bollinger Bands Signal Tightens on Solana
RSI is currently at 32. Recall it retraced after it hit 38 the first time. Interestingly, it rebounded at 32. If the trend persists, Solana may see further pullback in the coming days.
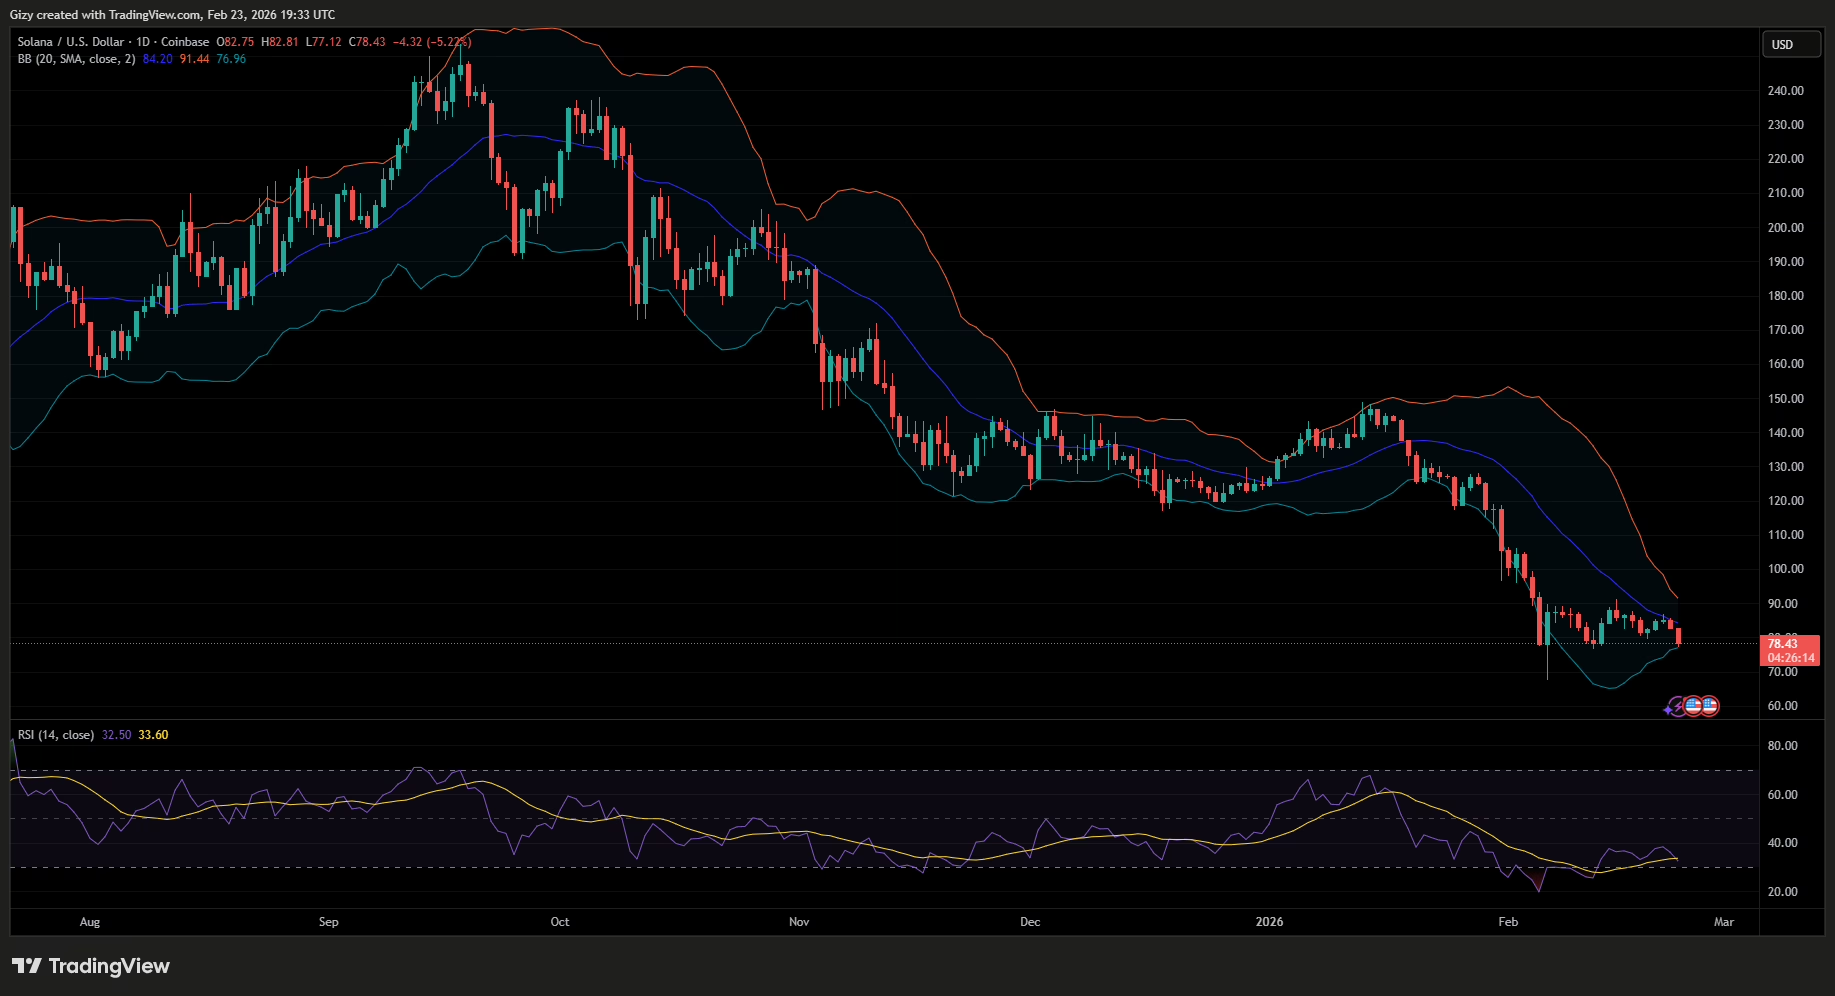
Aside from the relative strength index, the Bollinger bands also share the bullish sentiment. A closer look at the indicator shows that the altcoin bounced off its lower line a few hours ago. Per its principle, rebound is almost certain following such a retest.
Nonetheless, there’s a new development away from testing the lower band; the BB is tightening as well. Traditionally, this only precedes a sudden breakout. If the trend holds, the asset will experience increased volatility in the coming days.
In addition to indicators, prior price movements support predictions of further increases. It is worth noting that Solana rebounded from a level it had held for the past 14 days. Since the Feb 6 plummet, the bulls have defended the $77 support.
When it retraced to this level, it rebounded and surged above $85. The recent slight rebound suggests that bulls are currently defending the mark and driving a surge back to it.
The bollinger bands place the target at $90. This suggests Solana is gearing up for a 15% surge in the coming days.
Following the significant decline on Monday, the coin must surge on Tuesday and print another green candle above $80 to confirm the short-term uptrend.
The post Solana Declines, But Tightening Bollinger Bands Hint at Big Upside Move appeared first on CoinTab News.
0
0

 Manage all your crypto, NFT and DeFi from one place
Securely connect the portfolio you’re using to start.


0
0

