
LAB Price Prediction: Can a 99% Crash Fuel a Breakout?

0
0

$LAB is trading at $0.1312 after slipping 12.36% in the last 24 hours, and this LAB price prediction looks at why the coin, now more than 99% below its all-time high, could be setting up for a bounce.
A pattern is forming on the 1-hour chart right at the bottom, and history shows this pattern often triggers a sharp move once it breaks out. Here is what the levels are saying.
$LAB Market Snapshot Today (21-07-2026)
Metric | Value |
Current Price | $0.1312 |
24h Change | -12.36% ($0.0185) |
Market Cap | $41.02M |
Futures Volume (24h) | $261.94M |
Spot Volume (24h) | $8.71M |
Open Interest | $56.03M |
Circulating Supply | 312.09M LAB |
Total Supply | 990.00M LAB |
Max Supply | 1.00B LAB |
Source: CoinGlass, as of July 21, 2026
Live LAB market data and $LAB coin overview can be tracked in real time for anyone following this closely.
Latest $LAB News
As per Lab On X, $LAB is opening up a new round of applications for its beta tester program. 
The last cohort of testers got early access to unreleased products, tried them out before public launch, gave feedback to the team, and earned rewards for their contributions.
The project has confirmed a new round is coming soon, which keeps the community engaged even while the price is under pressure.
This kind of ongoing product activity is worth watching alongside the $LAB price prediction, since ecosystem updates often play a role when a token is trying to recover from deep lows.
$LAB Liquidation Data
LAB liquidation data shows longs are still taking the bigger hit on higher timeframes, which lines up with the recent sell-off.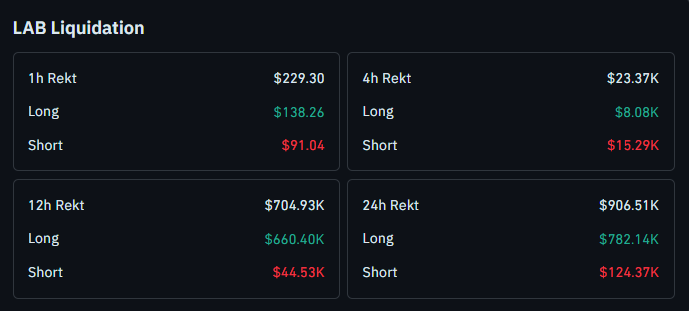
Over the last 24 hours, long liquidations of $782.14K far outpace short liquidations of $124.37K, showing that traders betting on an upside move got caught out during this drop.
This latest wipeout adds another chapter to the story explored in why LAB is crashing due to a liquidity pull.
Binance leads futures volume for $LAB at $89.25M, followed by OKX at $72.83M and LBank at $37.12M.
$LAB Technical Outlook
On the 1-hour timeframe, $LAB is forming a falling wedge, a pattern that typically shows up near the end of a downtrend and often leads to a fast recovery once price breaks out and holds above the wedge resistance.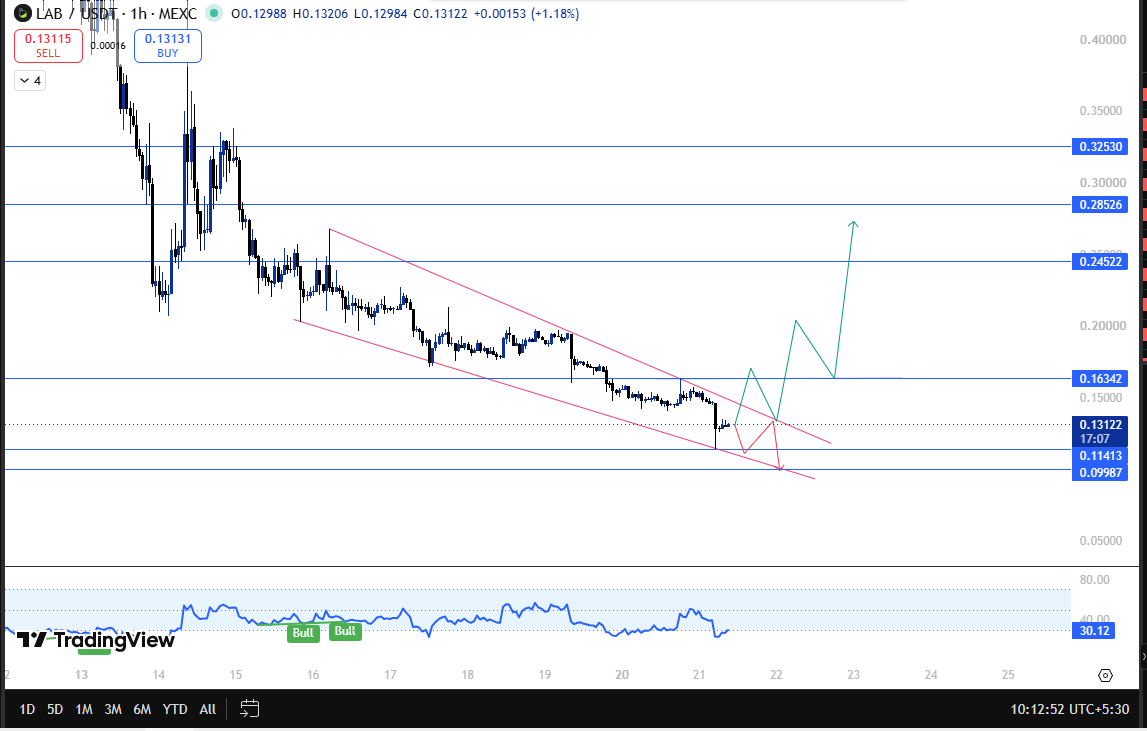
This ties directly into the broader LAB recovery analysis covered earlier this week.
The structure shift level to watch is $0.16342. If $LAB closes above this level and sustains the move, it opens the door to the next resistance zones at $0.24522, followed by $0.28526 and $0.32530, levels that were first mapped out in the piece on LAB target levels after the crash.
On the other hand, if $LAB attempts a breakout but fails to close above $0.16342, the price could slip back toward support at $0.11413.
A break below that level would put the next support at $0.09987 in focus, a scenario laid out in more detail in the LAB crash and recovery scenarios breakdown.
These levels are derived using the Fibonacci tool on the 1-hour timeframe.
Now here's something interesting. RSI is showing a bullish divergence right now, and it's sitting in the oversold zone of 30.12. In plain words, this means sellers are getting tired.
The price keeps making new lows, but the momentum behind those lows is actually getting weaker, not stronger. That's usually an early warning sign that a bounce could be coming.
There's also the $0.10 mark to keep in mind. This isn't just a random number; it's a psychological level that traders tend to defend.
If $LAB manages to hold above $0.10, it adds more confidence to the recovery story, especially after the sharp 30% drop $LAB saw within 24 hours recently.
$LAB Support and Resistance Levels
Type | Level |
Resistance 3 | $0.32530 |
Resistance 2 | $0.28526 |
Resistance 1 | $0.24522 |
Structure Shift Level | $0.16342 |
Current Price | $0.1312 |
Support 1 | $0.11413 |
Support 2 | $0.09987 |
Invalidation Level
If LAB can't close above $0.16342 and instead slips below $0.09987, the recovery idea no longer holds up. That would mean sellers are still in control, and the downtrend could continue further.
Expert View
Traders watching LAB closely point out that a falling wedge showing up this late in a downtrend, especially with the coin already down over 99% from its all-time high, often ends in a strong bounce once the breakout actually holds.
The RSI divergence combined with the oversold reading, plus the added support near the $0.10 level, all point in the same direction.
But there's a catch. None of this confirms anything on its own. The real trigger is a proper close above $0.16342 that actually sticks. Until that happens, this is still just a possible setup, not a confirmed reversal, so it makes sense to wait for that confirmation before treating it as anything more.
Disclaimer: This LAB price prediction is for informational and educational purposes only and should not be considered financial or investment advice. Cryptocurrency markets are highly volatile, and price forecasts are not guaranteed. Always conduct your own research (DYOR), evaluate your risk tolerance, and consult a qualified financial advisor before making any investment decisions.
0
0


 すべての暗号通貨、NFT、DeFiを1か所から管理
開始に使用しているポートフォリオを安全に接続します。

0
0


