
LAB Price Prediction: Liquidity Exit Sparks Crash, Next Target Levels?

0
0

LAB is buzzing across trading communities right now, but not for a good reason, with panic spreading fast after a liquidity exit report shook confidence overnight.
The project pitches itself as an all-in-one trading ecosystem, built to give traders faster execution, lower fees, and a community-driven incentive layer powered by the $LAB token, according to the project's own materials.
This LAB Price Prediction looks at what this liquidity shock could mean for LAB going forward. Stick around till the end to see what the charts are hinting at next.
LAB Price Prediction: Market Overview
Metric | Value |
Current Price | $0.14912 |
24h Change | -23% |
24h Range | $0.1446 - $0.1782 |
7 Day Change | -64.3% |
All Time High | $27.30 (-99.40%) |
All Time Low | $0.07423 |
Market Cap | $48.061M |
Fully Diluted Valuation | $149.006M |
24h Trading Volume | $28.556M |
Circulating Supply | 322.543M $LAB |
Total / Max Supply | 1B $LAB |
Source: Data from CoinGecko as of 20/07/2026. Figures may vary slightly across other tracking websites.
Why Is LAB Crypto Crashing Today
The biggest trigger behind this $LAB crypto crash is not broader market weakness. It is project-specific. A widely shared post pointed out that $LAB developers withdrew a massive portion of the token's liquidity. 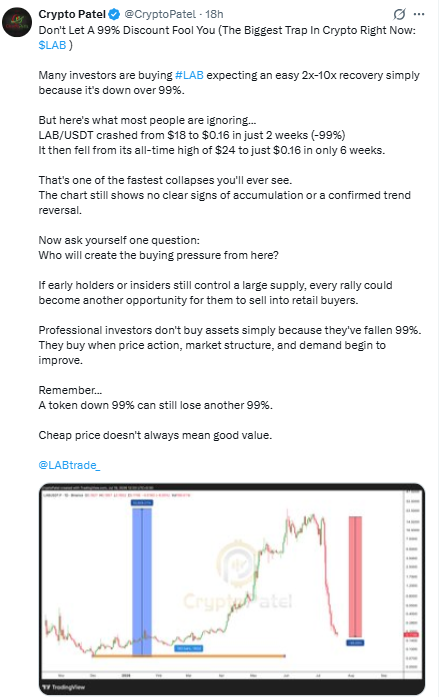
Source: Data From X
The app data behind that claim shows liquidity down 81.57% from its highest recorded level on chain. That is not a small dip. It is the kind of number that makes traders nervous fast.
The logic is simple. The token still trades. The chart still moves. But when liquidity dries up this much, it gets harder for holders to exit without slippage eating into their profits. Screen numbers can look fine while real exit conditions quietly get worse.
This kind of liquidity concern tends to hit sentiment harder than a normal red candle. It explains why sellers moved in fast once the news spread and why the bounce attempt on the chart failed to hold.
LAB price forecast: LAB Liquidation and Volume Data
Longs have taken the bulk of the damage in every single window, which shows traders kept expecting a bounce that never came.
This lines up with the failed sideways move on the chart, where buyers stepped in expecting support and got liquidated instead.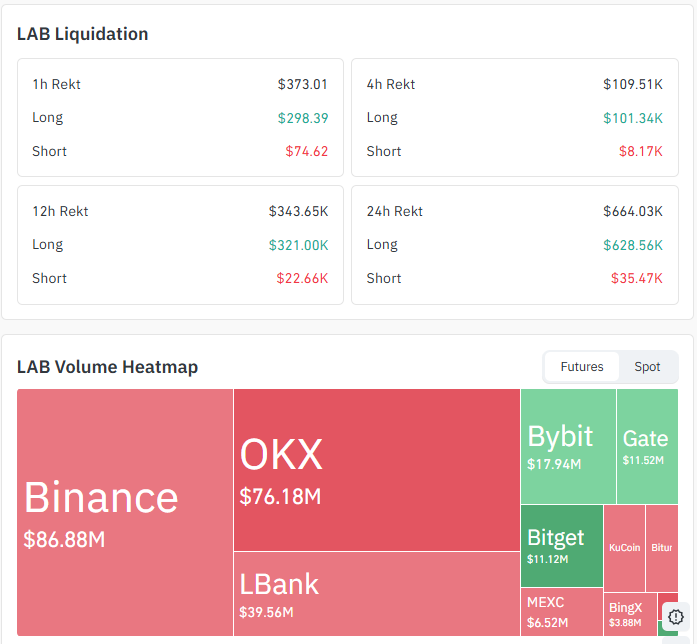
Source: Data From CoinGlass
Futures Volume by Exchange (Coinglass): Binance leads with $86.88M, followed by OKX at $76.18M, LBank at $39.56M, Bybit at $17.94M, Gate at $11.52M, and Bitget at $11.12M.
This futures volume is separate from the $28.556M spot trading volume reported by CoinGecko in the Market Overview table above. The two should not be combined, since they measure different markets.
Timeframe | Total Liquidated | Long | Short |
1h | $373.01 | $298.39 | $74.62 |
4h | $109.51K | $101.34K | $8.17K |
12h | $343.65K | $321.00K | $22.66K |
24h | $664.03K | $628.56K | $35.47K |
LAB price prediction 2026: LAB price today: LAB Chart Analysis
LAB has been stuck in a falling channel for the past several days, with lower highs and lower lows forming a clean downward path. A few days back, the price stopped falling and moved sideways inside a tight range.
That pause got some traders thinking a shift was underway and that price could turn upward.
That read did not play out. Price broke down through the consolidation area and resumed its fall, dropping straight through the support zone of $0.13911.EMA 9 is sitting at 0.16129, and EMA 20 is at 0.19149. 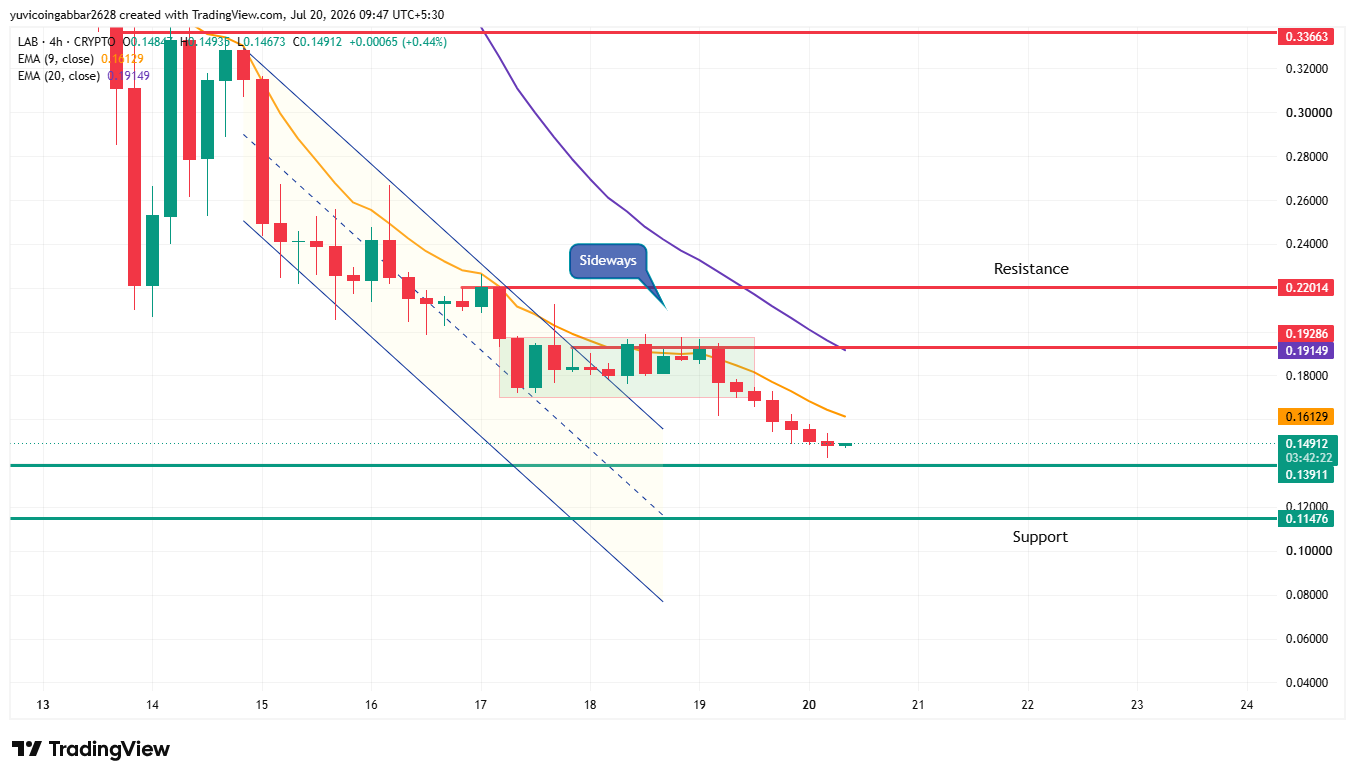
Price trading below both lines confirms the short-term trend is still bearish, and the gap between the two EMAs shows the down move still has momentum behind it.
Level Type | Price |
Resistance | $0.22014 |
Resistance (closer) | $0.19286 |
EMA 20 | $0.19149 |
EMA 9 | $0.16129 |
Support | $0.13911 |
Support (deeper) | $0.11476 |
Verdict: As long as $LAB stays below the EMA 9 and EMA 20, the path of least resistance remains lower, with $0.14912 the first LAB support resistance level to watch.
Two Reader Takeaways
For existing holders, the level to watch is $0.13911. A clean break below that opens the door to $0.11476.
For anyone considering buying the dip, wait for a $LAB price recovery signal like price reclaiming the EMA 9 at $0.16129 first. Buying into a falling price without that confirmation adds unnecessary risk.
LAB Market Outlook: Expert View
According to CoinGabbar analysts, $LAB's exchange volume remains concentrated on Binance and OKX, which keeps the sell pressure visible rather than hidden.
A bullish trigger for $LAB token recovery would need the price to close back above the EMA 9 and hold the sideways zone as support.
A bearish trigger is already active, with the channel breakdown confirming sellers are still in control below $0.19149.
Disclaimer: This is a technical read based on current chart structure and should not be treated as financial advice. Crypto markets are highly volatile, and a token that has already moved this sharply can continue to move sharply in either direction with little warning. Always do your own research before making any investment decision.
0
0

 Manage all your crypto, NFT and DeFi from one place
Securely connect the portfolio you’re using to start.

0
0

0
0

0
0

0
0