
Hyperliquid Price Prediction: This Chart Could Surprise Everyone

0
0

Hyperliquid price prediction is in focus again after $HYPE did something its recent chart had not shown in days: buyers defended support.
Sellers had been firmly in control for a while, but renewed buying pressure showed up right where it mattered most, and the subsequent price action is now shaping the next move on the chart.
Quick Take: $HYPE is trading near $59.212.
And this is a short-term read based on the 1-hour chart and should be rechecked if the price closes decisively beyond either $63.447 or $57.365.
Hyperliquid Price Right Now
| Metric | Value |
| Price | $59.212 |
| 24h Change | +0.45% (+$0.2653) |
| Market Cap | $14.95B |
| Futures Volume (24h) | $2.45B |
| Spot Volume (24h) | $134.91M |
| Open Interest | $2.52B |
| Circulating Supply | 252.76M HYPE |
| Total Supply | 953.11M HYPE |
| Max Supply | 953.11M HYPE |
Price taken from the live TradingView chart; volume, market cap, open interest, and supply figures from Hyperliquid data on CoinGlass, as of July 23, 2026, around 3:35 PM IST.
Methodology And Data Sources
This Hyperliquid price prediction uses the 1-hour HYPE/USDT chart on Binance via TradingView for price structure, with volume, open interest, and market cap figures from CoinGlass, liquidation flow from CoinGlass's $HYPE liquidation tracker, and ETF flow data from SoSoValue's HYPE spot ETF tracker.
All levels are treated as invalidated only on a confirmed candle close beyond the stated trigger, not an intraday wick.
This is a short-term, intraday read and is not intended as a long-term Hyperliquid price forecast.
Why Is A Multicoin Partner Talking About HYPE Today
Multicoin Capital's Tushar Jain drew attention after he unstaked a large HYPE position, and according to a post from Crypto Banter on X, he was quick to clarify it was not a sell decision.
His reasoning centered on privacy, arguing that on-chain tracking forces institutions into constant wallet rotations as more capital moves on-chain and that this kind of operational shuffling has nothing to do with a change in outlook on the token itself.
He also flagged being long ZAMA, a privacy-focused DeFi project, and ZEC, often described as a privacy-focused store of value, which suggests his broader thesis leans toward privacy infrastructure rather than away from $HYPE specifically.
Hyperliquid Liquidation Data Today
Liquidation activity over the past day shows longs absorbing the bulk of the pressure as the timeframe widens, even though the picture looks different in the shortest window.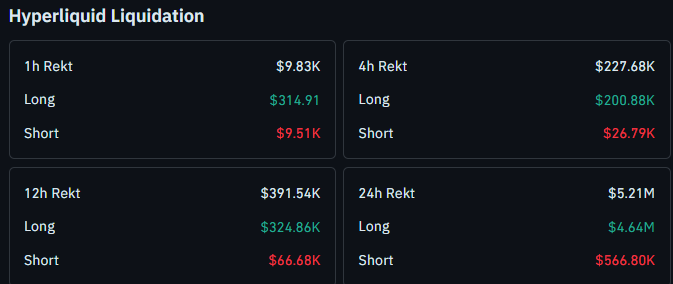
Over the past hour, $9.83K was liquidated, with $314.91 coming from longs and $9.51K from shorts, a rare stretch where short sellers took the bigger hit.
That flips quickly on wider windows. The 4-hour figure shows $227.68K in total liquidations, made up of $200.88K in longs and $26.79K in shorts.
Over 12 hours, the total rises to $391.54K, with $324.86K from longs and $66.68K from shorts.
Across the full 24 hours, liquidations reach $5.21M. Longs account for $4.64M of that figure, while shorts make up the remaining $566.80K.
The heavy day-long skew toward long liquidations lines up with the sharp move down before $HYPE found its recent floor, while the short-lived reversal in the 1-hour window hints that sellers are now the ones getting caught off guard closer to current price.
A full breakdown is available through HYPE liquidation tracker on CoinGlass.
Hyperliquid ETF Flows: What The Data Shows
According to SoSoValue's HYPE spot ETF tracker, HYPE spot ETF products logged no daily net inflow on July 22, holding cumulative net inflows at $300.64M with total net assets at $301.78M.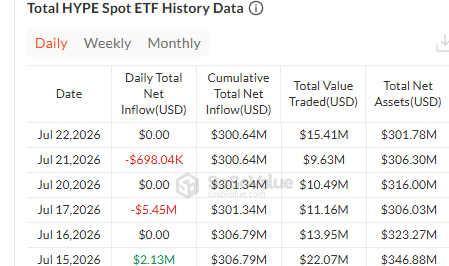
The day before, July 21, saw a net outflow of $698.04K, though cumulative inflows still held at $300.64M since that outflow was measured against a slightly higher prior balance.
Stepping back further, July 20 came in flat at $301.34M cumulative, July 17 saw a sharper outflow of $5.45M, and July 16 was flat again at $306.79M cumulative.
July 15 was the strongest day in this stretch, with a $2.13M net inflow and total net assets peaking at $346.88M that day.
Taken together, the trend over the past week and a half leans mildly negative on flows even as total net assets have held up reasonably well, which is worth treating as background context rather than a standalone reason to expect a specific price move.
Hyperliquid Price Prediction: 1-Hour Chart Analysis
On the 1-hour chart, $HYPE had been falling in a fairly disciplined way, respecting a descending trendline on the way down without much deviation. That changed once the price reached a support zone lower on the chart.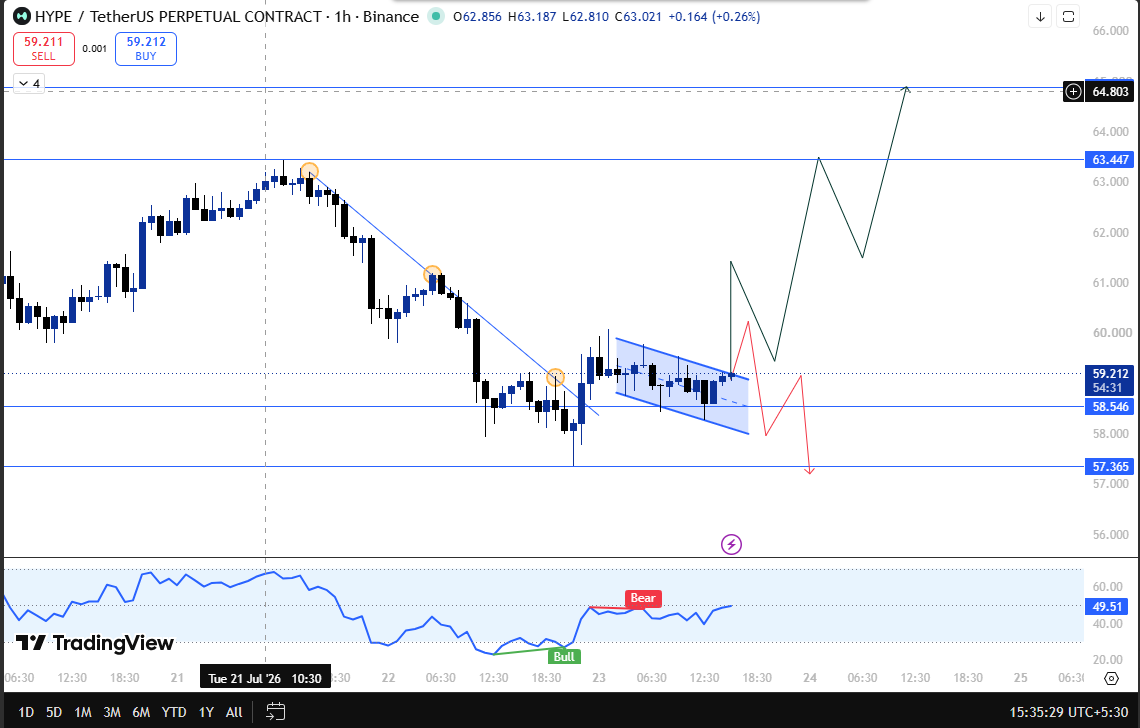
Buyers stepped in there with enough force to break the descending trendline outright, which is generally a meaningful shift since it shows sellers lost control of the exact structure that had been guiding the decline.
This kind of reversal of a defended trendline is similar to what played out in our earlier HYPE breakout toward the $80 forecast, where a comparable structural break led to a fast continuation once buyers took over.
The catch is what happened right after this latest break.
Instead of continuing cleanly higher, $HYPE has been trading inside a descending channel since the breakout, meaning the bigger downtrend was broken, but a smaller, shorter-term corrective structure has taken its place.
This structure is likely to determine the next directional move.
If HYPE breaks out of this descending channel and closes above it, the more likely path leads toward $63.447, with $64.888 as the next level beyond that.
If price pushes against the top of the channel but fails to close above it, a retest of the $58.546 support becomes the more probable outcome.
Should the price go on to break and close below $58.546, that would open the door to $57.365 as the next support in view.
Hyperliquid Technical Snapshot
| Indicator | Signal |
| Trend | Descending trendline broken, now inside a descending channel |
| Structure | Buyers defended support and broke prior downtrend |
| Liquidations | Longs dominate the 24h total; shorts took the recent hourly hit |
| ETF Flows | Mildly negative over the past week and a half |
For a look at how $HYPE handled a similar pullback earlier this month, see our HYPE pullback breakdown levels coverage, where a comparable retracement structure played out before the next leg.
Hyperliquid Support And Resistance Levels To Watch
| Type | Level | Note |
| Resistance 2 | $64.888 | Extended upside target |
| Resistance 1 | $63.447 | First target on a confirmed channel breakout |
| Current Price | $59.212 | Trading inside the descending channel |
| Support 1 | $58.546 | Retest zone if channel breakout fails |
| Support 2 | $57.365 | Next level on a confirmed close below $58.546 |
This falling channel setup has some resemblance to the pattern covered in our HYPE pennant breakout analysis, where a similar consolidation structure eventually resolved with a decisive directional move.
Risk-Reward Table
| Case | Trigger | Target |
| Bull Case | Breaks and closes above the falling channel | Move toward $63.447, then $64.888 |
| Bear Case | Fails at the channel top and closes below $58.546 | Slide toward $57.365 |
Invalidation Level
The bullish read on $HYPE stays intact as long as the price holds above $58.546 on a closing basis. A confirmed close below that level would invalidate the setup and shift attention to $57.365.
If the price instead closes above the falling channel, that is treated as confirmation the corrective structure has ended in favor of buyers.
This mirrors the invalidation logic used in our earlier HYPE key support test, where a similar closing-basis trigger determined whether that setup held.
Historical Context
The break of the descending trendline is the more important development here, since it shows buyers had enough strength to end a fairly clean downtrend rather than just producing a brief bounce.
The falling channel that has formed since then is a smaller, shorter-lived structure sitting on top of that bigger shift, and how HYPE resolves it should say a lot about whether the trendline break turns into a sustained recovery or just a pause before more downside.
A related dynamic played out in our HYPE whale selloff support test, where price also had to prove itself at a defended level before the next move became clear.
How Bitcoin Could Influence HYPE
While the current setup is based entirely on HYPE's own 1-hour chart, Bitcoin remains an important market-wide driver.
A sharp move in BTC could accelerate $HYPE's next directional move even if the current technical structure remains unchanged.
If Bitcoin breaks higher with strong volume, it could increase buying interest across major altcoins, improving the chances of $HYPE reaching the $63.447 and $64.888 resistance levels.
Conversely, a sudden Bitcoin sell-off could pressure $HYPE and increase the likelihood of a retest of the $58.546 support or even $57.365, regardless of the current falling channel setup.
As always, traders should monitor Bitcoin alongside $HYPE before acting on short-term technical signals.
Hyperliquid Glossary
Descending Trendline: A falling line connecting a series of lower highs, used to track the pace and structure of a downtrend.
Falling Channel: A short-term price structure formed by two parallel downward-sloping lines, often forming as a corrective pause after a larger trend shift.
RSI (Relative Strength Index): A momentum indicator used to judge whether an asset has moved too far too fast in one direction, commonly used alongside price structure for confirmation.
Liquidation: What happens when a leveraged trade gets forcibly closed because the trader ran out of margin to keep it open.
ETF Net Inflow: The amount of new money entering an ETF product on a given day, used as a rough gauge of institutional demand.
Expert View
The break of HYPE's descending trendline at support is the more meaningful signal on this chart, since it took real buying pressure to end a fairly orderly downtrend.
The falling channel that has formed since then looks more like a pause than a reversal of that shift, and how price resolves it will likely set the tone for the next few sessions.
A close above the channel would support a move toward $63.447 and possibly $64.888.
A failed breakout that slips back below $58.546 would suggest sellers have regained some control, with $57.365 becoming the next level to watch.
For readers thinking beyond this week's structure, our 2026 HYPE price outlook walks through the broader picture.
Commentary from Multicoin's Tushar Jain about unstaking for privacy reasons rather than selling adds some context around institutional behavior, though it should be read as background rather than a direct driver of these short-term levels.
Disclaimer: This article is for informational purposes only and should not be considered financial advice. Cryptocurrency markets are highly volatile, and price predictions are not guaranteed. Please do your own research before making any investment decisions.
0
0

 Manage all your crypto, NFT and DeFi from one place
Securely connect the portfolio you’re using to start.

0
0

0
0

0
0
