
Chainlink Price Prediction: $LINK $200 Analyst Target, Big Rally Soon?

0
0

LINK is heating up again, and traders chasing the next leg are watching closely.
This Chainlink price prediction comes right as Standard Chartered dropped a bold $200 target on the table, and price has already broken above a multi-month downtrend to back it up.
Over the next one to two weeks, the bullish case stays alive as long as LINK holds above $8.1660; lose that level and the breakout story weakens fast.
With oracle transaction volume climbing past $33 trillion and fresh eyes on the chart, here's what the setup actually shows.
Market data was checked on August 11, 2026, at 09:52 IST.
Chainlink Price Prediction Today: Market Overview
Metric | Value |
Price | $8.3881 |
24h Change | +1.18% |
Market Cap | $6.28B |
FDV | $8.39B |
24h Volume | $245.2M |
Vol/Mkt Cap (24h) | 3.9% |
Liquidity/Mkt Cap | 0.85% |
Total Supply | 1B LINK |
Max Supply | 1B $LINK |
Circulating Supply | 748.09M $LINK |
Source: Data from CoinMarketCap as of August 11, 2026, at 09:52 IST.
Figures may vary slightly across other tracking websites.
Chainlink News Today: Standard Chartered's $200 Call
Cointelegraph reported that Standard Chartered has put out a price target of $200 for LINK by 2030.
According to the bank, Chainlink stands to benefit as the value of tokenized real-world assets grows toward $4 trillion over the next several years. 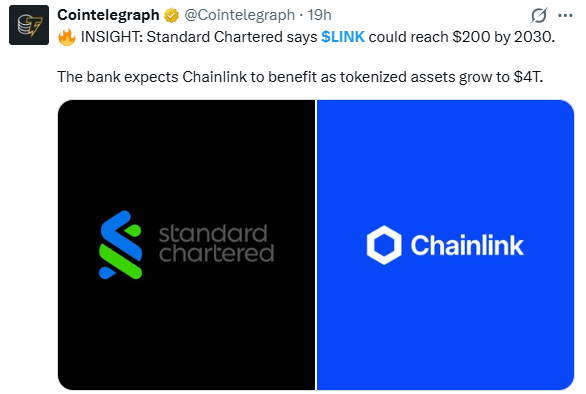
Source: Data From X
Note: CoinGabbar could not independently verify the bank's internal modeling behind that figure, and a target this far out should be treated as a long-range projection rather than a near-term forecast.
Chainlink On-Chain Update: $33.43 Trillion in Transaction Value
A tweet from BSCN noted that Chainlink's oracle network has now enabled a combined $33.43 trillion in transaction value since launch. 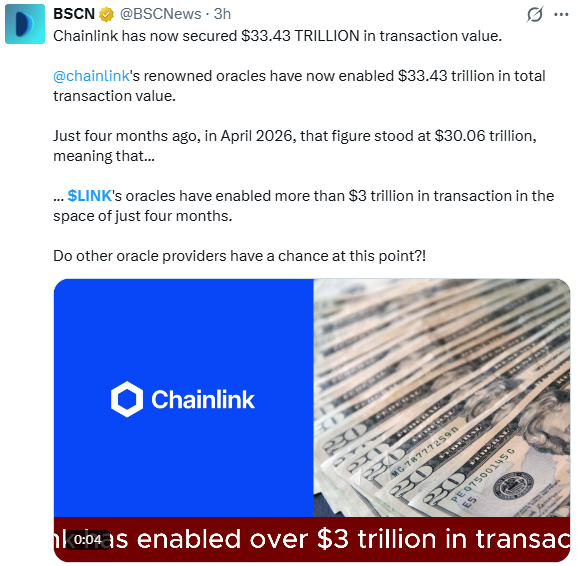
Source: Data From BSCN
That figure was reportedly $30.06 trillion as recently as April 2026, meaning more than $3 trillion in additional transaction value has flowed through Chainlink's oracles in about four months.
This is presented as an on-chain usage estimate rather than an audited figure, so it's worth treating the pace of growth as directionally useful rather than exact.
Chainlink Price Prediction Chart: Technical Analysis
Pair: LINK/USD · Market: Spot (Crypto) · Exchange: TradingView Crypto Index · Timeframe: 1D · Source: TradingView · Timestamp: August 11, 2026, 09:52 UTC+5:30
LINK is trading at $8.3881, after breaking above the descending trendline that had capped the price since the May highs.
That trendline held as resistance through most of June and July before price pushed back above it in early August, and LINK has spent the last week or so consolidating just above the breakout zone.
The EMA (Exponential Moving Average, an indicator that tracks the average price over a set number of candles and reacts faster to recent price moves) 20 sits at $8.2659 and the EMA 50 at $8.2532, both sitting almost on top of each other just below the current price, which is often a sign that a trend is trying to establish itself rather than reverse.
RSI is reading 54.02, which is neutral and doesn't point strongly toward overbought or oversold conditions either way.
If the price breaks the upper resistance and holds, then we can assume the price will go up. In another case, if the price breaks the current support, then we can see lower levels. 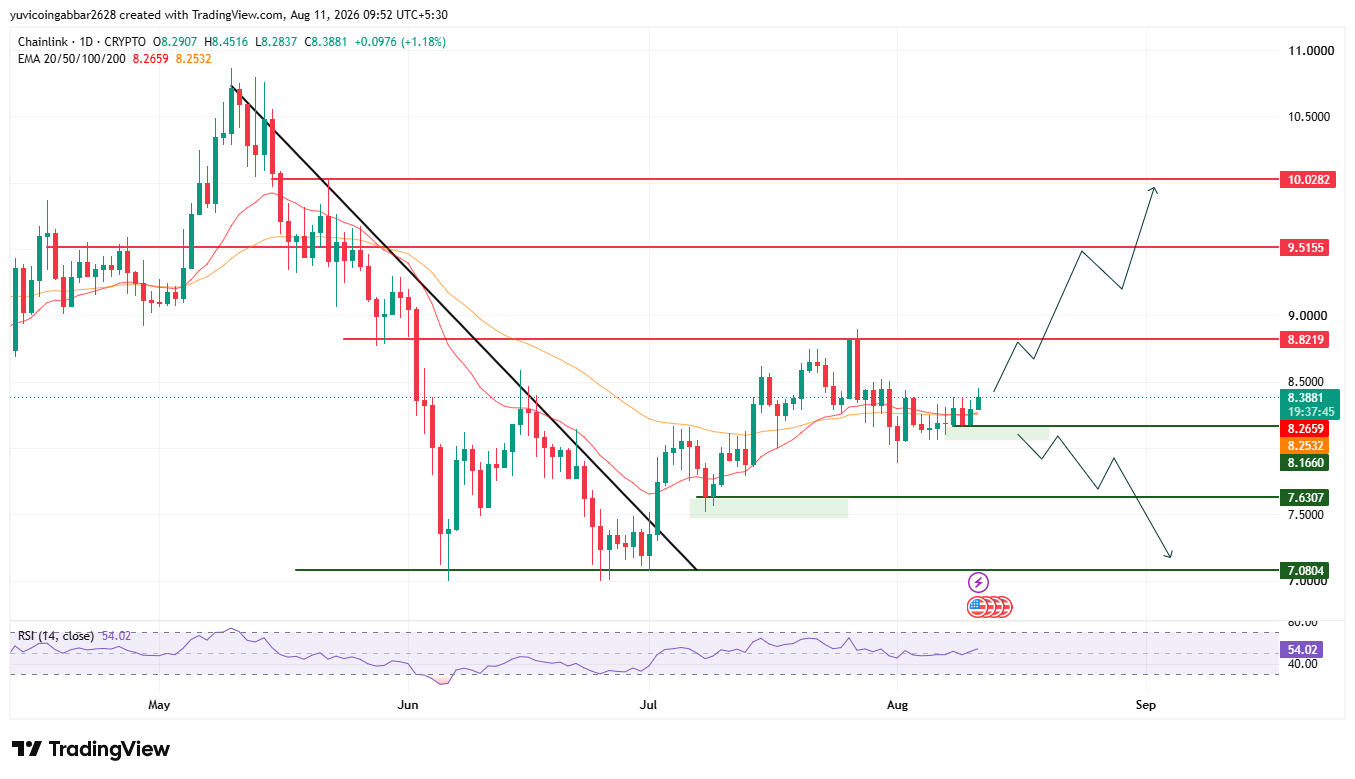
Support and Resistance Levels
Level Type | Price |
Resistance 3 | $10.0282 |
Resistance 2 | $9.5155 |
Resistance 1 (nearest) | $8.8219 |
Immediate Price Reference | $8.3881 |
First Confirmed Support | $8.1660 |
Deeper Support | $7.6307 |
Structural Floor | $7.0804 |
EMA Levels
EMA | Price |
EMA 20 | $8.2659 |
EMA 50 | $8.2532 |
Chainlink Forecast: Bull Case vs. Bear Case
LINK price target 2026 Bull case: Holding above the EMA 20 and EMA 50 cluster near $8.2532 to $8.2659 keeps the trendline breakout intact.
A confirmed close above the nearest resistance at $8.8219 would open the door toward $9.5155 and then $10.0282, especially if the Standard Chartered target keeps drawing fresh attention to LINK.
LINK price target 2026 Bear case: A drop back below the EMA cluster and toward $8.1660 would put the breakout in doubt and suggest the recent move above the trendline was short-lived.
Losing $8.1660 would expose $7.6307 as the next support, with the structural floor at $7.0804 below that.
LINK price target: Can LINK reach $10.0282?
$10.0282 is the highest resistance level marked on the chart. Getting there would mean clearing the EMA 20/50 cluster first, then breaking and holding above $8.8219, and finally pushing through $9.5155 before testing $10.0282.
That's a multi-stage climb rather than a single move, and each level along the way would need to flip from resistance into support for the run to keep going.
What Could Invalidate the Bullish Setup?
A rejection at the EMA cluster near $8.2532 to $8.2659 followed by a daily close back below $8.1660 would call the trendline breakout into question.
A deeper slide through $7.6307 down to the $7.0804 structural floor would undo most of the recovery LINK has built since the May downtrend and would likely need a broader market pullback to trigger.
Chainlink Price Prediction 2026: Expert View
According to CoinGabbar analysts, LINK's break above a multi-month downtrend line is a meaningful technical shift, and the fact that price is holding above it instead of immediately fading back below is a good early sign.
RSI sitting near the midpoint suggests there's still room to run before the setup looks stretched.
The Standard Chartered target and the steady growth in oracle transaction value are both longer-term tailwinds rather than near-term triggers, so they matter more for sentiment than for the next week or two of price action.
The $8.2532 to $8.8219 range is the zone to watch: holding it keeps the breakout thesis alive, and losing it would put buyers back on the defensive.
Chainlink Price Prediction: Data Sources
Price, EMA, and RSI data referenced from a 1D LINK/USD chart via TradingView, timestamped August 11, 2026, 09:52 UTC+5:30.
Market cap, FDV, volume, and supply data referenced from a crypto market tracker (CoinMarketCap/CoinGecko-style source).
Standard Chartered's price target was reported via Cointelegraph. Oracle transaction value data reported via BSCN.
Disclaimer: This piece is for informational purposes only and isn't financial advice. The levels and scenarios above are based on technical chart analysis and publicly available data at the time of writing, and crypto markets can move sharply within hours, so past patterns don't guarantee future outcomes. It's worth doing independent research and considering your own risk tolerance before acting on any of the levels discussed here.
0
0


 Manage all your crypto, NFT and DeFi from one place
Securely connect the portfolio you’re using to start.


0
0

0
0

0
0