ONDO slips 6% as bearish setup persists: check forecast

0
0

Bitcoin (BTC), Ethereum (ETH), and Ripple (XRP) are currently in the red as the broader crypto market pauses after its recent rally.
However, ONDO, the native coin of the Ondo Finance ecosystem, is one of the worst performers among the top 100 cryptocurrencies by market cap.
The coin is down 6% in the last 24 hours and faces further downward pressure, with the bears now targeting the $0.2400 support level.
The derivatives data support the current bearish outlook, with intense long liquidations adding further confluence to this narrative.
Technically, the real-world asset (RWA)- focused crypto is losing ground and risks a further correction in the near term.
Derivatives data indicate declining retail demand
The core driver behind ONDO’s bearish performance over the past few days is the declining retail demand.
Currently, the leverage market anticipates further declines in ONDO as the uncertainty from the US-Iran ceasefire deal weighs on the broader cryptocurrency market.
Data obtained from CoinGlass shows that ONDO futures recorded a total liquidation of $99,730 over the last 24 hours, led by $93,410 in long liquidations, indicating an intense sell-side pressure in the spot market.
The massive liquidation resulted in a 6% decline in the ONDO futures Open Interest (OI) to $81.84 million over the same period, indicating reduced market participation.
The sharp liquidation led to a 5% decline in the ONDO futures Open Interest (OI) to $86.01 million over the same period, indicating reduced market participation.
Furthermore, ONDO’s funding rate dropped to -0.0007% and the long-to-short ratio to 0.9342, both of which suggest a bearish inclination among traders.
ONDO could retest $0.2400 support amid downside pressure
The ONDO/USD 4-hour chart is bearish and efficient as Ondo is down 6% in the last 24 hours. Currently, ONDO is trading below the 50-day Exponential Moving Average (EMA) at $0.2700
With the recent decline, the 100-day EMA at $0.3186 and the 200-day EMA at $0.4420 remain well above the market, reinforcing a broader downside-skewed structure.
If the bulls regain control, they would encounter immediate resistance at the 50-day EMA of $0.2700. An extended rally would bring the $0.2968 resistance level into focus in the near term.
The momentum indicators align with the bearish market outlook. The Relative Strength Index (RSI) on the 4-hour chart reads 48, below the 50 midline.
The Moving Average Convergence Divergence (MACD) indicator prints a negative reading below zero, hinting at persistent selling pressure in the near term.
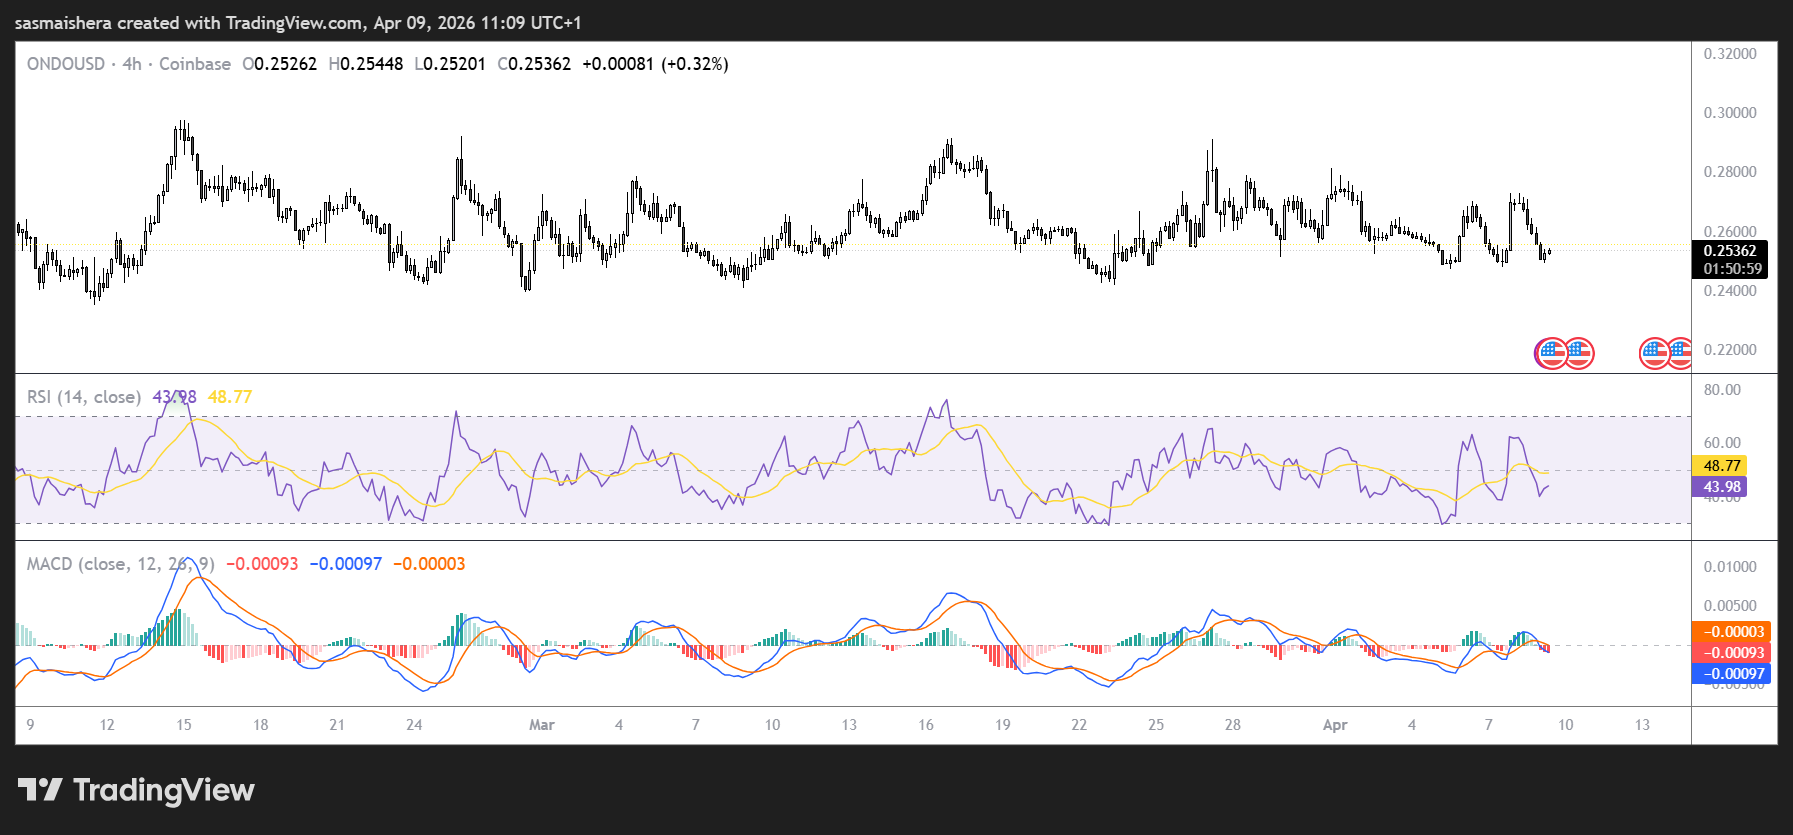
However, if the selloff persists, ONDO will likely retest the February 9 low of $0.2405 over the next few hours or days.
The February 6 low of $0.2018 is also another target for the bears.
Consequently, a drop below the $0.2000 psychological level would significantly increase the downside risk.
The market conditions remain fragile at the moment. If the ceasefire deal holds, then Bitcoin and other major coins like ONDO could record further gains over the next few days.
The post ONDO slips 6% as bearish setup persists: check forecast appeared first on Invezz
0
0


 Manage all your crypto, NFT and DeFi from one place
Securely connect the portfolio you’re using to start.


0
0

0
0