
Hyperliquid Price Prediction: Will HYPE Break Out Today?

0
0

Hyperliquid price prediction searches are spiking as $HYPE presses right into the resistance edge of a pattern that has been building for over two weeks.
This is the kind of setup traders wait for: price compressed into a tightening wedge, and the next candle could decide whether $HYPE finally breaks free or gets pulled back into the range one more time.
The levels described here apply strictly to the 4-hour timeframe covered and should be rechecked if the price closes beyond the stated range.
$HYPE Trend and Momentum: Key Takeaways
HYPE is trading right at the resistance edge of a falling wedge pattern
A close above $56.169 opens $60.429, then $63.450, and $69.121 further out
A rejection here with a close below $51.135 puts the $50.038 zone in view
$50 is a psychological level, so an instant bounce is possible if it gets tested
Shorts dominated liquidations across every window in the past 24 hours
Spot ETF flows for $HYPE turned negative over the last two sessions, even as price climbed
Hyperliquid Price Right Now
Metric | Value |
Price | $55.217 |
24h Change | +4.68% (+$2.4714) |
Market Cap | $13.92B |
Futures Volume (24h) | $1.81B |
Spot Volume (24h) | $97.46M |
Open Interest | $2.34B |
Circulating Supply | 252.41M HYPE |
Total Supply | 952.84M HYPE |
Max Supply | 952.84M HYPE |
Open interest is the total value of HYPE derivative contracts still open across exchanges, a rough gauge of active leveraged positioning.
Chart source: HYPE/USDT 4-hour perpetual contract, TradingView, Binance data feed, captured August 4, 04:31 PM IST (11:01 AM UTC). Market cap, volume, and supply data from HYPE key-level tracking on CoinGlass were captured the same day.
Hyperliquid Price Prediction Methodology and Data Sources
This read uses the HYPE 4-hour chart for structure, with volume, open interest, and market cap figures from CoinGlass HYPE data, and liquidation flow from CoinGlass liquidations. Levels are only treated as invalidated on a confirmed closing candle beyond the stated trigger, not an intraday wick. For a broader monthly read beyond this single setup, see the Hyperliquid monthly outlook.
Hyperliquid ETF Flows: Why Institutions Are Pulling Money Out
Adding some context here, HYPE spot ETF data shows daily net outflows on both of the last two recorded sessions.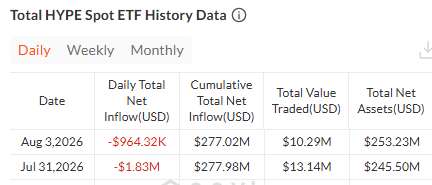
On August 3, the fund saw a net outflow of $964.32K, bringing cumulative net inflow down to $277.02M with $10.29M traded and $253.23M in total net assets.
On July 31, the outflow was larger at $1.83M, with cumulative inflow at $277.98M that day.
This divergence, with the price rallying nearly 5% while ETF flows lean negative, does not confirm or deny the chart setup, but it is a fundamental data point worth tracking alongside this Hyperliquid price prediction.
Source: SoSoValue, HYPE Spot ETF tracker, checked August 4.
$HYPE Liquidation Data Shows Shorts Under Pressure
Liquidations lean almost entirely toward shorts across every timeframe.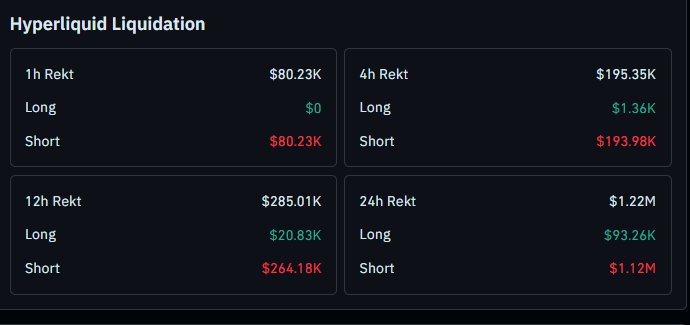
The 1-hour window shows $80.23K wiped out, all from shorts with zero from longs.
The 4-hour window shows $195.35K total, with $193.98K from shorts against just $1.36K from longs.
The 12-hour window shows $285.01K total, $264.18K from shorts versus $20.83K from longs.
Across the full 24 hours, liquidations hit $1.22M, with shorts accounting for $1.12M of that and longs making up $93.26K.
This kind of one-sided short liquidation often lines up with a squeeze into resistance, a dynamic covered further in the HYPE critical support zone.
Source: HYPE liquidation data, CoinGlass, checked August 4, around 04:31 PM IST.
Will $HYPE Break Above $56? Technical Analysis
Can HYPE finally break higher? The chart is pressing into the resistance line of a falling wedge, a pattern that typically resolves upward once broken.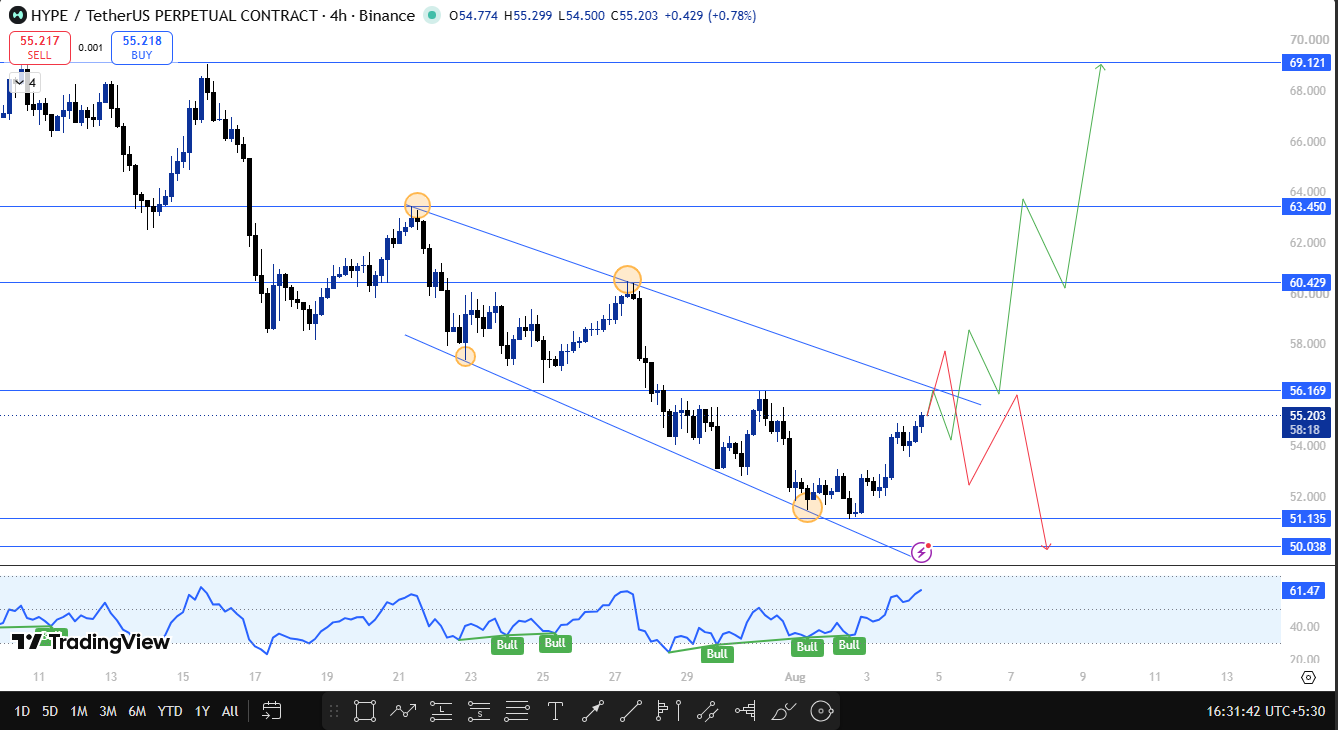
A close above $56.169 would confirm that break, while a rejection here keeps $HYPE capped inside the wedge for now.
HYPE has been tracing a series of lower highs and lower lows since late July, with three clear touches along both the upper resistance line and the lower support line of the wedge.
That converging structure is now approaching its apex, exactly where price sits today.
If $HYPE closes above $56.169, the next resistance to watch is $60.429, a scenario also framed in HYPE next big move, followed by $63.450 and an extended target of $69.121.
If instead $HYPE fails to close above $56.169 and starts falling, a break and close below $51.135 opens the $50.038 zone.
Since $50 is a psychological round number, an instant bounce off that level is possible even without a clear technical trigger.
The chart's momentum oscillator is reading 61.47, having printed several Bull tags over the past two weeks without a single Bear tag in that stretch, a sign that underlying momentum has stayed positive through the consolidation.
$HYPE Trend Prediction: Technical Outlook Snapshot
Indicator | Signal |
Trend | Falling wedge, price testing the upper resistance line |
Structure | No confirmed breakout yet, sitting right at the trigger |
Momentum Oscillator | Reading 61.47, multiple recent Bull tags, no Bear tags |
Liquidations | Shorts dominated every window over the past 24 hours. |
ETF Flows | Two straight days of net outflows despite the price rally |
Hyperliquid Resistance and Support Levels to Watch
Type | Level | Note | % From CMP |
Extended Target | $69.121 | Reachable only after clearing $63.450 | +25.18% |
Resistance 3 | $63.450 | Third target on continuation | +14.91% |
Resistance 2 | $60.429 | The second target after the breakout confirms | +9.44% |
Breakout Trigger | $56.169 | Wedge resistance, confirmation level | +1.72% |
Current Price | $55.217 | Testing the wedge resistance line | - |
Support 1 | $51.135 | Breakdown trigger if $56.169 fails | -7.39% |
Support 2 | $50.038 | Psychological zone, bounce risk on approach | -9.38% |
Risk-Reward Table
Case | Trigger | Target |
Bull Case | Closes above $56.169 | Move toward $60.429, then $63.450, then $69.121. |
Bear Case | Closes below $51.135 | Slide toward $50.038. |
What Would Change This Hyperliquid Price Forecast
The setup stays undecided as long as HYPE holds between $51.135 and $56.169.
A confirmed close above $56.169 validates the wedge breakout, while a close below $51.135 flips the bias toward the $50.038 zone.
False breaks are common at wedge apexes like this one, so a brief push above $56.169 that fails to hold on a closing candle should not be treated as confirmation.
Leveraged positions near either trigger carry added risk given how tight this range has become, a scenario also mapped out in the HYPE breakout zone.
How Bitcoin Sentiment Could Move $HYPE Higher
This setup is built off HYPE's own chart, but Bitcoin still tends to set the ceiling for how far a wedge breakout like this can extend.
A steadier Bitcoin tape generally supports the case toward $60.429 and $63.450 and is part of what the $69.121 extended target depends on.
A weaker Bitcoin backdrop raises the odds HYPE stays capped below $56.169 even if the wedge pattern eventually resolves higher, a decision point also discussed in the HYPE decision range.
When This Hyperliquid Price Prediction Gets Revisited
This Hyperliquid price prediction will be revisited on a confirmed close above $56.169 or below $51.135, or if no clear direction is confirmed within 24 hours of publication.
Readers can also track the HYPE decision zone for the next update on this setup.
Hyperliquid Glossary
Falling Wedge: A converging chart pattern with a downward-sloping resistance line and a shallower downward-sloping support line, typically resolving with an upside breakout.
Open Interest: The total value of derivative contracts still open and unsettled.
Liquidation: The forced closing of a leveraged position when a trader runs out of margin.
Net Inflow/Outflow: The difference between money entering and leaving an ETF on a given day.
Hyperliquid Price Prediction: Bull, Base, and Bear Case
Bull Case: A confirmed close above $56.169 opens $60.429, then $63.450, with $69.121 possible if broader sentiment and Bitcoin hold up, a target explored further in HYPE hit $80 target.
Base Case: $HYPE keeps grinding inside the wedge between $51.135 and $56.169, waiting for a decisive close on either side.
Bear Case: A close below $51.135 shifts focus to $50.038, though the psychological round number could produce a quick bounce even in a breakdown scenario.
Disclaimer
This Hyperliquid price prediction is based on technical chart analysis and market data available at the time of writing. Cryptocurrency markets are highly volatile, and prices can change rapidly. This content is for informational purposes only and should not be considered financial advice. CoinGabbar and the analyst do not hold a position . Always do your own research and consult a qualified financial advisor before making any investment decisions.
0
0

 Manage all your crypto, NFT and DeFi from one place
Securely connect the portfolio you’re using to start.


0
0

0
0

0
0