Top Performers of the Past Month - Celsius Network, Theta, Monero and Binance Coin
5
0
Key Highlights:
- CEL saw a healthy 215% price explosion this past month.
- THETA surged by almost 72% over the last month.
- XMR increased by a total of 49% this past month.
- Binance Coin rose by 28% over the past month.
With the majority of the markets seeing some drastic drops over the past week, we feel like it is time to provide some optimism! Despite YFI dropping by 44% this week, UNI falling by 36% this week, UMA by 35%, and OMG by 28%, we should remember that there are a handful of coins that have seen some substantial price increases over the past month of trading.
Today, let’s look at four coins that have seen a strong price increase over the past month. The coins we will be looking at are CEL (+215%), THETA (+72%), XMR (+39%), and BNB (+28%).
Celsius Network Price Analysis
What has been going on?
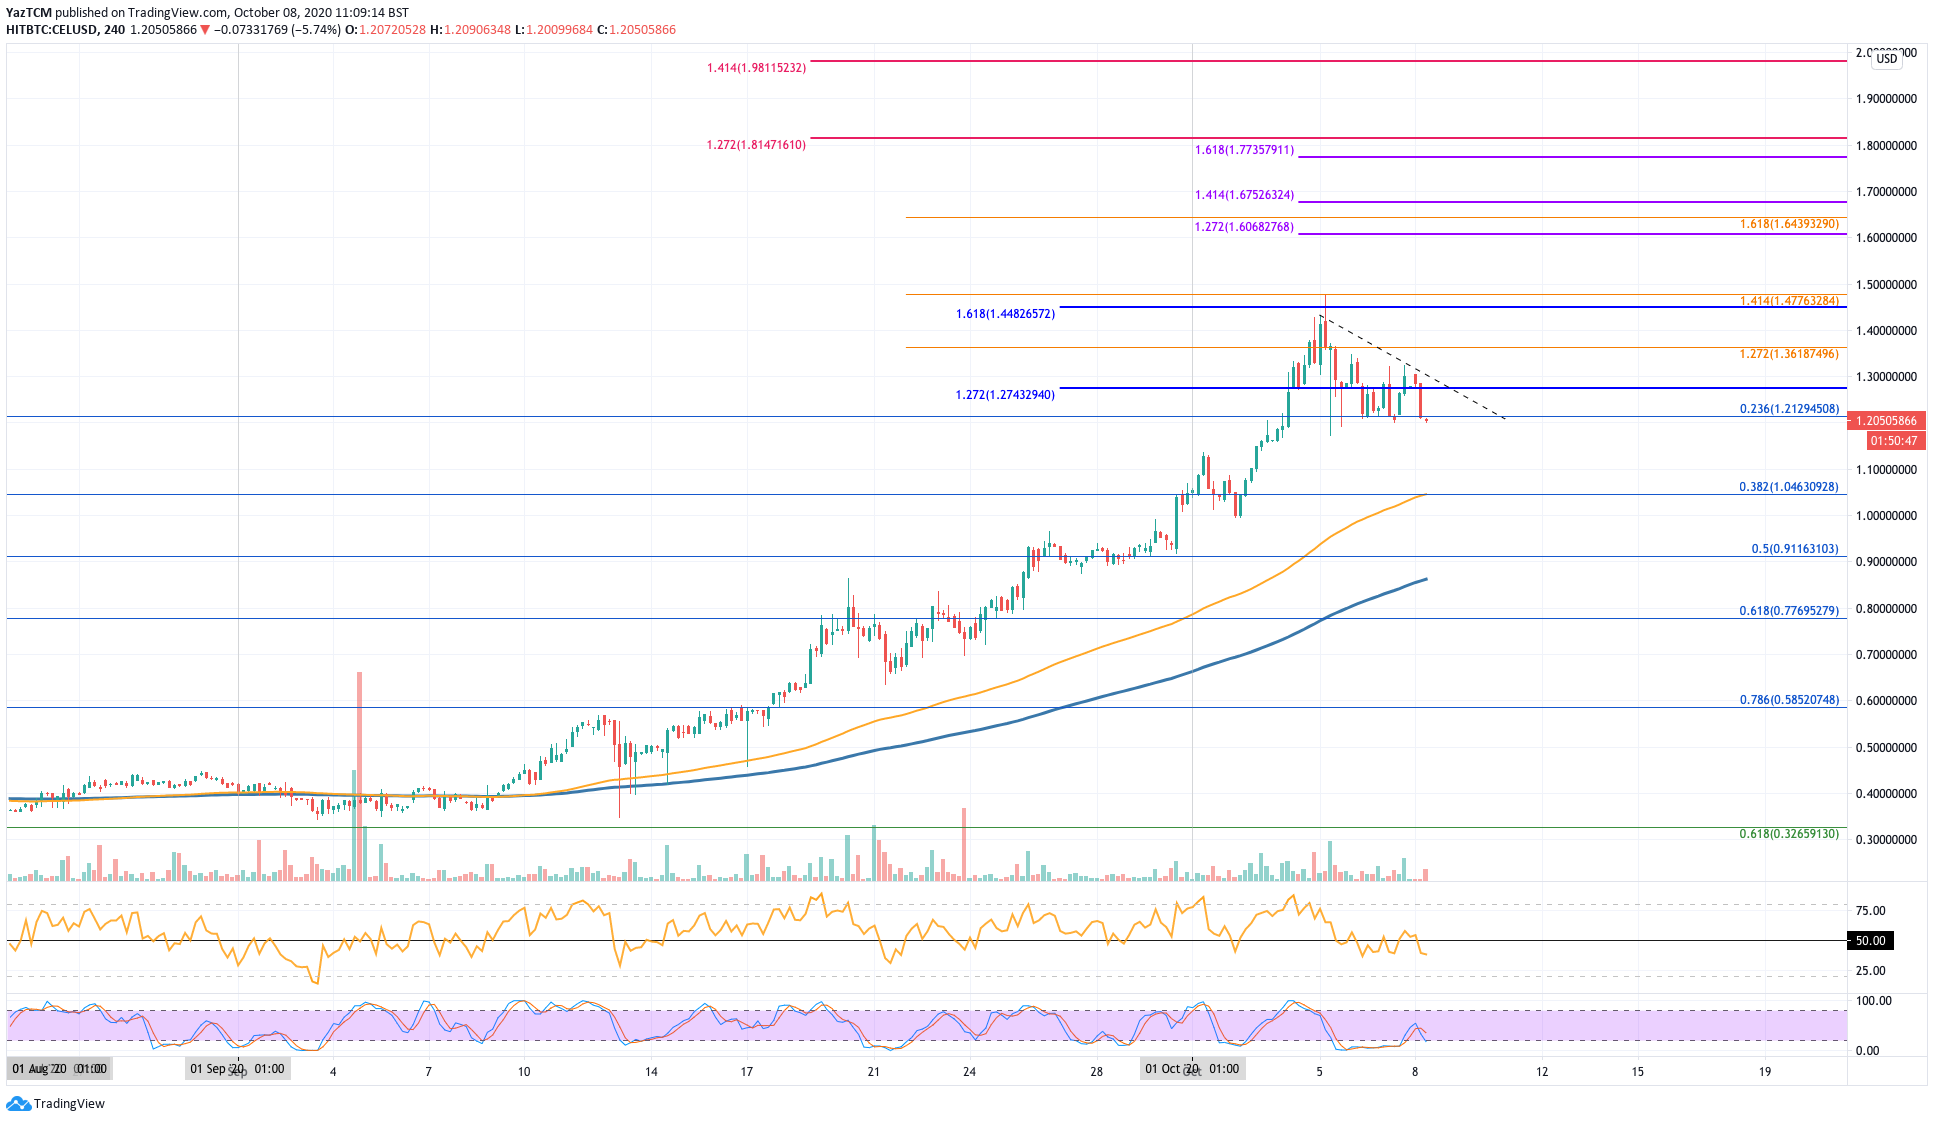
CEL saw an extraordinary performance over the past month after exploding by a total of 215% to reach the current $1.20 price. The coin had started trading in September at around the $0.4 level as it started to grind higher throughout the month. By the end of September, CEL had already managed to climb above the $1.00 level to reach around $1.05.
As October progresses, we can see that CEL continued to surge much higher as it ran into the resistance at $1.47 - provided by a 1.414 Fib Extension level (orange). From there, CEL has started to head lower over the past few days as it dropped into the support at $1.20 (.236 Fib Retracement).
CEL price short term prediction: Bullish
CEL is still obviously very bullish right now. The coin would have to drop beneath $1.00 to turn neutral and further beneath the support at $0.8 before being in danger of turning bearish again.
If the sellers start to push lower, the first level of support lies at $1.10. This is followed by added support at $1.05 (.382 Fib) and $1.00.
If CEL falls beneath $1.00, support then lies at $0.91 (.5 Fib), $0.80, and $0.77 (.618 Fib).
Where is the resistance toward the upside?
On the other hand, the first level of resistance now lies at $1.27. This is followed by resistance at $1.36, $1.40, and $1.47 (1.414 Fib extension - orange). If the buyers continue to drive further above $1.50, resistance can be found at $1.60 (1.272 Fib Extension), $1.64, $1.67 (1.414 Fib Extension), and $1.77.
Additional resistance then lies at $1.81, $1.90, and $2.00.
Theta Token Price Analysis
What has been going on?
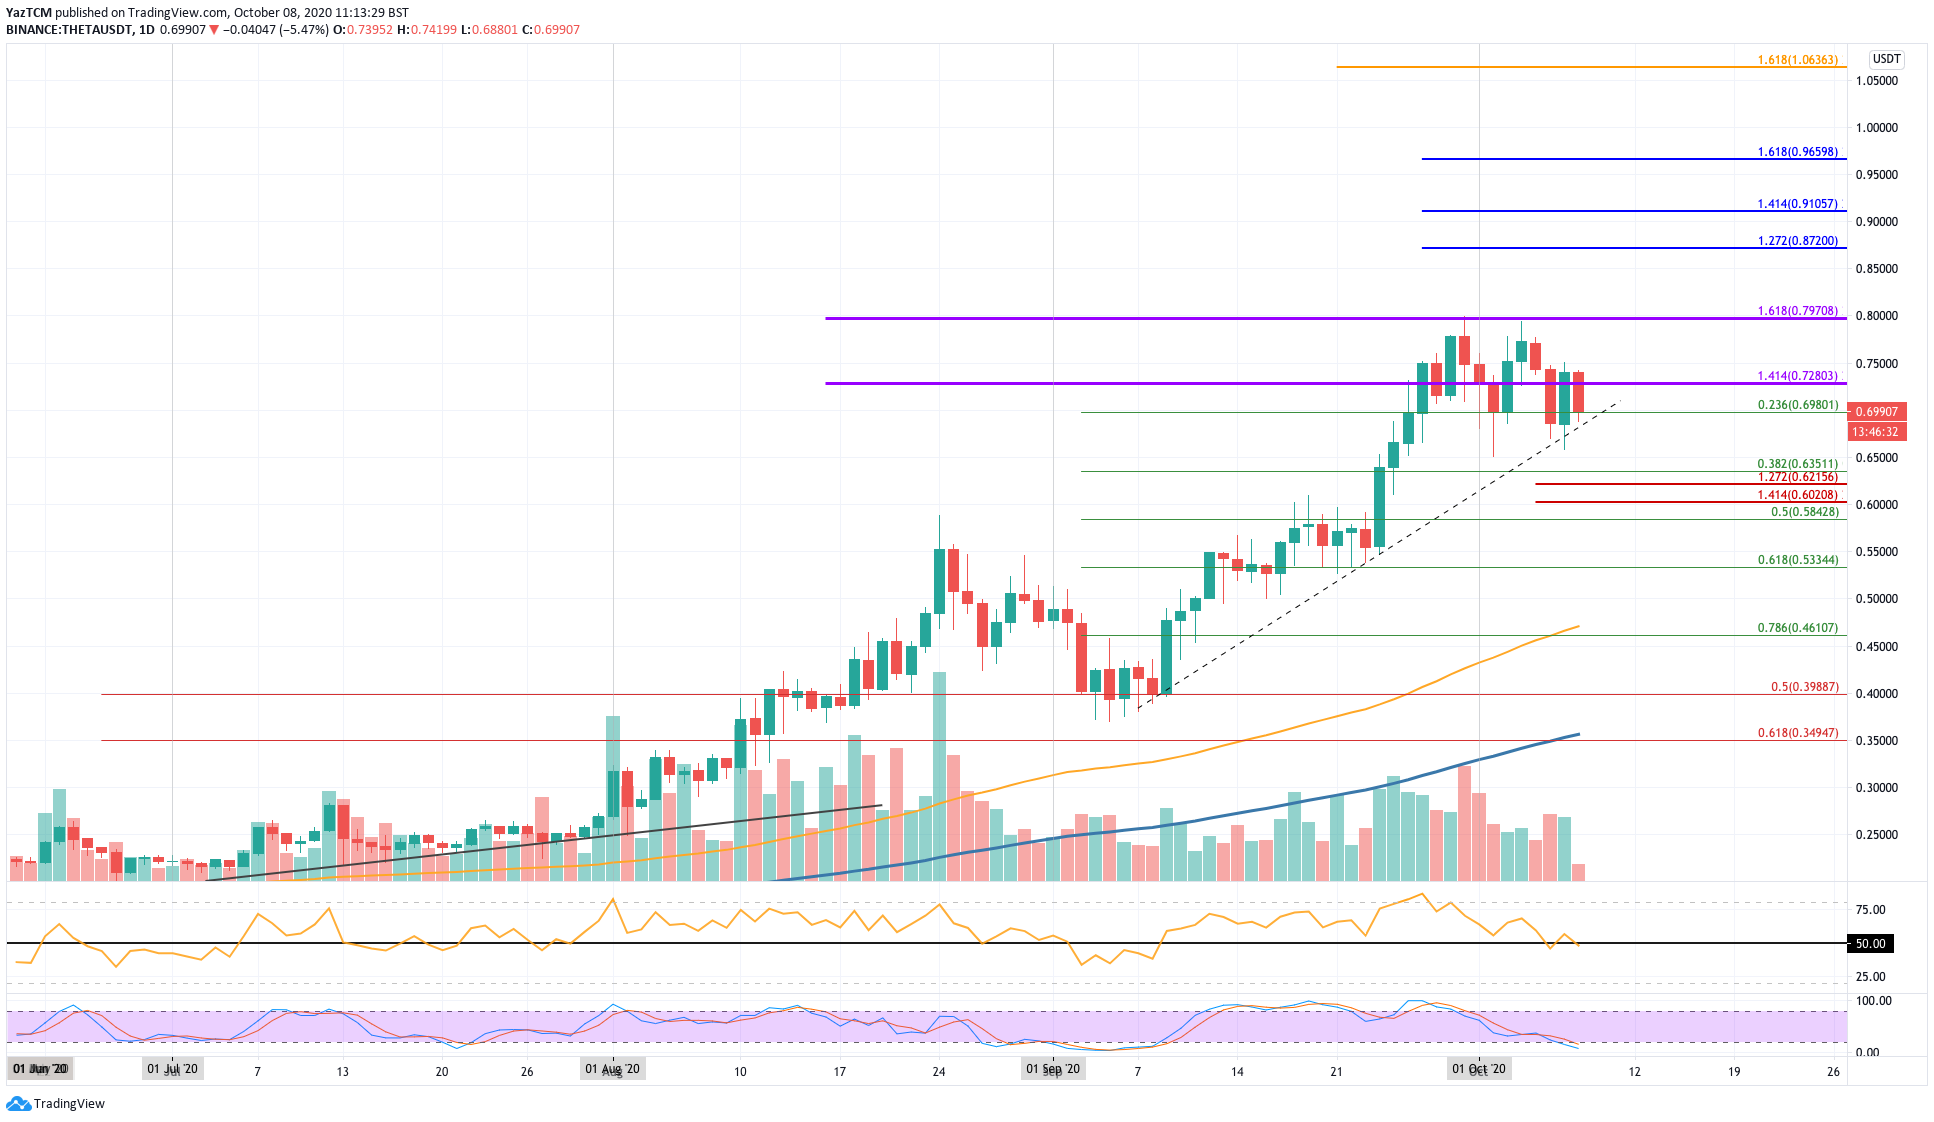
THETA also saw a wonderful 72% price increase over the past month of trading. The cryptocurrency was trading at the $0.40 level at the start of September where it started to push higher. It ended September by pushing higher into the resistance at $0.80 - provided by a 1.618 Fib Extension - and could not break above this level.
After re-testing $0.80 in October, Theta headed lowed but managed to find support around $0.69 (.236 Fib Retracement).
THETA price short term prediction: Bullish
THETA is still considered to be bullish right now. The coin would have to drop beneath $0.635 to turn neutral and further beneath $0.40 to be in danger of turning bearish.
If the sellers do push beneath $0.69, the first level of support lies at $0.635 (.382 Fib). Beneath this, added support lies at $0.621, $0.60, and $0.584 (.5 Fib Retracement).
Where is the resistance toward the upside?
On the other side, the first level of resistance lies at $0.728. This is followed by resistance at $0.80 (1.618 Fib Extension). Beyond $0.8, resistance is expected at $0.87, $0.91, $0.96, and $1.00.
Monero Price Analysis
What has been going on?
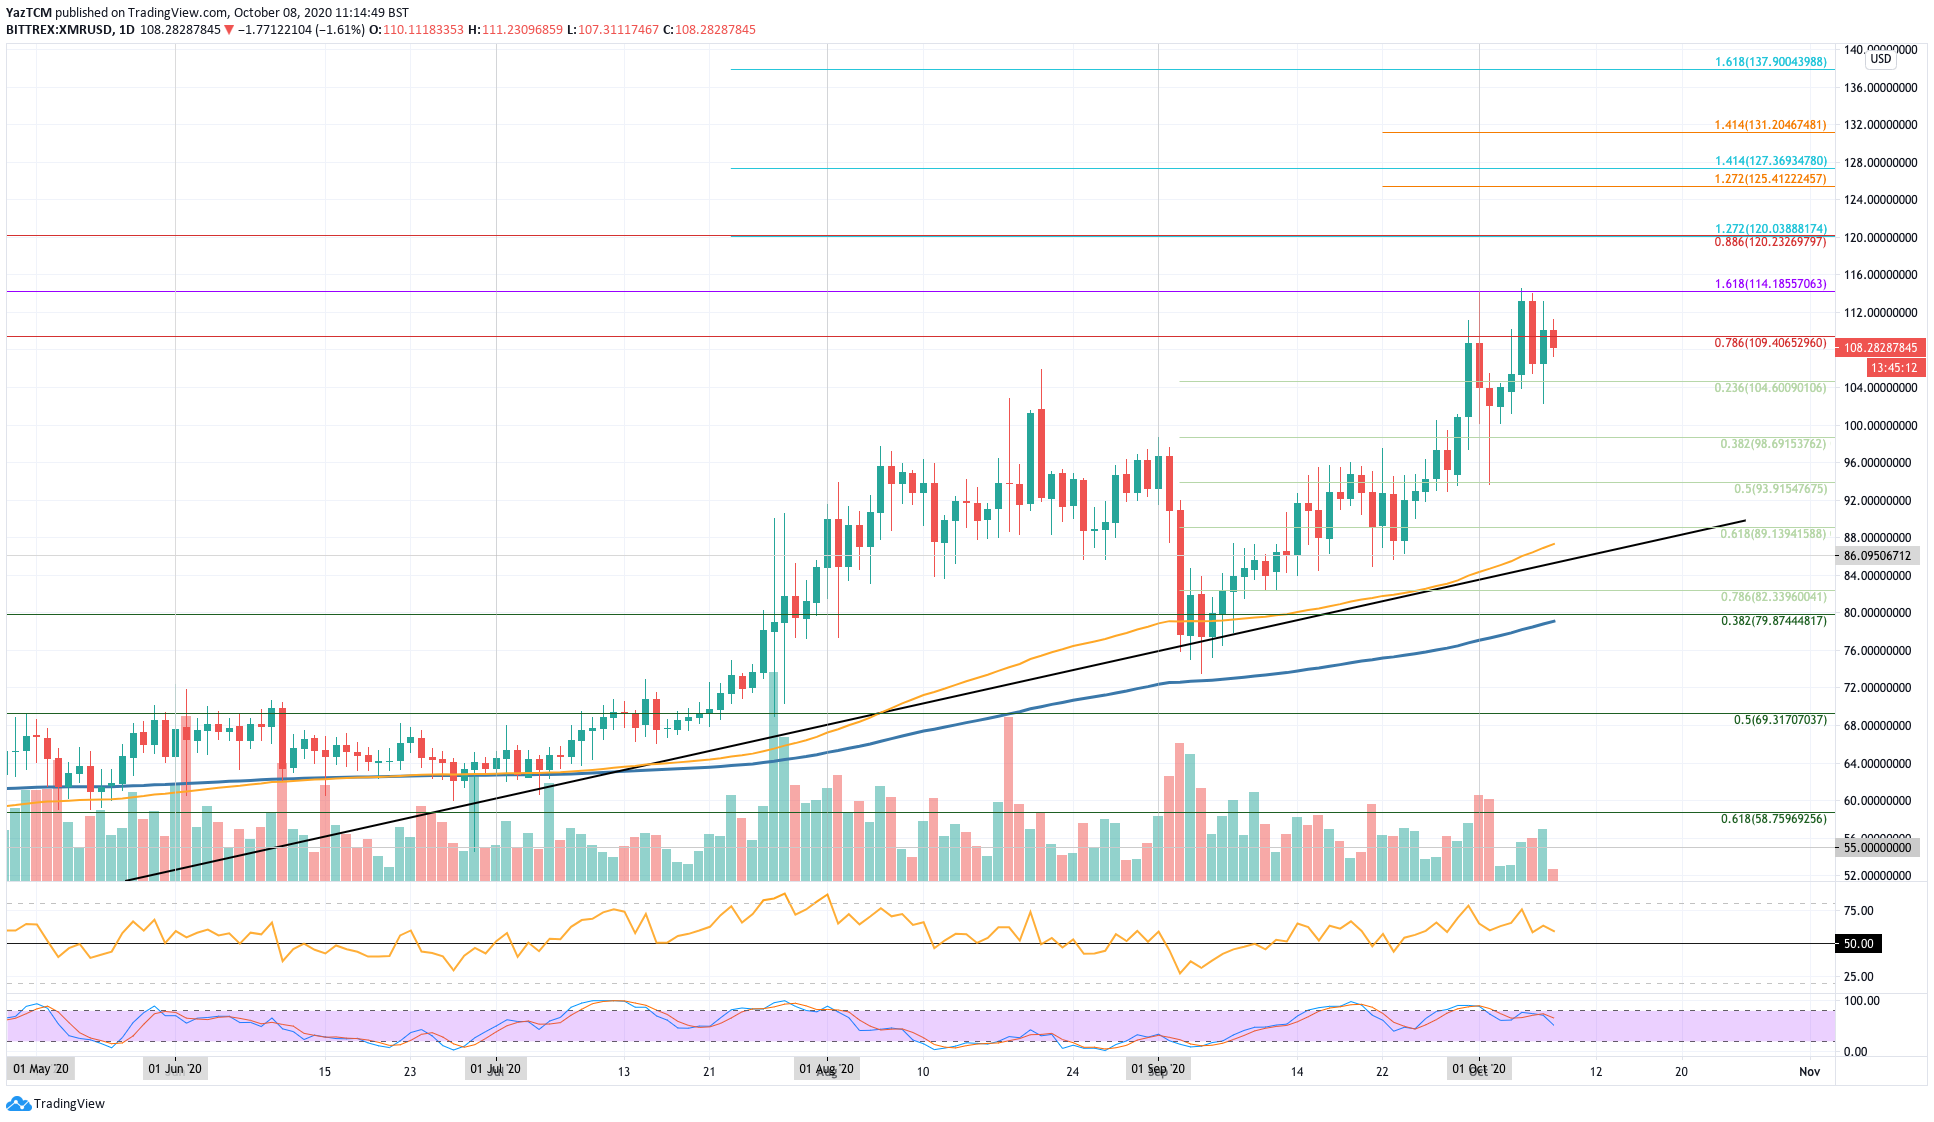
XMR saw a respectable 39% price increase this month as it hits the $108 level today. The cryptocurrency had rebounded from support at a long term rising trend line at the start of September around $80. From there, it started to push higher throughout the month as it closed September at around $109 (bearish .786 Fib Retracement).
In October, XMR continued further higher to reach the resistance at $114.20 (1.618 Fib Extension). So far, it has been unable to break this resistance on 3-attempts to do so and has dropped to $108.
XMR price short term prediction: Bullish
XMR also has to be considered as bullish - especially after creating fresh 2020 highs in October. It would have to break beneath $94 to turn neutral and further beneath $80 to be in danger of turning bearish.
If the sellers push lower, the first level of support lies at $104 (.236 Fib). This is followed by support at $100, $98 (.382 Fib), $94 (.5 Fib), and $90 (.618 Fib & rising trend line). Beneath this, support is found at $86, $82, and $80.
Where is the resistance toward the upside?
On the other side, the first level of resistance to break lies at $114. This is followed by resistance at $120 (bearish .886 Fib Retracement), $125, $127, and $131.
Binance Coin Price Analysis
What has been going on?
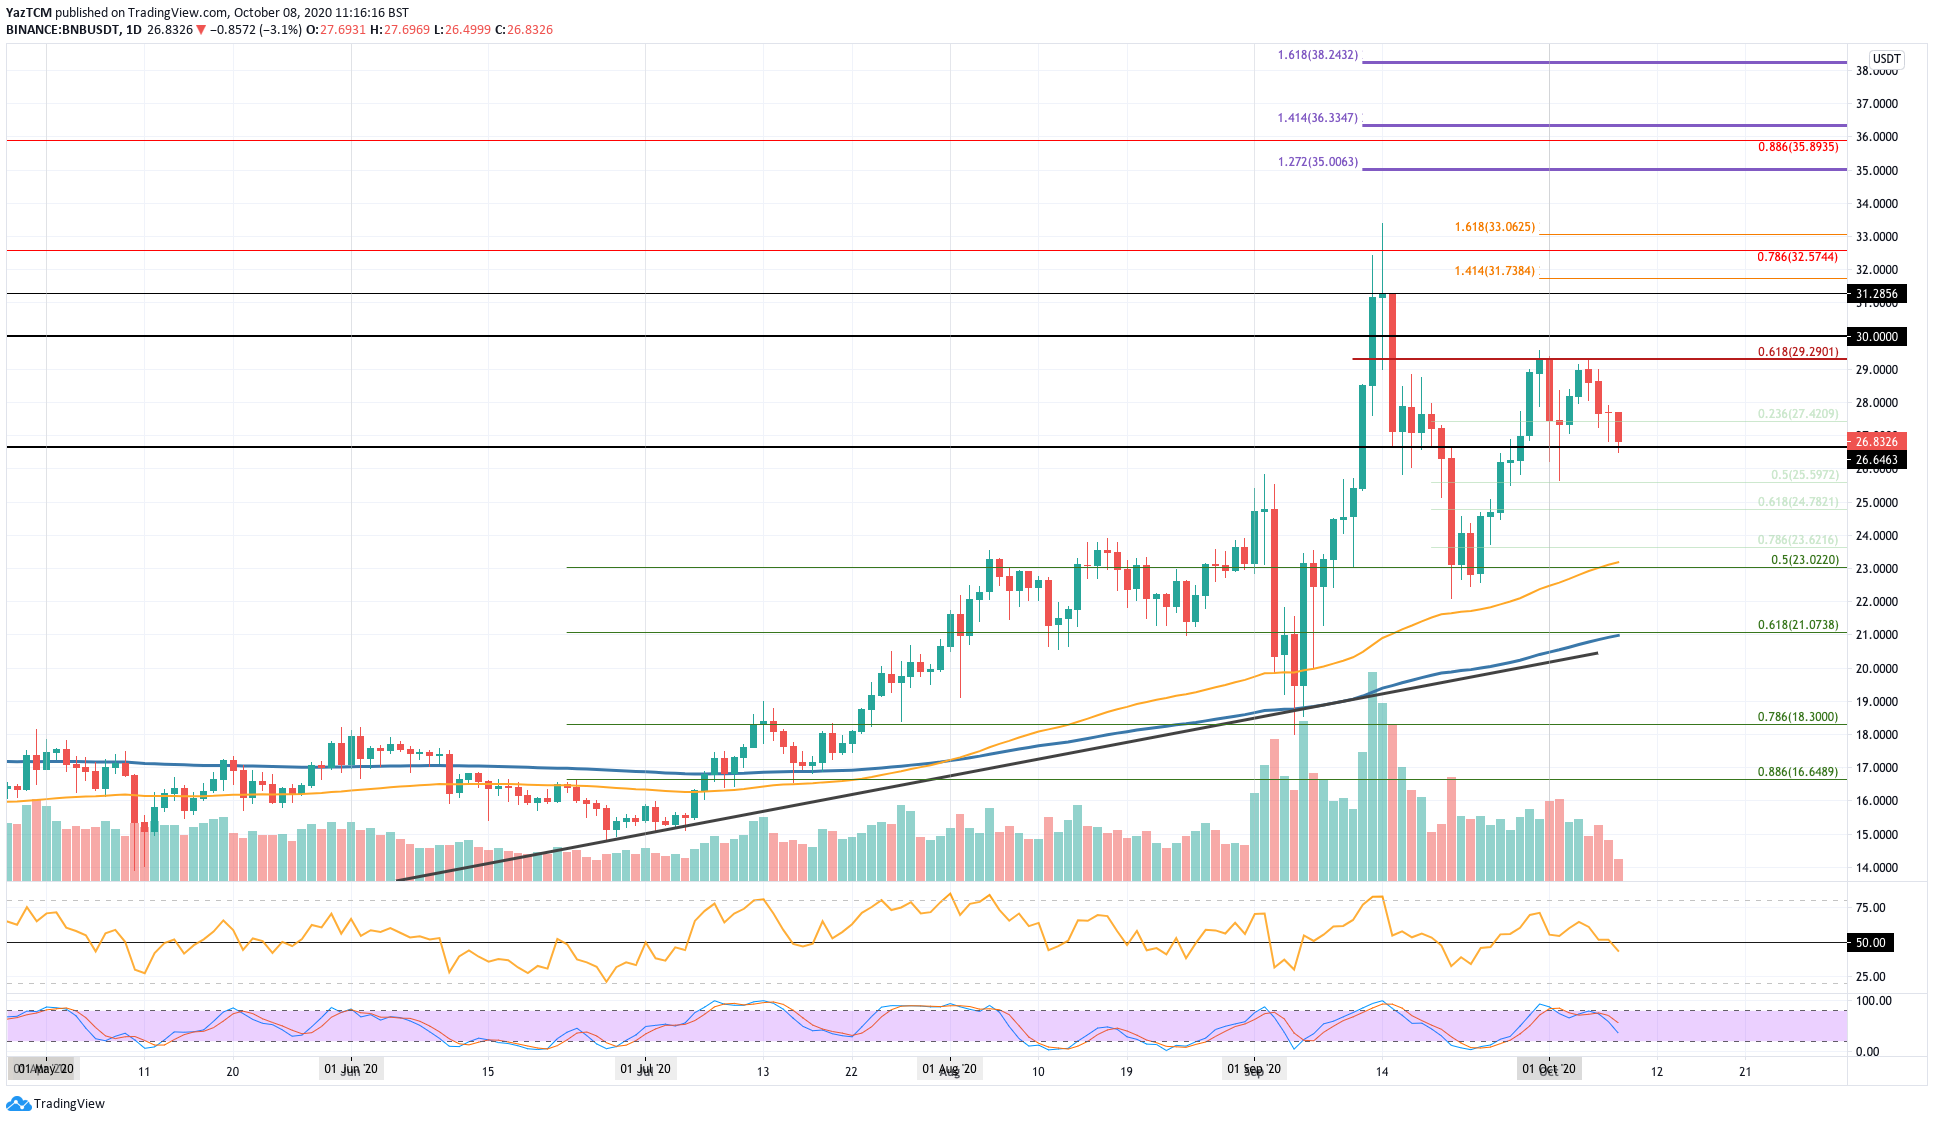
Although it has dropped by a sharp 7% this past week, BNB is still up by a total of around 28% over the past month. The coin had started trading at around $20 in September as it surged much higher into the $31.30 resistance by mid-September. From there, it dropped lower but managed to find support at $23.20 (.5 Fib), which allowed the coin to rebound.
It went on to push higher by the end of September to close the month at the $29.29 level.
In October, we can see that BNB has headed lower as it failed to break the resistance at $29.29. Today, it found support at the $26.65 level.
BNB price short term prediction: Bullish
BNB can still be considered as bullish right now. However, a drop beneath $23 would turn the market neutral. It would need to continue further beneath $18.30 to turn bearish.
If the sellers push lower, the first level of support lies at $25.60 (.5 Fib Retracement). This is followed by support at $24.78 (.618 Fib Retracement), $23.62 (.786 Fib), and $23 (100-day EMA). Added support lies at $22, $21 (.618 Fib & 200-day EMA), and $20.
Where is the resistance toward the upside?
On the other side, resistance first lies at $29.29 and $30. This is followed by resistance at $31.28, $21.73, $32.57, $33, and $35.
Previous Top/Worst performers articles
At CoinCodex, we regularly publish price analysis articles focused on the top cryptocurrencies. Here are our most recent articles about the top/worst performers:
5
0


 Manage all your crypto, NFT and DeFi from one place
Securely connect the portfolio you’re using to start.


0
0
