Sui Price Jumps 3% as It Overtakes XRP in $21M Inflows Race
0
0

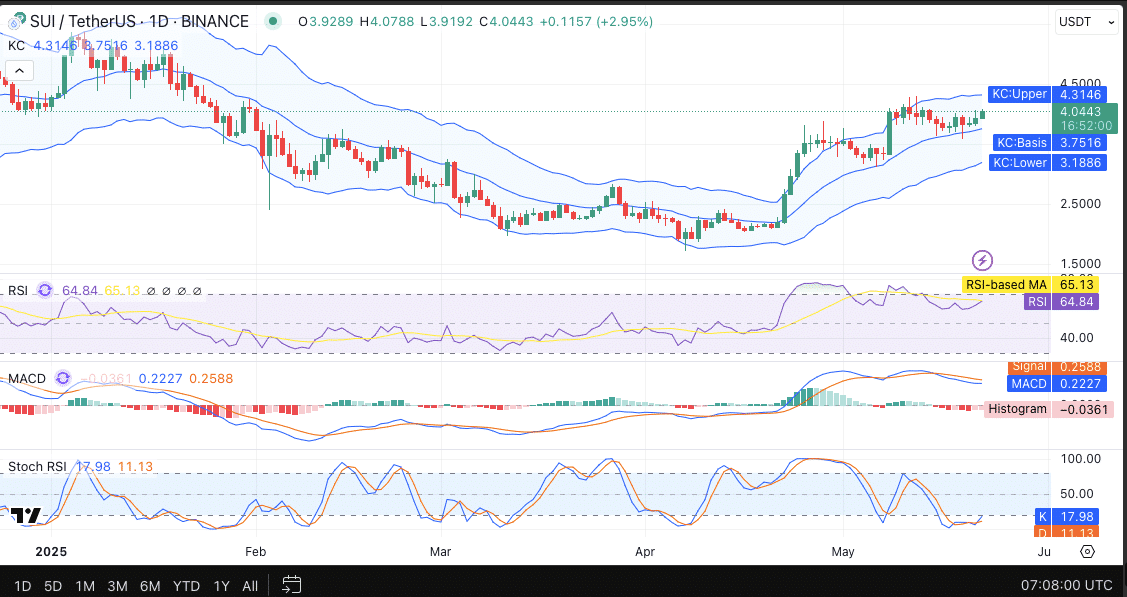
Sui price surged past $4, registering over 3% gains in the past 24 hours. The asset has officially overtaken XRP in institutional inflows, making it the top-performing non-stablecoin among the top ten cryptocurrencies. Momentum indicators support a bullish continuation as trading volume and demand remain high.

SUI Gains Strength in Institutional Markets
Sui continues its rally, with institutional capital pouring in at an accelerating rate. In the latest CoinShares report, Sui-linked products secured $21 million in inflows this month. In contrast, XRP-linked funds only attracted $8.6 million over the same period.
This marks a significant shift in investor sentiment toward Sui. Institutional players now view it as a strong competitor to older altcoins. The launch of Grayscale’s SUI Trust and 21Shares’ ETF filing further validate institutional confidence.
In weekly figures, Sui inflows nearly doubled XRP’s, reinforcing its rapid climb in investor preference. This shift could continue as more funds seek exposure to newer blockchain networks. Increased product offerings also support this trend.
Sui’s market performance reflects this capital inflow. The 24-hour chart rose 2.71%, pushing above the $4 resistance zone. Continued buying pressure suggests investors expect further growth.
SUI Price Action Shows Bullish Technical Indicators
Sui’s price held above key technical levels, confirming bullish sentiment among traders. Its RSI stands at 64.62, approaching overbought territory but still showing strong momentum. Its RSI-based moving average, at 65.11, confirms consistent upward pressure.
The Keltner Channel indicates a healthy trend, with Sui trading near the upper band at $4.3138. The basis level is $3.7507, while the lower support band is at $3.1877. This setup reflects continued strength, but caution remains near resistance.

MACD readings present a mixed yet hopeful scenario. The MACD line at 0.2220 remains just below the signal line at 0.2587. However, the narrow gap and slight negative histogram at -0.0367 suggest a potential reversal if momentum strengthens.
The Stochastic RSI is oversold at 17.50, suggesting a possible bounce. A turn upward could trigger fresh buying. This contrasts the regular RSI and hints at a short-term opportunity.
Traders appear to be watching closely for a MACD crossover. Such a shift could prompt renewed accumulation. Until then, consolidation may continue within a narrow range.
Can SUI Catch Up to Solana in Ecosystem Size?
Sui’s rise prompts comparisons with Solana, especially regarding market cap and TVL. Although still behind, momentum is building fast. To surpass Solana, Sui must dominate a high-growth niche.
Its rapid fund inflows and increased exposure position it well. However, Solana maintains stronger developer activity and a larger ecosystem. For Sui to compete, ecosystem growth must accelerate in tandem with price.
Strategic partnerships and user acquisition will be key. Emerging sectors like meme coins or NFTs could provide an edge. Without such growth, Sui may remain a strong contender, but not a leader.
| Cryptocurrency | Price (USD) |
| Sui (SUI) | $4.04 |
| XRP | $2.40 |
| Solana (SOL) | $176.09 |
FAQs
What is the current Sui price?
The current Sui price is $4.035, showing a 2.71% increase in the past 24 hours.
Why is Sui gaining institutional interest?
Sui is gaining interest due to new investment products like Grayscale’s Trust and a proposed ETF by 21Shares.
How does Sui’s inflow compare to XRP?
Sui received $21 million in institutional inflows this month, significantly higher than XRP’s $8.6 million.
What technical indicators suggest Sui’s bullish trend?
RSI is near 65 and MACD is close to a crossover, suggesting continued bullish pressure.
Can Sui surpass Solana?
It may, if it captures a trending sector or significantly expands its ecosystem and TVL.
Glossary of Key Terms
Sui Price: The current market value of the SUI token in USD.
RSI (Relative Strength Index): A momentum indicator measuring price movement strength.
MACD (Moving Average Convergence Divergence): A trend-following indicator showing the relationship between two moving averages.
Keltner Channel: A volatility-based envelope set above and below a moving average.
Institutional Inflows: Funds invested by financial institutions into specific assets.
TVL (Total Value Locked): The total value of assets locked in a blockchain’s smart contracts.
ETF (Exchange-Traded Fund): A fund traded on stock exchanges, holding assets like cryptocurrencies.
References:
Read More: Sui Price Jumps 3% as It Overtakes XRP in $21M Inflows Race">Sui Price Jumps 3% as It Overtakes XRP in $21M Inflows Race
0
0
 Manage all your crypto, NFT and DeFi from one place
Securely connect the portfolio you’re using to start.


