Is a Massive Altcoin Rally Imminent After This Golden Cross Signal?

0
0

Key Insights:
- A golden cross on TOTAL2 triggered a 245% altcoin rally in 2021, it just appeared again.
- MACD shows a bearish cross on BTC dominance, hinting at incoming capital rotation to alts.
- 224-day consolidation ends on TOTAL3, opening a new 28-day altseason pump cycle.
Altseason may be starting as new macro signals confirm a bullish setup across altcoin charts. A golden cross on the altcoin market cap, combined with a Bitcoin dominance reversal and time-based breakout structure, is fueling speculation of a coming altcoin rally.
According to analysts, this might reflect historical explosive rallies such as the 245% upswing after the 2021 Golden Cross.
Golden Cross Flashes: Altcoin Rally Echoes 2021 Setup
The altcoin rally may already be underway, triggered by a rare golden cross on the TOTAL2 chart. According to Batman, the 100-week SMA just crossed above the 200-week SMA, an event last seen in 2021 before altcoins surged 245%. This indicator is historically reliable for long-term bull moves.
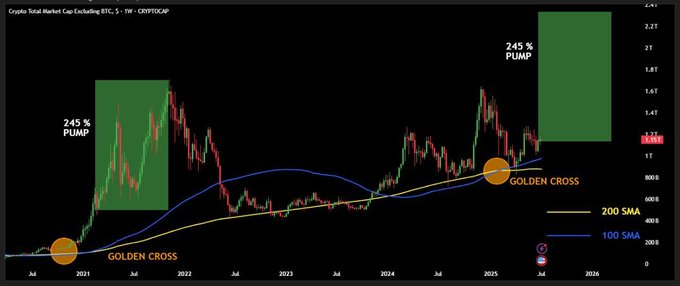
The chart also showed the altcoin market cap holding firmly above both SMAs. In technical terms, that’s a bullish confirmation. It is an indication of possible upside with a big green box that implies the pump size of a prior golden cross. With Bitcoin consolidating, the setup looks ideal for capital to rotate into alts.
Meanwhile, the long-term structure is aligning for a breakout. Moustache posted a multi-year triangle pattern formed since the 2017 peak. The altcoin market cap is now pressing against the upper boundary, suggesting breakout pressure is building.

The analysis is further supported by a rounded bottom base and the recurring horizontal rejections since 2021.
Bitcoin Dominance Reversal Points to Altcoin Rotation
Bitcoin dominance may have peaked after showing early reversal signs on the weekly chart. As shared by Bitcoinsensus, the MACD has printed a bearish crossover for the first time in months. This crossover has historically marked trend reversals from Bitcoin to altcoins.

Several red arrows in the dominance chart point to equivalent reversal points in the last two years. Every one of those has preceded a spike in altcoin prices. With Bitcoin’s dominance now slipping below its 2025 peak, the capital shift toward alts may accelerate.
This aligns well with the weakening strength in BTC price action relative to the broader market. Traders are watching this MACD shift, as it may mark the start of a new altseason cycle. If dominance keeps falling, the altcoin rally could gain serious momentum over the next few weeks.
Altseason Time Cycles Suggest July Pump
Moreover, a time-cycle chart that is common to Trader Tardigrade also enhances the bullish perspective. Using the TOTAL3 chart, which excludes BTC and ETH, the chart showed a consistent pattern of 224-day consolidations followed by 28-day altcoin pumps. Every cycle has 32 weekly candles of lateral movement followed by a vertical breakout.
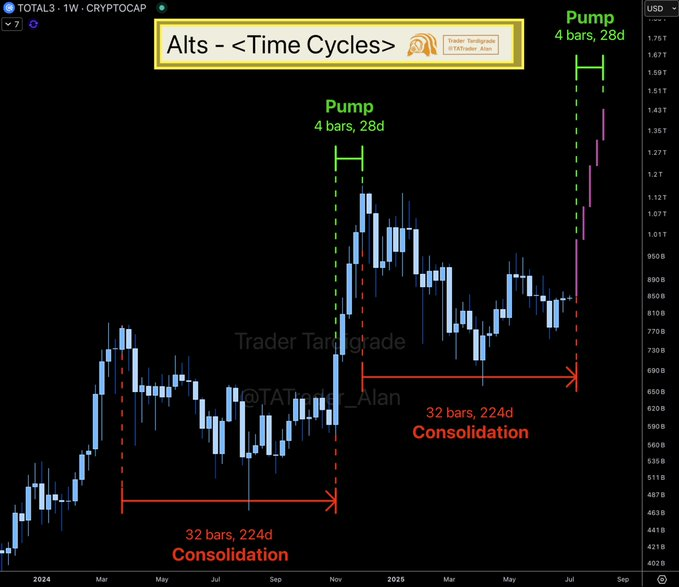
Based on the chart, the existing cycle is in the 32-bar position of its cycle. The identical structure in 2024 produced a sharp breakout that took precisely four weeks. If history repeats, the altcoin market could start pumping this week and extend through early August.
This pattern is also aligned with the formation of other charts. When several different timeframes and technical indicators align, the probability of a strong altcoin rally increases. Many traders now see this pattern as a countdown to the next major leg in the altseason wave.
Altcoin Market Cap Builds Multi-Year Breakout
Looking deeper at the chart, the altcoin market cap has completed a massive multi-year triangle. RSI momentum also broke out of a descending trendline, as shown by Moustache’s chart. This breakout is accompanied by the recent up-move through major resistance points.
Such a technical breakout tends to release months of bullish price movement. In conjunction with the golden cross and MACD reversal, the confluence is too powerful to disregard. If Bitcoin stays in range and dominance continues falling, the next altseason could exceed 2021 levels.
The post Is a Massive Altcoin Rally Imminent After This Golden Cross Signal? appeared first on The Coin Republic.
0
0


 Manage all your crypto, NFT and DeFi from one place
Securely connect the portfolio you’re using to start.


