Pi Coin Now Trades Like Any Top Meme Coin — Will Price Gains Follow?

0
0

The Pi Coin price is up 5.5% over the past week, outperforming XRP, BCH, Ton, and even Uniswap. However, the broader bearish shift has forced investors to ask questions.
A new line of thought has surfaced, putting its price behavior in the same lane as coins from a popular crypto sector; a shift that could redefine its short-term outlook.
Pi Coin Correlation Now Mirrors Meme Coin Majors
The latest monthly correlation data shows PI’s market behavior has shifted significantly. It now holds a 0.76 correlation with Dogecoin, 0.84 with Shiba Inu, 0.89 with Bonk, and 0.86 with Floki. These numbers place PI firmly inside the meme coin volatility bracket, meaning the sector’s rallies and corrections are more likely to spill over into the Pi Coin price action.
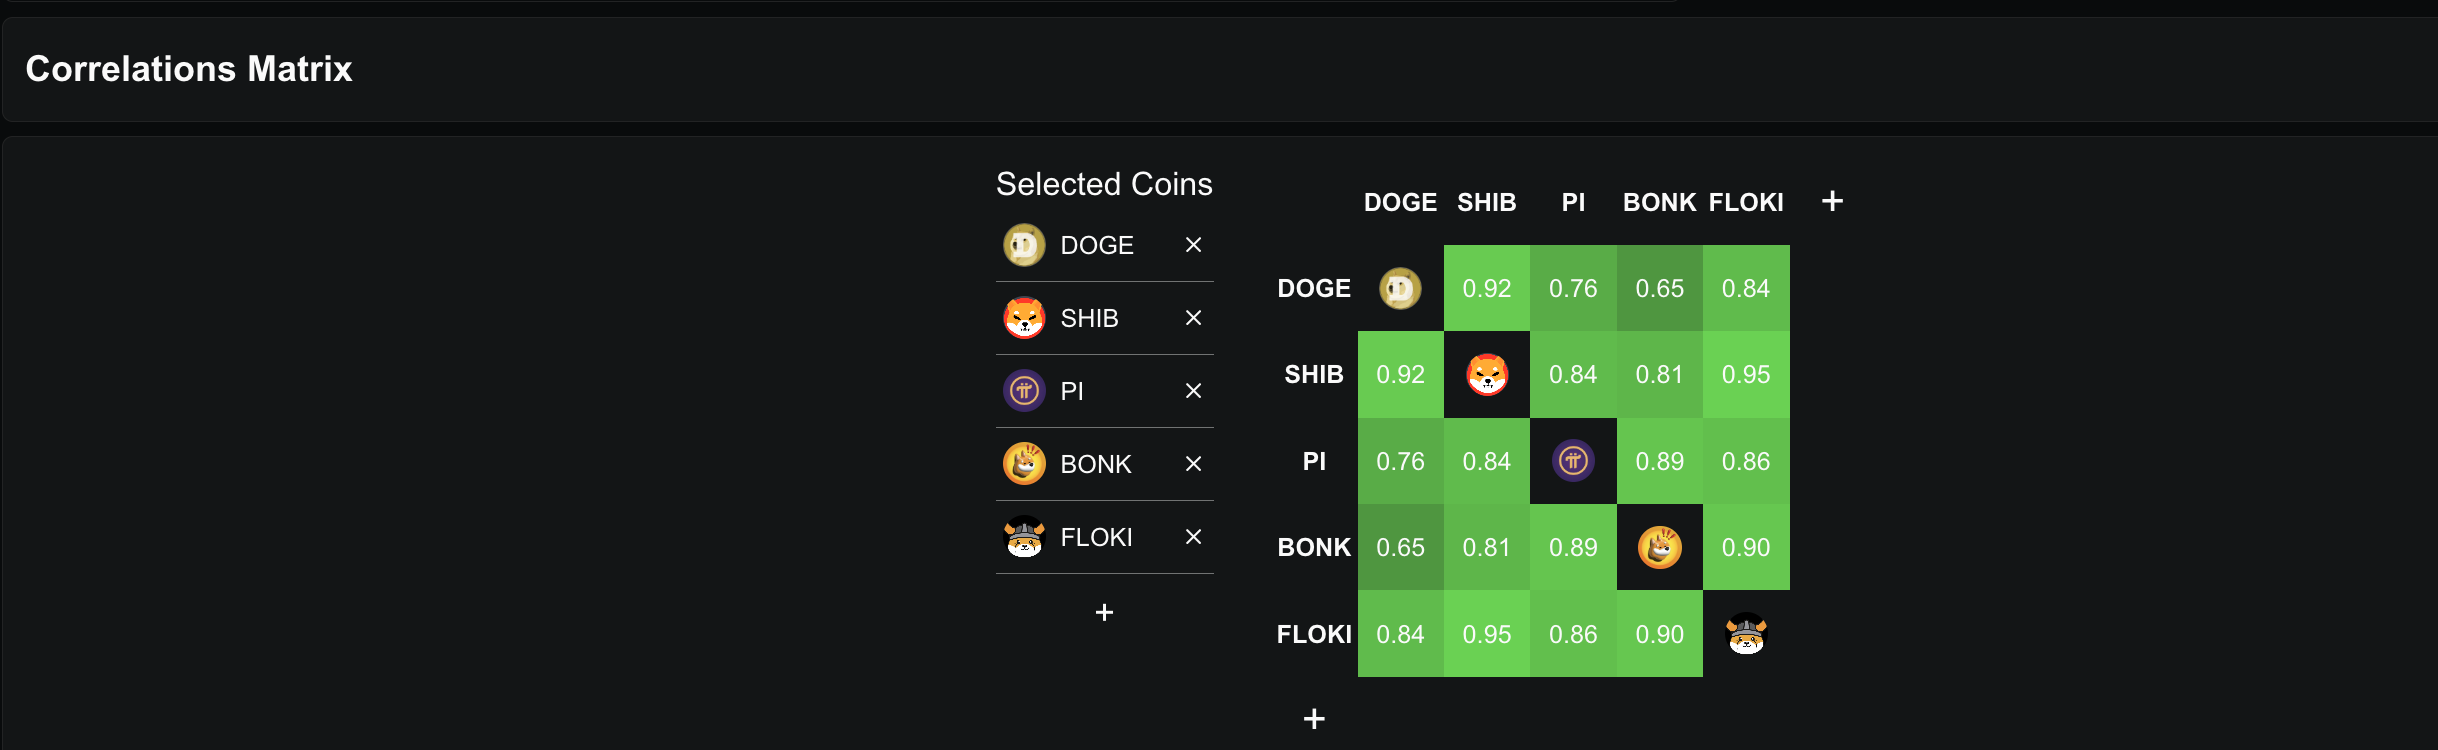 Pi Coin correlation with top meme coins: DeFillama
If meme coins start another upside run, PI could ride that momentum. Conversely, if the sector cools off, PI’s recent alignment means it could quickly follow them lower, making meme coin sentiment the most important short-term driver for Pi Coin’s direction.
A Pearson Correlation Matrix is a table that shows how strongly different variables move in relation to each other, using Pearson’s correlation coefficient values between -1 and +1. A value close to +1 means two variables move in the same direction most of the time, a value close to -1 means they move in opposite directions, and a value near zero means there is little to no linear relationship. In crypto analysis, it’s often used to measure how closely a coin’s price changes track with or diverges from other coins over a set period.
For token TA and market updates: Want more token insights like this? Sign up for Editor Harsh Notariya’s Daily Crypto Newsletter here.
Technical Risk Builds on the 4-Hour Chart
Pi Coin’s rising correlation with leading meme coins means it might now be more exposed to sector-wide moves. Over the past few days, the meme coin market has been under pressure, and if this weakness persists, Pi Coin could be dragged lower in tandem.
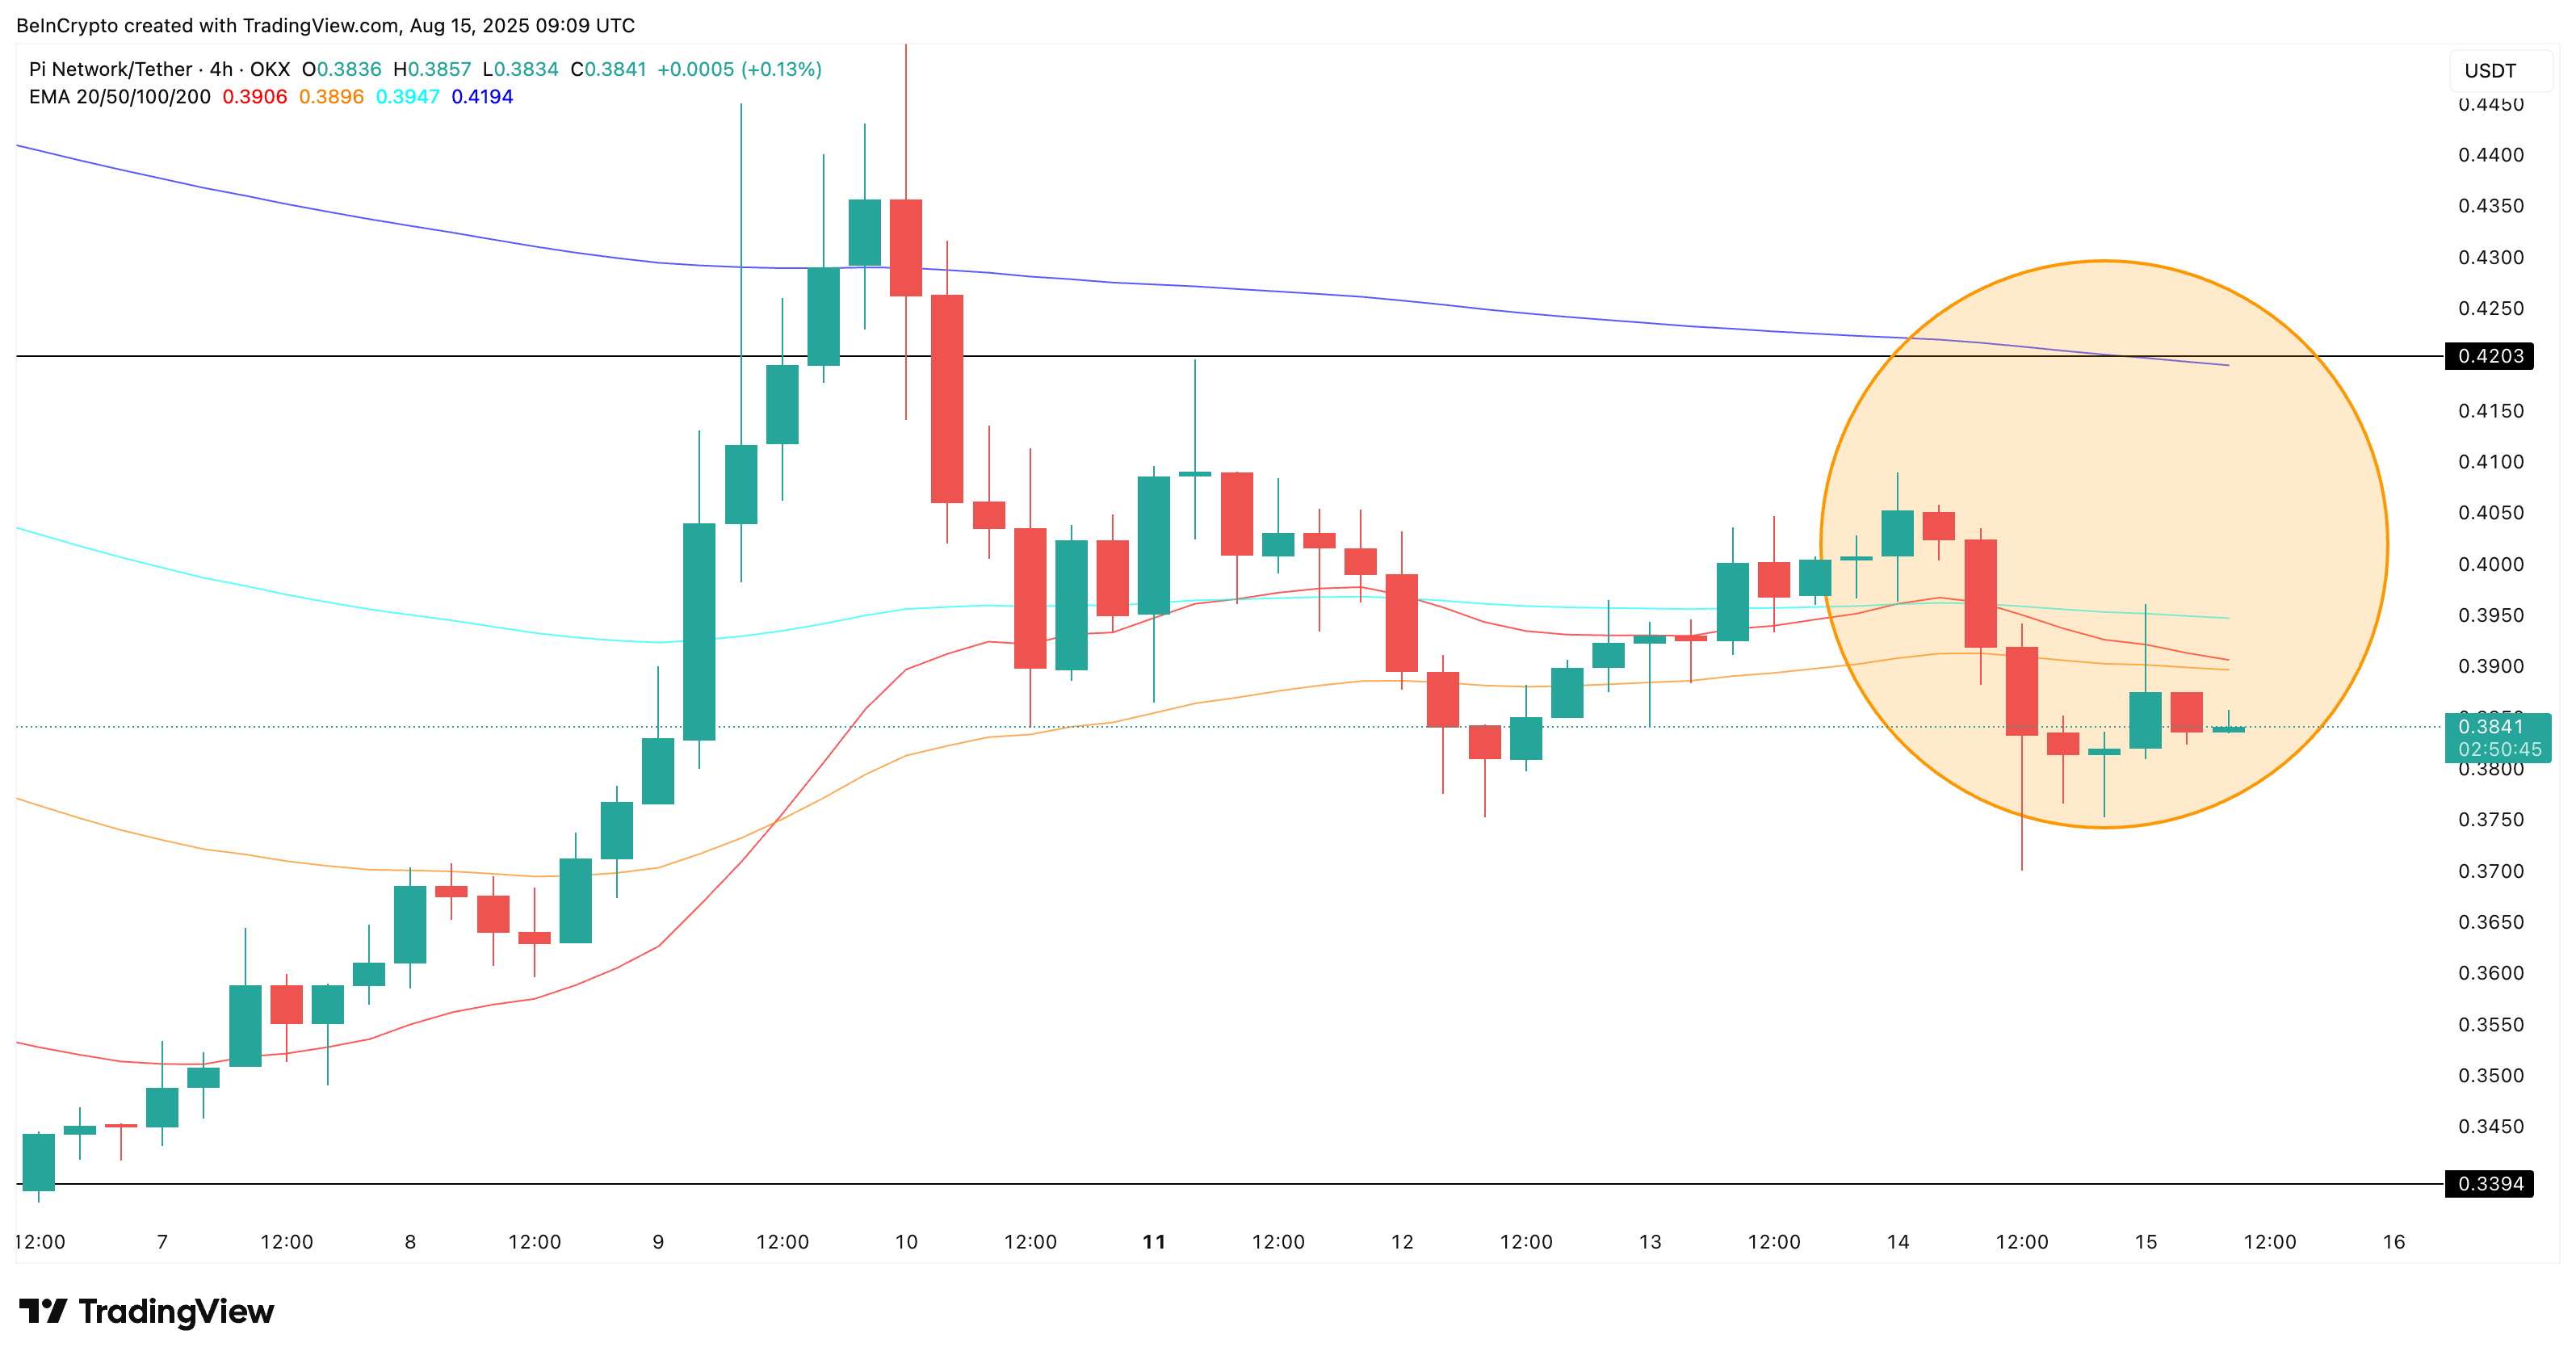 Looming Pi Coin death crossover: TradingView
On the 4-hour chart, the 20-period EMA or Exponential Moving Average (orange line) is edging closer to crossing below the 50-period EMA (red line); a pattern known as a death crossover. If this crossover confirms while meme coin sentiment remains negative, it could accelerate selling pressure and deepen the current correction.
An Exponential Moving Average (EMA) is a type of moving average that gives more weight to recent price data, making it more responsive to short-term price movements compared to a Simple Moving Average (SMA).
Pi Coin Price Action Holds a Bullish Divergence Setup
The Pi Coin- Meme Coin link means any recovery in that space could spill over into PI’s price action.
On the daily chart, the token shows a clear bullish RSI divergence; price has made a lower high, but RSI has printed a higher high. RSI is holding near 43.71, and a push above 47 would confirm a fresh higher high, strengthening the bullish case.
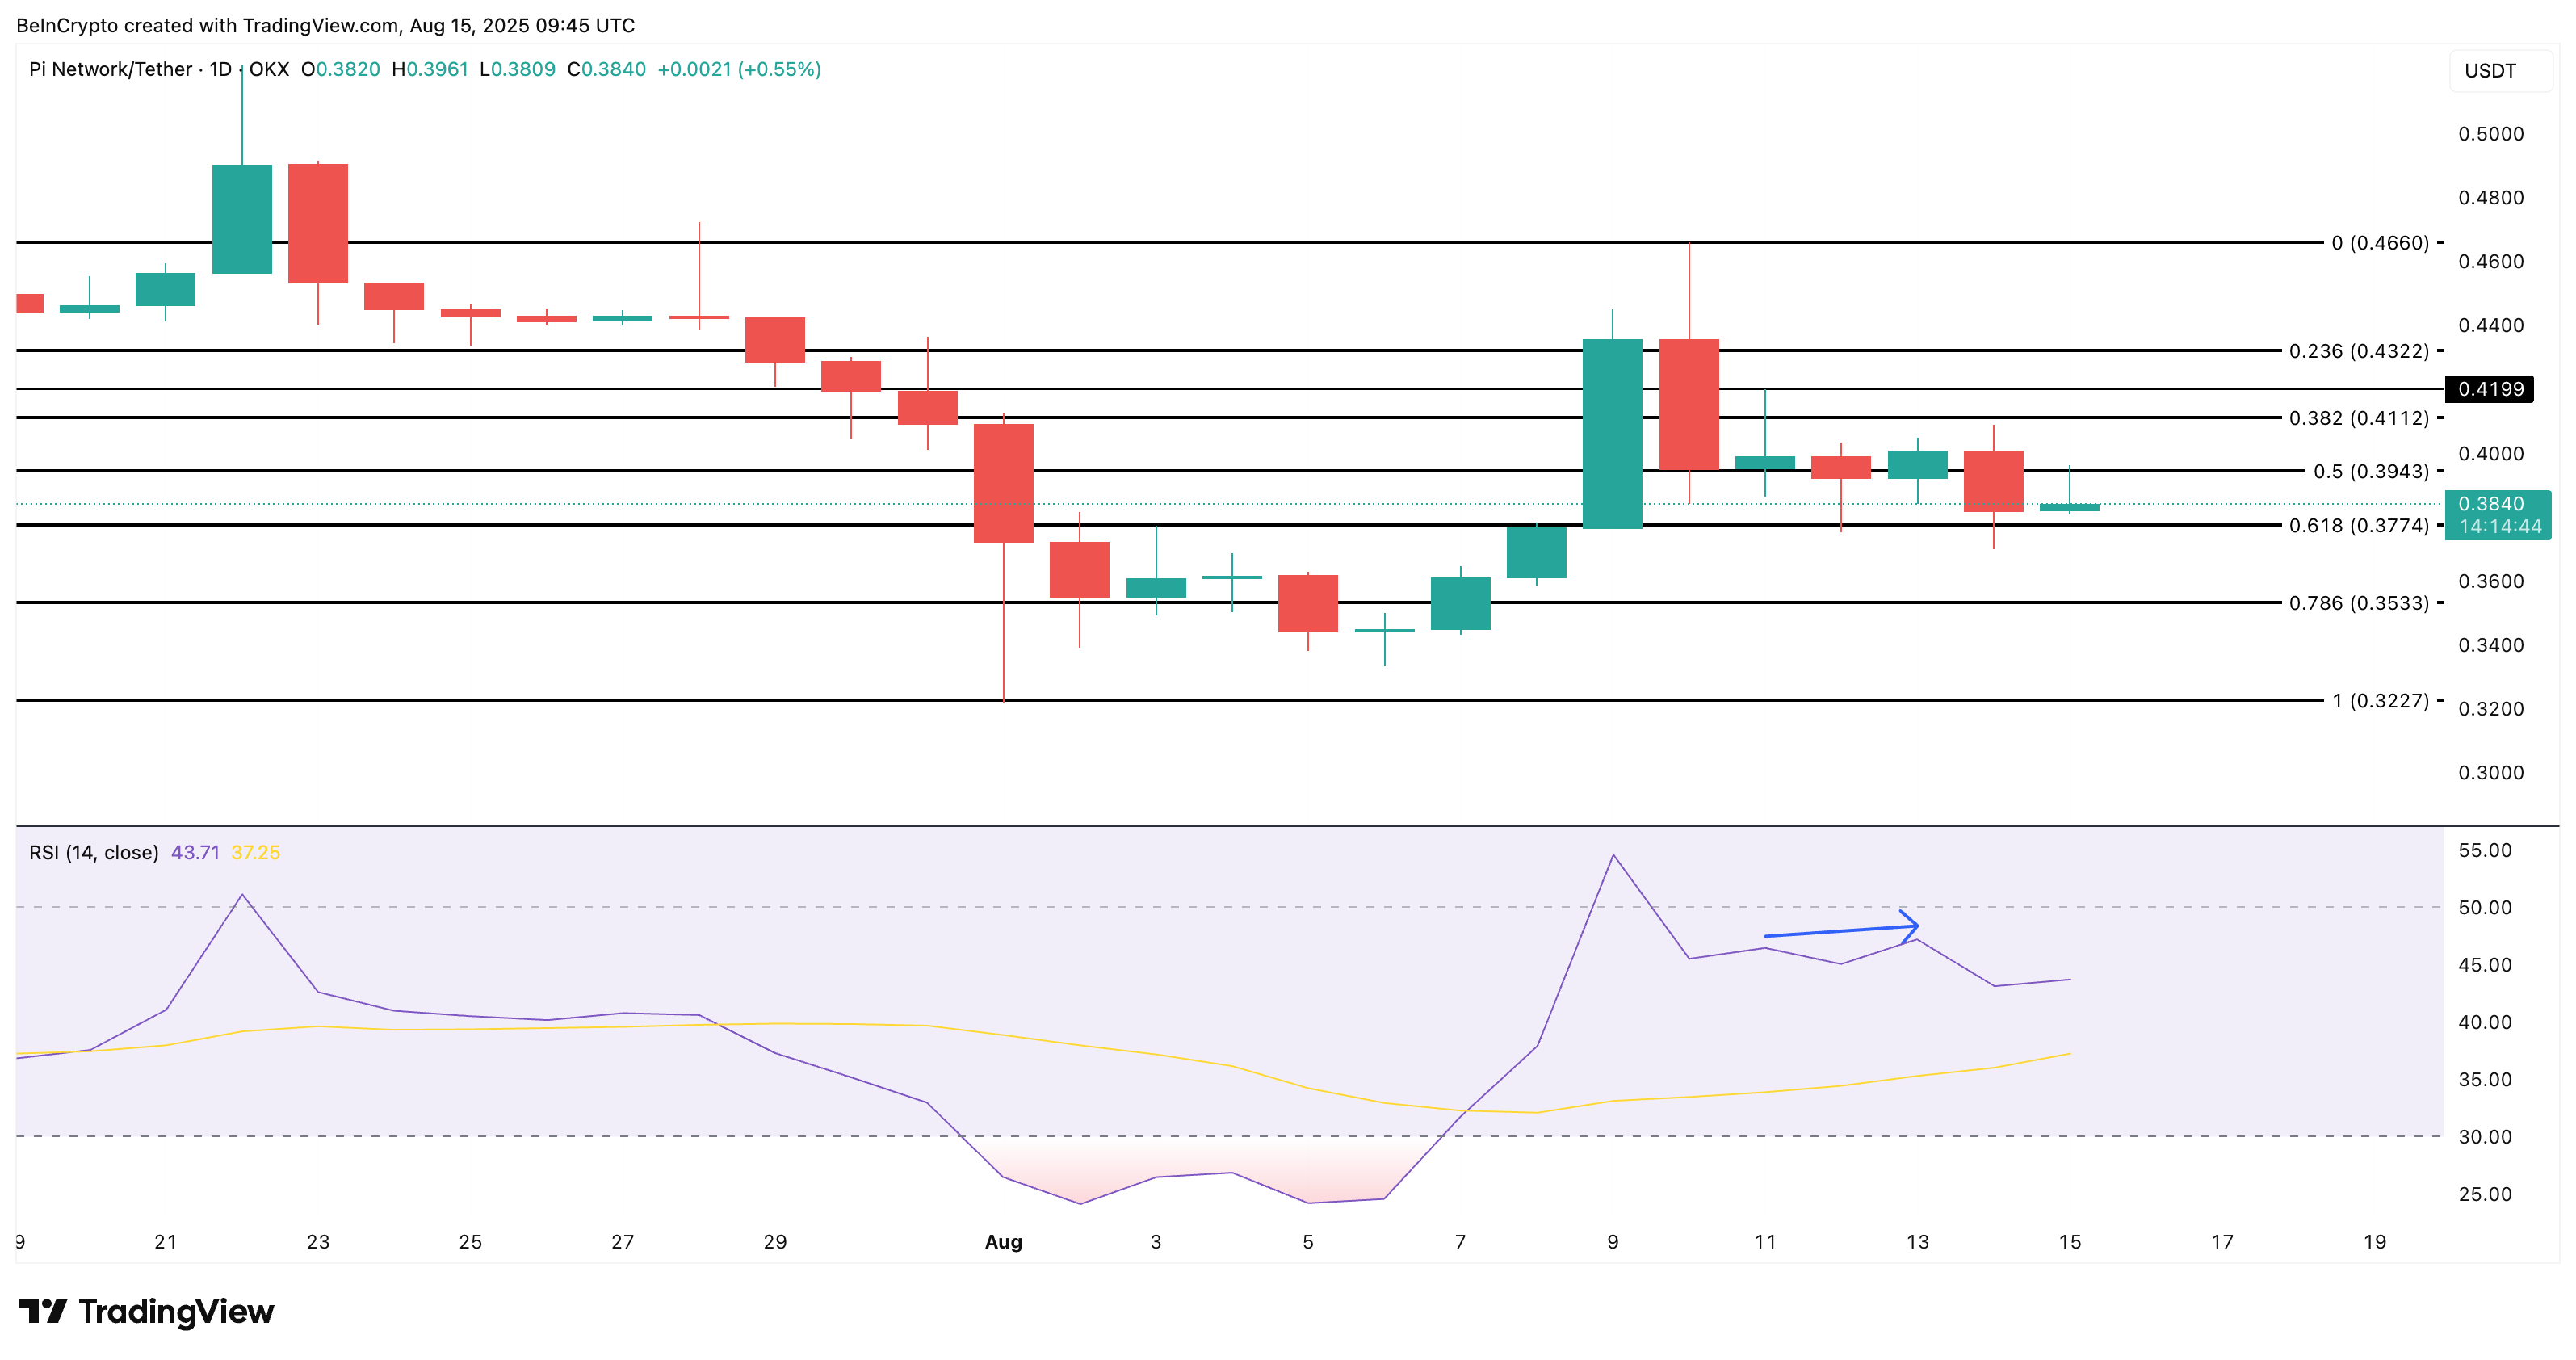 Pi Coin price analysis: TradingView
If meme coins stage a rebound, that momentum could be the missing trigger for the Pi Coin. That could help PI reclaim $0.39 and retest $0.41–$0.43. Until then, the setup remains unconfirmed, and the 4-hour death cross risk still shadows the chart.
A breakdown under $0.37 would not just invalidate the divergence but also make Pi coin more vulnerable. More so if the correlated sector continues to bleed. The price chart still has a semblance of bullishness. But the sector trend will decide whether that edge turns into a breakout or fades with the rest of the market.
0
0


 Manage all your crypto, NFT and DeFi from one place
Securely connect the portfolio you’re using to start.

0
0

0
0

0
0
