
B3 Base Price Prediction: Fake Breakdown, $0.00047 Support: What Next?

0
0

B3 is heating up, and traders can't stop watching what happens next. The token has been sliding for a week straight, and the pressure is building fast on where it lands.
This B3 Base Price Prediction breaks down exactly what's driving the drop, what the liquidation data is showing, and the levels that matter most from here through 2026.B3 is the native token of a Layer 3 gaming blockchain built on top of Base, Coinbase's popular Ethereum Layer 2 network.
Developed to power on-chain gaming, B3 lets game studios build fast, low-cost, fully on-chain games without forcing players to juggle wallets or bridges. Stay till the end; there's key info here that could shape your next move.
B3 Base coin price: $BASE Price Overview
| Metric | Value |
| Current Price | $0.0005488 |
| 7-Day Change | -11.4% |
| 24H Range | $0.0005469 – $0.0006163 |
| Market Cap | $25.466M |
| Fully Diluted Valuation | $54.846M |
| 24H Trading Volume | $10.971M |
| Circulating Supply | 46.432B $B3 |
| Total Supply | 100B $B3 |
| Max Supply | 100B $B3 |
Source: Data From CoinGecko
B3's fully diluted valuation of $54.846M sits more than double its current market cap of $25.466M, since less than half of the 100B max supply is in circulation.
This gap is worth watching in any long-term B3 crypto price prediction, as future unlocks could add sell-side pressure.
B3 Base Price Prediction, $BASE Liquidation Data and Exchange Volume
Liquidation data shows the market has been almost entirely punishing long positions, a sign of sustained downside pressure:
Longs have been liquidated roughly 16x more than shorts over the past 24 hours, confirming that leveraged traders betting on a bounce have repeatedly been caught offside as B3 continues to slide.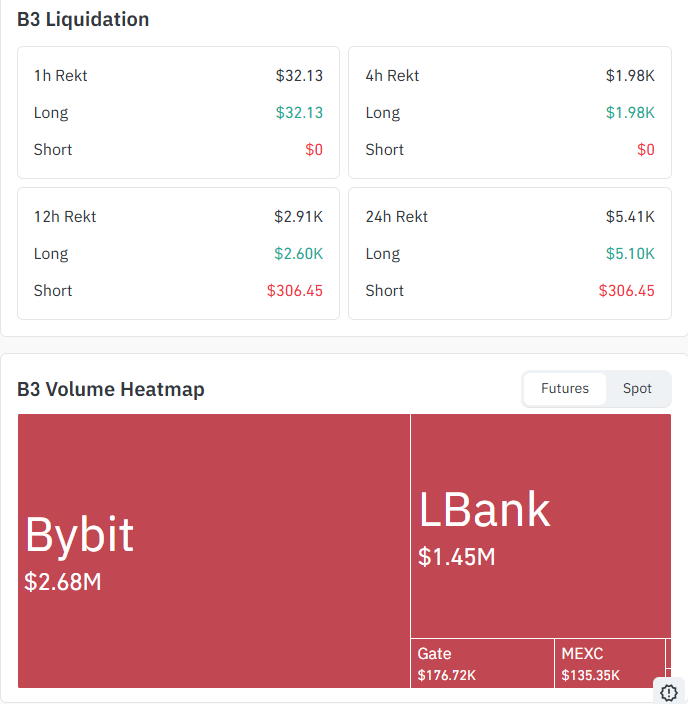
| Timeframe | Long Liquidated | Short Liquidated |
| 1H | $32.13 | $0 |
| 4H | $1.98K | $0 |
| 12H | $2.60K | $306.45 |
| 24H | $5.10K | $306.45 |
On the futures side, trading activity is concentrated on Bybit ($2.68M) and LBank ($1.45M), with smaller volume on Gate ($176.72K) and MEXC ($135.35K).
This heavy skew toward a couple of exchanges means volatility can be amplified quickly if a large position gets liquidated on either venue.
B3 Base Price Prediction: BASE Technical Analysis: Hourly Chart
The 1H chart tells the real story behind this B3 price forecast. After a sharp pump into the mid-$0.00068 region, B3 reached out and tried to trap it by giving a fake breakdown of the falling channel.
The price has been trading inside a well-defined descending channel since July 16.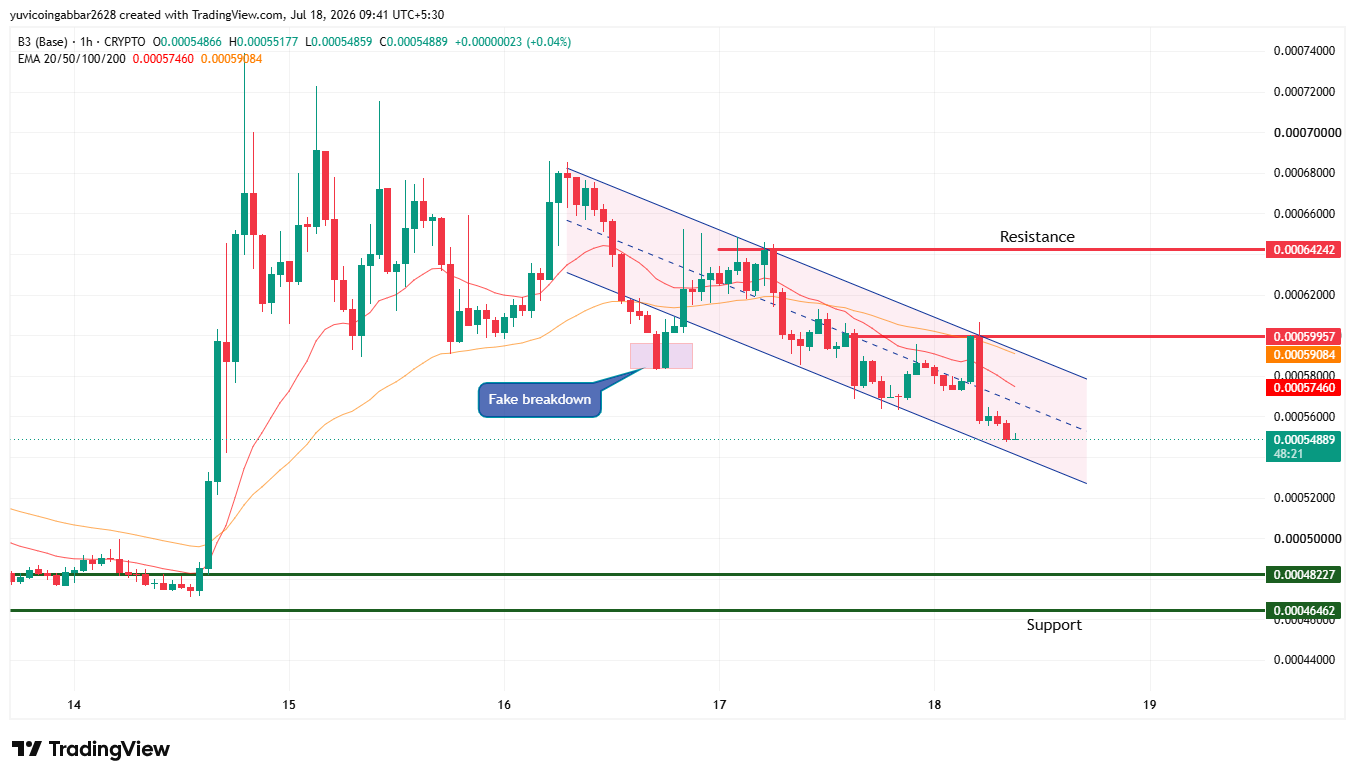
Key observations:
Resistance: $0.00064242 marks the upper boundary rejection zone, with an immediate resistance at $0.00059957 sitting right at the channel's upper edge currently.
Fake Breakdown: The price briefly broke below the channel's lower boundary before quickly reclaiming it, a classic fake breakdown that trapped early short-sellers and set up a temporary relief move back toward the channel.
Current Position: B3 is now back at the lower edge of the descending channel, trading at $0.0005488, meaning the fake breakdown's bounce has already faded.
Support: Below the channel, the next demand zones sit at $0.00048227 and $0.00046462.
EMA Crossover on the 1H Chart
The 20 & 50 EMA is reading 0.00057460 and 0.00059084, both well above the current price of $0.0005488.
Price trading beneath every EMA in the stack confirms the shorter-term EMAs have crossed below the longer-term ones, flipping the EMA ribbon into a bearish pattern.
This EMA crossover is now acting as a dynamic resistance zone overhead, meaning any bounce toward $0.00057–$0.00059 is likely to face selling pressure unless volume picks up meaningfully.
Until B3 can close back above this EMA cluster on the hourly chart, the path of least resistance stays down toward the channel's support boundaries.
B3 Technical Analysis: Daily Chart (Pump and Dump Structure)
Zooming out to the daily chart shows the full lifecycle of this move and gives a clearer picture for a B3 price prediction 2026 outlook.
The daily chart shows a pump-and-dump: an explosive vertical rally in early May followed by a steep, sustained decline through a falling channel into June.
Since then, B3 has been consolidating and base-building between the range of $0.00047 and $0.00065, with the current sell-off pushing the price back toward the lower half of that range.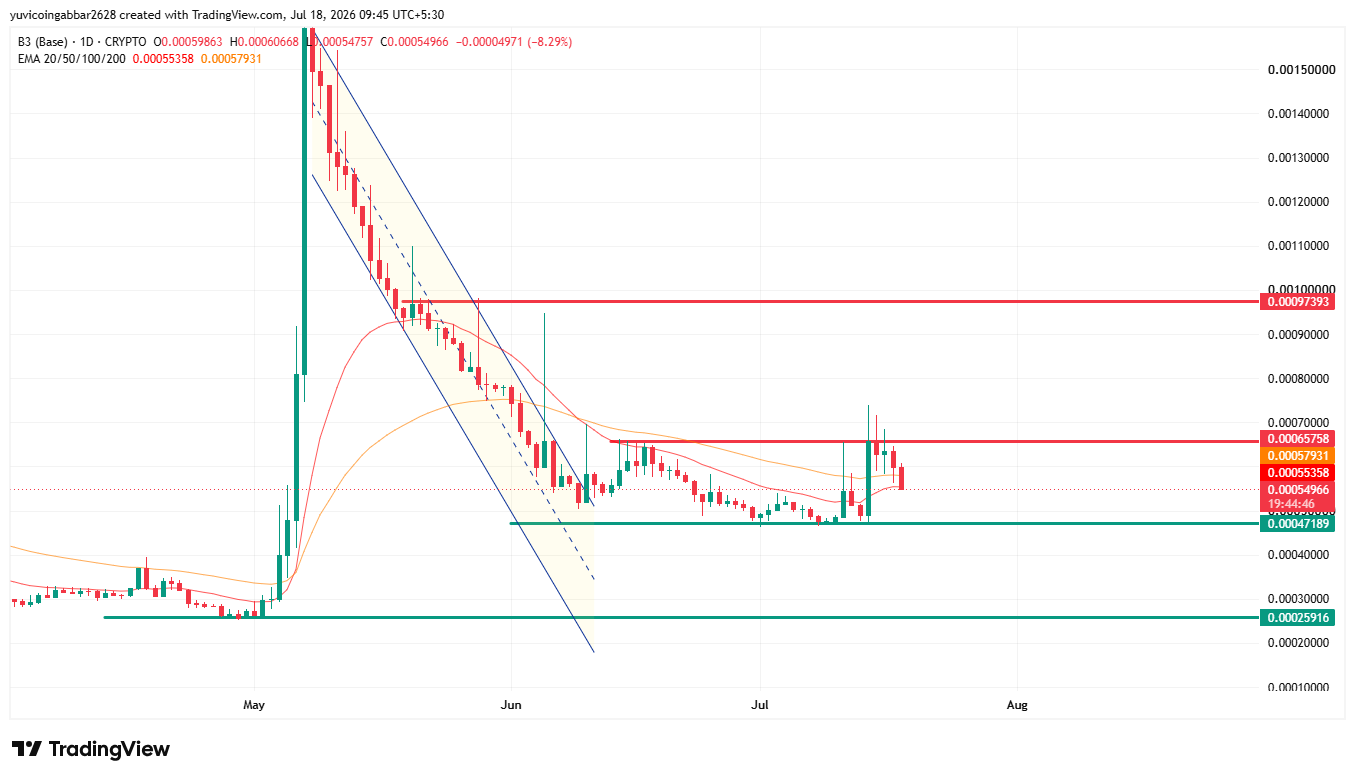
Both daily 20 & 50 EMAs ($0.00055358 and $0.00057931) sit just above spot price, confirming the same bearish-lean structure seen on the hourly chart.
A daily close back above the 50 EMA would be the first real signal that momentum is shifting.
| Level Type | Price | Significance |
| Major Resistance | $0.00097393 | Post-pump distribution zone |
| Resistance | $0.00065758 | Recent local high / supply zone |
| EMA Resistance | $0.00057931 | Longer-term 50 EMA (Change With Time) |
| Support | $0.00047189 | Base-building zone |
| Major Support | $0.00025916 | Pre-pump base / long-term floor |
B3 Price Prediction: What Next?
Putting the hourly and daily structure together, here's how the B3 token price prediction shapes up across different scenarios:
Short-Term (Days)
With the price sitting at the lower boundary of the descending channel and the fake-breakdown bounce already exhausted, B3 is vulnerable to a retest of $0.00048227 first and potentially $0.00046462 if that level fails.
A bounce here would need to reclaim $0.00059957 to invalidate the current bearish channel structure.
Medium-Term (Weeks)
A sustained move back above the EMA cluster on both the 1H and daily timeframes would be needed to shift market sentiment.
Until then, B3's price target for the medium term likely stays capped between the $0.00047 support base and $0.00066 resistance shelf—essentially the same range it has spent the last several weeks consolidating in.
Long-Term (2026 Outlook)
For a longer-horizon B3 future price view, the $0.00047189–$0.00025916 zone represents the broader macro support built before the pump. As long as this zone holds on daily closes, the base-building thesis stays intact.
A break of major resistance at $0.00065758, followed by a reclaim of $0.00097393, would be needed to reignite a longer-term bullish structure; failing that, B3 likely continues ranging until circulating supply, unlock schedules, and broader market conditions shift.
B3 Base Price Prediction Expert View
According to CoinGabbar analysts , the setup leans bearish for now. Both the hourly and daily EMAs sit above spot price, and longs have absorbed nearly all recent liquidations, a sign leveraged buyers keep getting caught on the wrong side.
The bear trigger is a daily close below $0.00047189. The bull trigger is a reclaim of the $0.00057931 to $0.00059957 EMA cluster.
Until one of those breaks, B3 stays range-bound between its base-building support and the pump's resistance shelf.
Disclaimer: This article is for informational purposes only and does not constitute financial advice. Cryptocurrency markets are highly volatile — always do your own research before making investment decisions.
0
0
 Manage all your crypto, NFT and DeFi from one place
Securely connect the portfolio you’re using to start.