Is a Breakout Looming for Solana Price Amid Bullish Signals?

0
0

Solana price action is nearing a decisive moment as technical indicators and on-chain data converge. Recent trends hint at the possibility of a reversal after enjoying a relatively low volatility and high decentralised trading period.
Solana Price Potential Surge Based on Bollinger Bands
On the 4-hour chart, Solana (SOL) price is in a squeeze Bollinger Bands formation. Notably, this technical formation occurs when price volatility contracts sharply, leading to a tightening of the bands around the asset’s trading range. As pointed out by analyst Ali Martinez, this pattern indicated a consolidation phase as SOL oscillated in the range of $144 to $150.

Historically, such contractions are quite bullish and often accompanied by a significant increase in the price. The bands have tightened relative to the immediate previous sessions, a formation that the analyst referred to as a potential breakout zone.
However, the direction of the move remained uncertain until a clear breakout of a resistance or a support line was made on high volume. The key resistance is at $151, while the support sits at $144.
Solana Surpasses Combined Volume of Seven Major Blockchains
More so, the 24-hour blockchain activity trackers revealed that Solana transacted $3.069 billion DEX in a single day. This figure is higher than the sum total of Base, BSC, Sui, Unichain, Arbitrum, Tron, and Hyperliquid for the same period. It also places Solana at the top of all blockchains for daily DEX transactions.

Consequently, the high total transaction count indicated the regular use of several Solana-based applications. Additionally, it may indicate traders’ growing attention to meme-based, NFT, or DeFi assets that often cause short-term fluctuations in prices.
Conversely, while Ethereum recorded $1.471 billion in the same timeframe, it maintained a higher total value locked (TVL), showing differing usage models between the chains.
Market Share Grows as Weekly Volume Trends Upward
Meanwhile, Solana crypto now constitutes 36.7% of daily DEX trading volume in the market. It leads Ethereum and other competitors by a wide margin in terms of trade volume relative to activity, with only 2.521 billion in total value locked compared to Ethereum’s 7.703 billion. The relationship between the TVL and the trading volume means that Solana is still appealing to fast-paced trading activity.
Solana weekly percentage change in DEX volumes is 44.47%, indicating a notable rise. Higher trading volumes are well aligned with increased developer activity and, therefore, increased user engagement in the ecosystem. In combination with the tightening of the Bollinger Bands, this increase becomes the basis for expectations of an imminent price surge.
ETF Approval Probability Support Potential Price Shift
Moreover, Solana and Litecoin currently lead among spot crypto ETF filings with a 90% approval probability in 2025, according to Bloomberg Intelligence. These strong odds, alongside filings from major asset managers, reinforce institutional confidence in both assets.
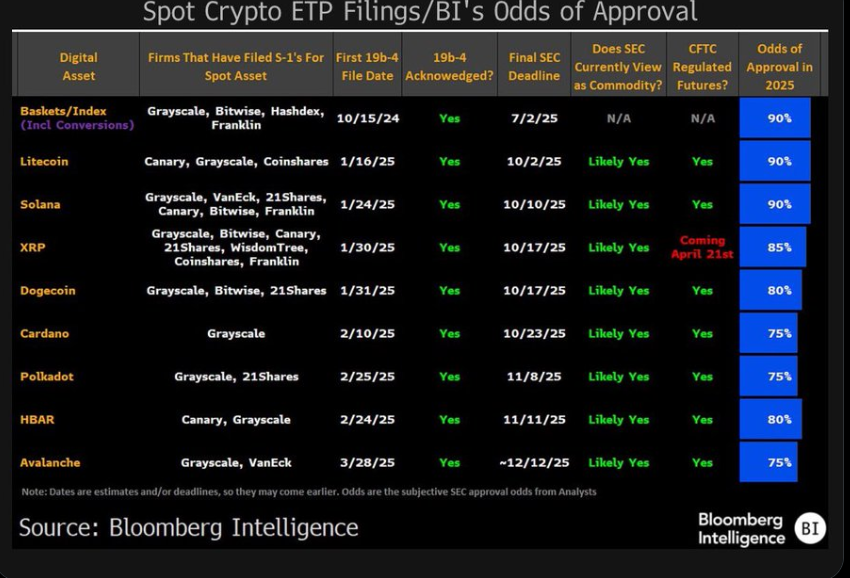
For Solana, the anticipation of ETF approval adds to bullish momentum, potentially attracting long-term capital inflows. If approved, this could catalyze a sustained SOL price rally as investor exposure expands through regulated financial products.
Further on Solana price prediction, recent analysis showed a textbook cup and handle pattern forming on the weekly chart, with resistance near $220. This setup suggested a potential bullish continuation if a breakout occurs. Trading volume increased, supporting the pattern’s credibility.
However, short-term charts showed a rising wedge and head and shoulders formation, indicating possible pullbacks to the $131 zone before any long-term rally toward the $400–$600 range.
The post Is a Breakout Looming for Solana Price Amid Bullish Signals? appeared first on The Coin Republic.
0
0

 Manage all your crypto, NFT and DeFi from one place
Securely connect the portfolio you’re using to start.


0
0
