Should You Buy Stellar (XLM) For April 2025?

0
0

Stellar (XLM) is up 11% over the past seven days, bringing its market cap to nearly $9 billion as bullish momentum continues to build. After a period of consolidation, recent indicators suggest that XLM may be preparing for another move higher.
While technicals like RSI and DMI reflect growing buyer strength, the price has yet to enter the overbought territory, signaling potential room for further upside.
XLM RSI Paints A Bullish Picture
Stellar’s Relative Strength Index (RSI) is currently at 63.42, showing a strong rise from 44.21 just three days ago. The indicator has been holding above 55 since yesterday, suggesting a notable shift in momentum toward bullish territory.
This recent increase points to growing buying interest, potentially positioning Stellar for a breakout if momentum continues building.
However, despite the upward move, it’s worth noting that Stellar’s RSI has not crossed the 70 mark since March 2. This indicates that while buyers are active, the asset hasn’t entered overbought or high-momentum conditions in nearly a month.
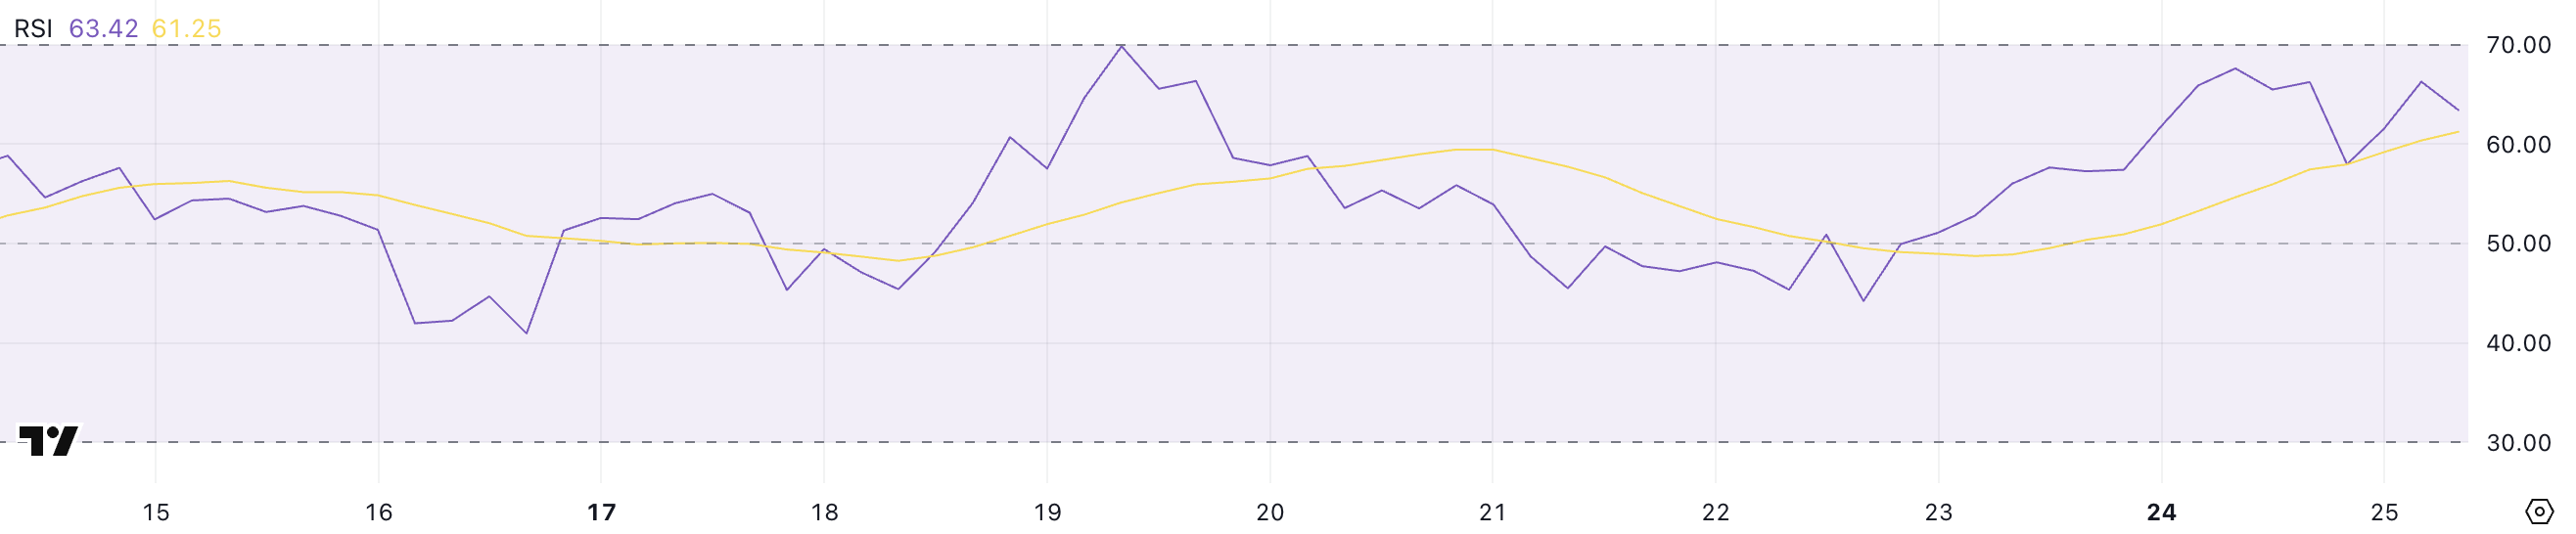 XLM RSI. Source: TradingView.
RSI, or Relative Strength Index, is a momentum oscillator that measures the speed and magnitude of recent price changes to assess overbought or oversold conditions.
The RSI scale ranges from 0 to 100, with values above 70 indicating that an asset may be overbought and due for a correction, and readings below 30 signaling oversold conditions and potential for a rebound. Typically, values between 50 and 70 suggest moderate bullish momentum, while 30 to 50 means bearish.
With XLM’s RSI now at 63.42, the trend appears positive, but the failure to breach 70 since early March could imply a cautious market still waiting for stronger conviction before pushing higher.
Stellar DMI Shows Buyers Are In Full Control
Stellar’s DMI (Directional Movement Index) chart shows that its ADX is currently at 30.63, up sharply from 16.2 just two days ago.
This significant rise in the ADX suggests that a trend is strengthening, confirming that the current price move—whether up or down—is gaining momentum. At the same time, the +DI line, which tracks bullish pressure, is at 21.77, slightly down from 24.5 yesterday, while the -DI line, which reflects bearish pressure, has also declined from 8.65 to 7.34.
Despite the slight dip in buying strength, the wide gap between the +DI and -DI lines still favors the bulls, indicating that the ongoing trend is upward, though possibly cooling off in intensity.
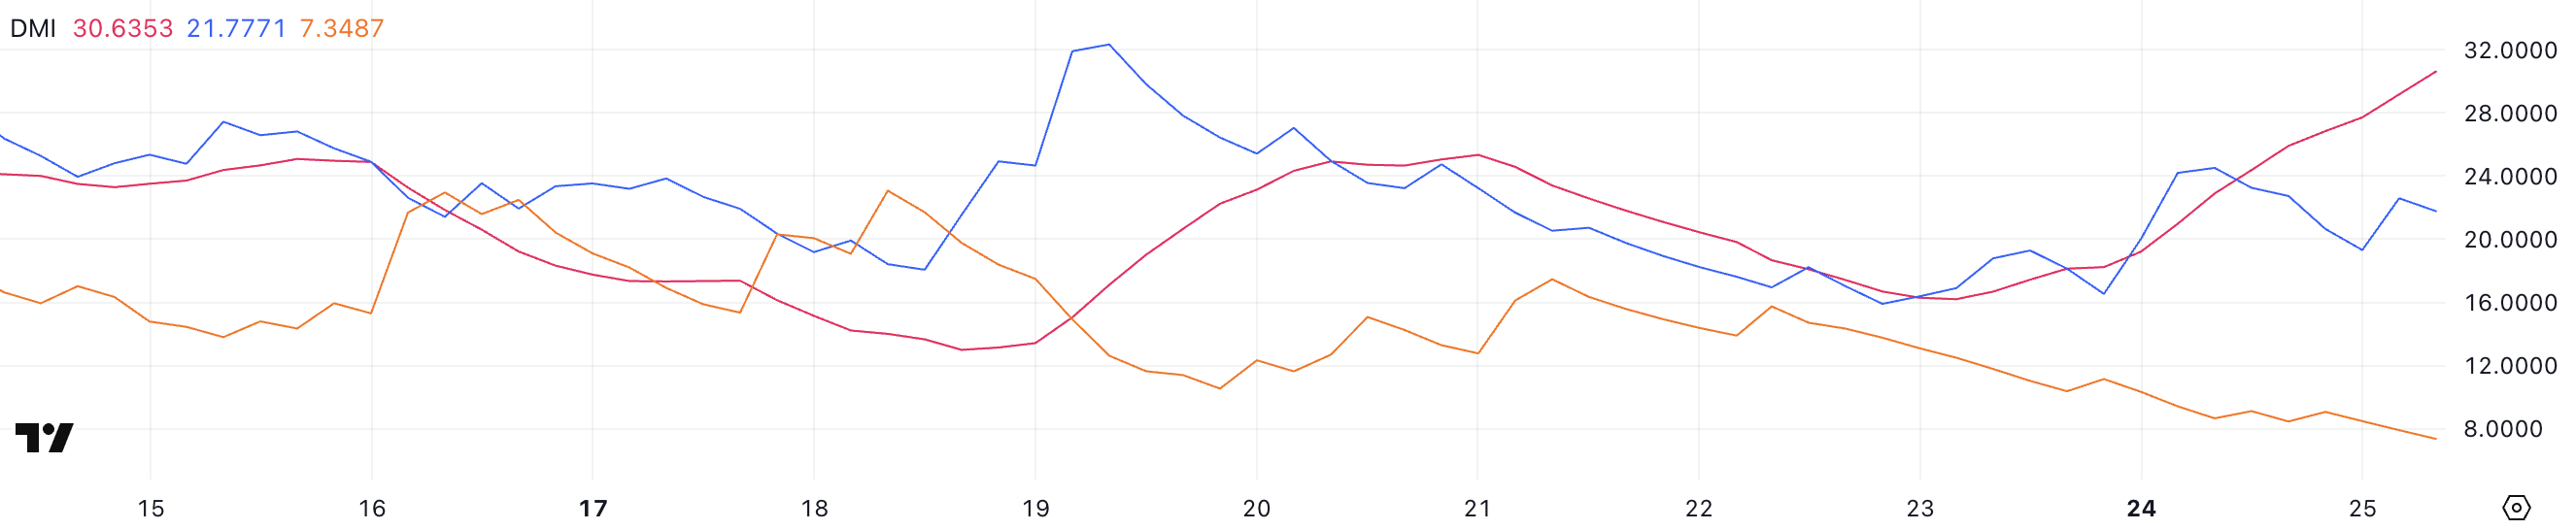 XLM DMI. Source: TradingView.
The ADX, or Average Directional Index, is a component of the DMI system and is used to quantify trend strength regardless of direction. Readings below 20 typically indicate a weak or non-existent trend, while values above 25 suggest a strengthening trend and those above 30 confirm a strong one.
The +DI and -DI lines, on the other hand, help determine the direction of that trend—whichever is higher indicates whether buyers (+DI) or sellers (-DI) are in control.
With ADX rising above 30 and +DI comfortably above -DI, Stellar appears to be in a solid uptrend. However, the recent dip in +DI may be an early sign of fading momentum, making the next few days crucial for confirming whether bulls can sustain control.
Can XLM Break Above $0.40 In April?
Stellar’s EMA lines are showing signs of a potential surge, with short-term moving averages nearing a crossover above longer-term lines.
If this crossover materializes, it will form a bullish “golden cross” pattern, often seen as a strong signal for upward continuation.
This technical setup could allow Stellar price to push higher toward the $0.30 level, with additional upside targets around $0.349 and $0.375 if momentum accelerates. This would potentially pave the way for a rise above $0.40 in April.
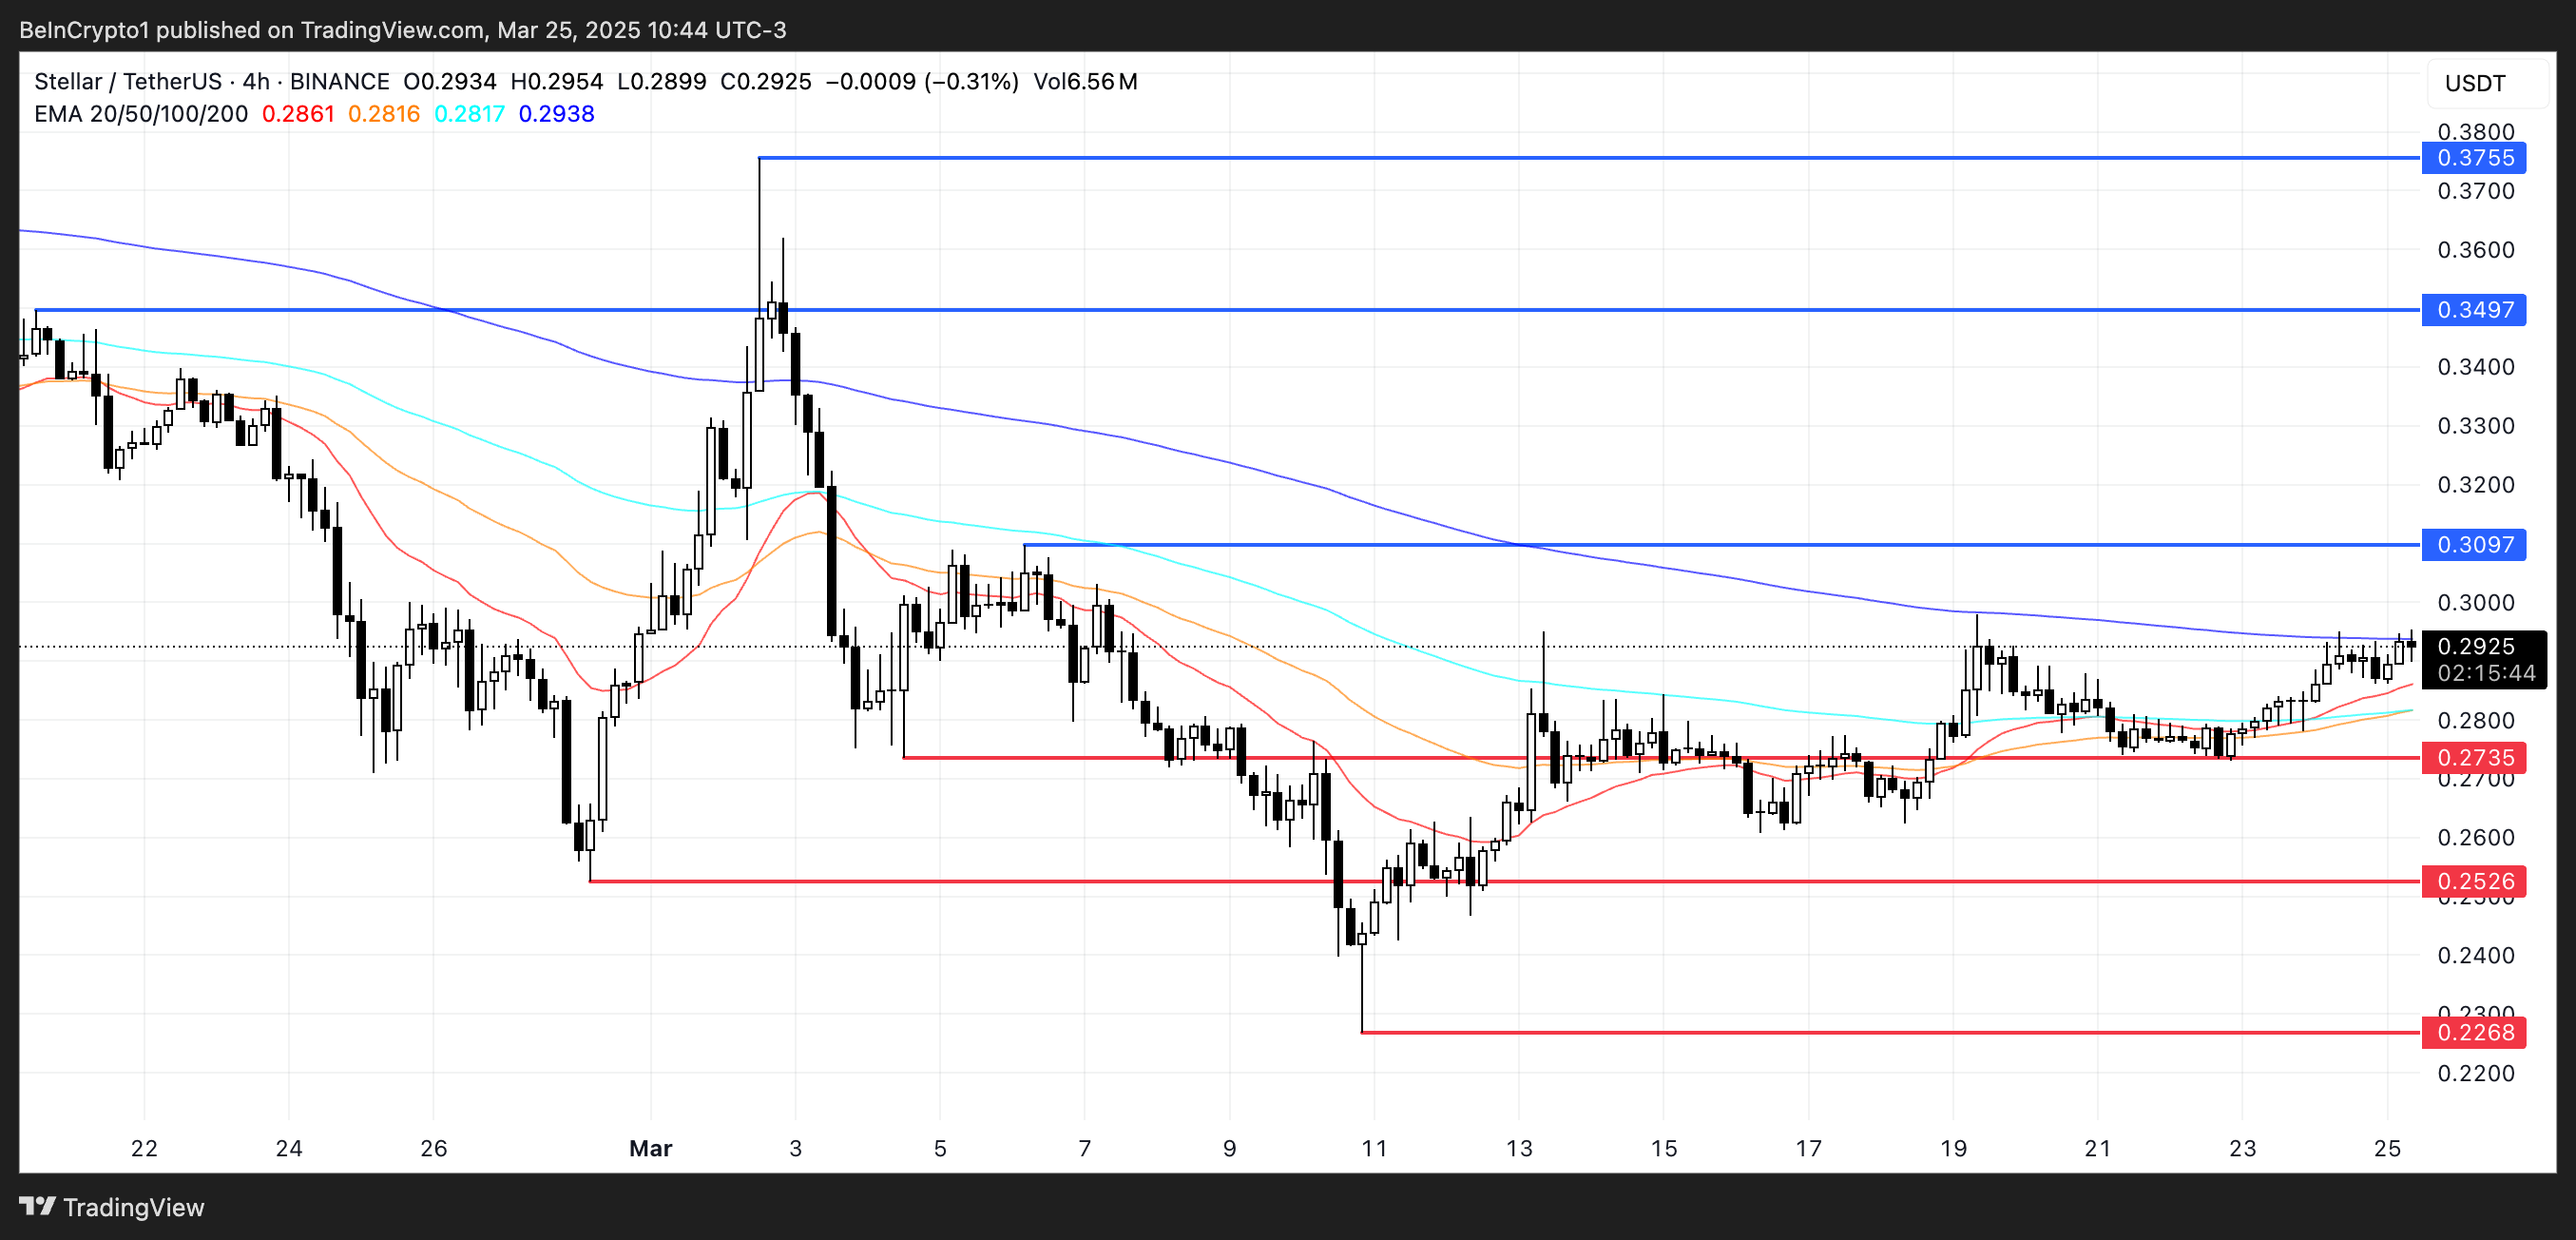 XLM Price Analysis. Source: TradingView.
The convergence of these EMAs suggests building bullish pressure, which, if confirmed by price action, may soon result in a breakout.
However, if the expected golden cross fails to materialize and instead a downtrend takes shape, Stellar may find itself testing the support level around $0.27.
A break below that support could trigger further declines toward $0.25, and if selling intensifies, even as low as $0.22.
0
0


 Manage all your crypto, NFT and DeFi from one place
Securely connect the portfolio you’re using to start.


