Why Is The Crypto Market Down Today?

0
0

The crypto market touched $2.45 trillion on April 8 before fading 0.88%, shedding $21.12 billion as the ceasefire euphoria ran into early violations, persistent inflation fears, and capital rotating into equities instead of digital assets.
Bitcoin (BTC) slipped to $71,023 while World Liberty Financial (WLFI) emerged as one of the biggest losers among actively traded tokens, dropping over 13% after its own treasury drained a stablecoin lending pool dry.
In the news today:-
- World Liberty Financial’s treasury deposited 3 billion WLFI tokens as collateral on Dolomite and borrowed $50.44 million in USD1, exhausting all available pool liquidity. USD1 deposit rates spiked to 35.81% and borrowing rates hit 30%, raising fears of a liquidation cascade if WLFI’s token price drops further.
- Morgan Stanley launched its spot Bitcoin ETF (MSBT) on NYSE Arca with a 0.14% expense ratio, the cheapest in the market. ETF analyst Eric Balchunas projected $5 billion in assets within the first year and $30 million in day-one volume, though the fund enters a market that saw $6.3 billion in ETF outflows between November and February.
- The Ethereum Foundation continued converting ETH to stablecoins, selling 3,750 ETH worth $8.3 million at an average price of $2,214 via CoW Protocol. It still holds 1,250 ETH worth approximately $2.77 million earmarked for grants and donations.
Crypto Market Fades From $2.45 Trillion as Ceasefire Cracks Emerge
The total crypto market capitalization sits at $2.39 trillion on April 9 after touching $2.45 trillion the previous session. The initial ceasefire-driven rally lost momentum as Gulf nations reported attacks on day one of the truce and Iran continued demanding conditions for Strait of Hormuz transit. The uncertainty killed the risk-on narrative that had pushed crypto higher just 24 hours earlier.
Capital rotation amplified the retreat. Equities gained on the ceasefire headlines while crypto pulled back, repeating the pattern where both asset classes have struggled to rally simultaneously during the Iran conflict.
Want more token insights like this? Sign up for Editor Harsh Notariya’s Daily Crypto Newsletter here.
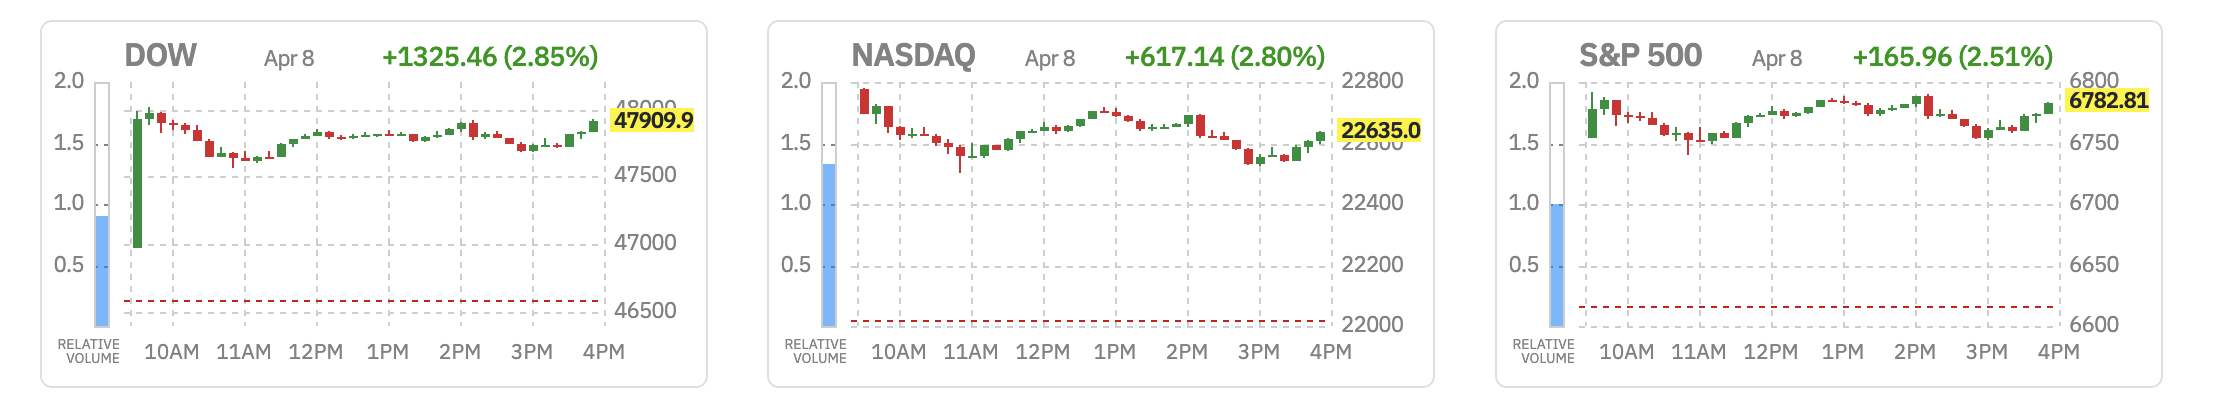 Equities Gain While Crypto Fades: FinViz
Meanwhile, total 24-hour liquidations reached $272.86 million across 79,415 traders, with long liquidations accounting for $170.42 million of the total, roughly 62%.
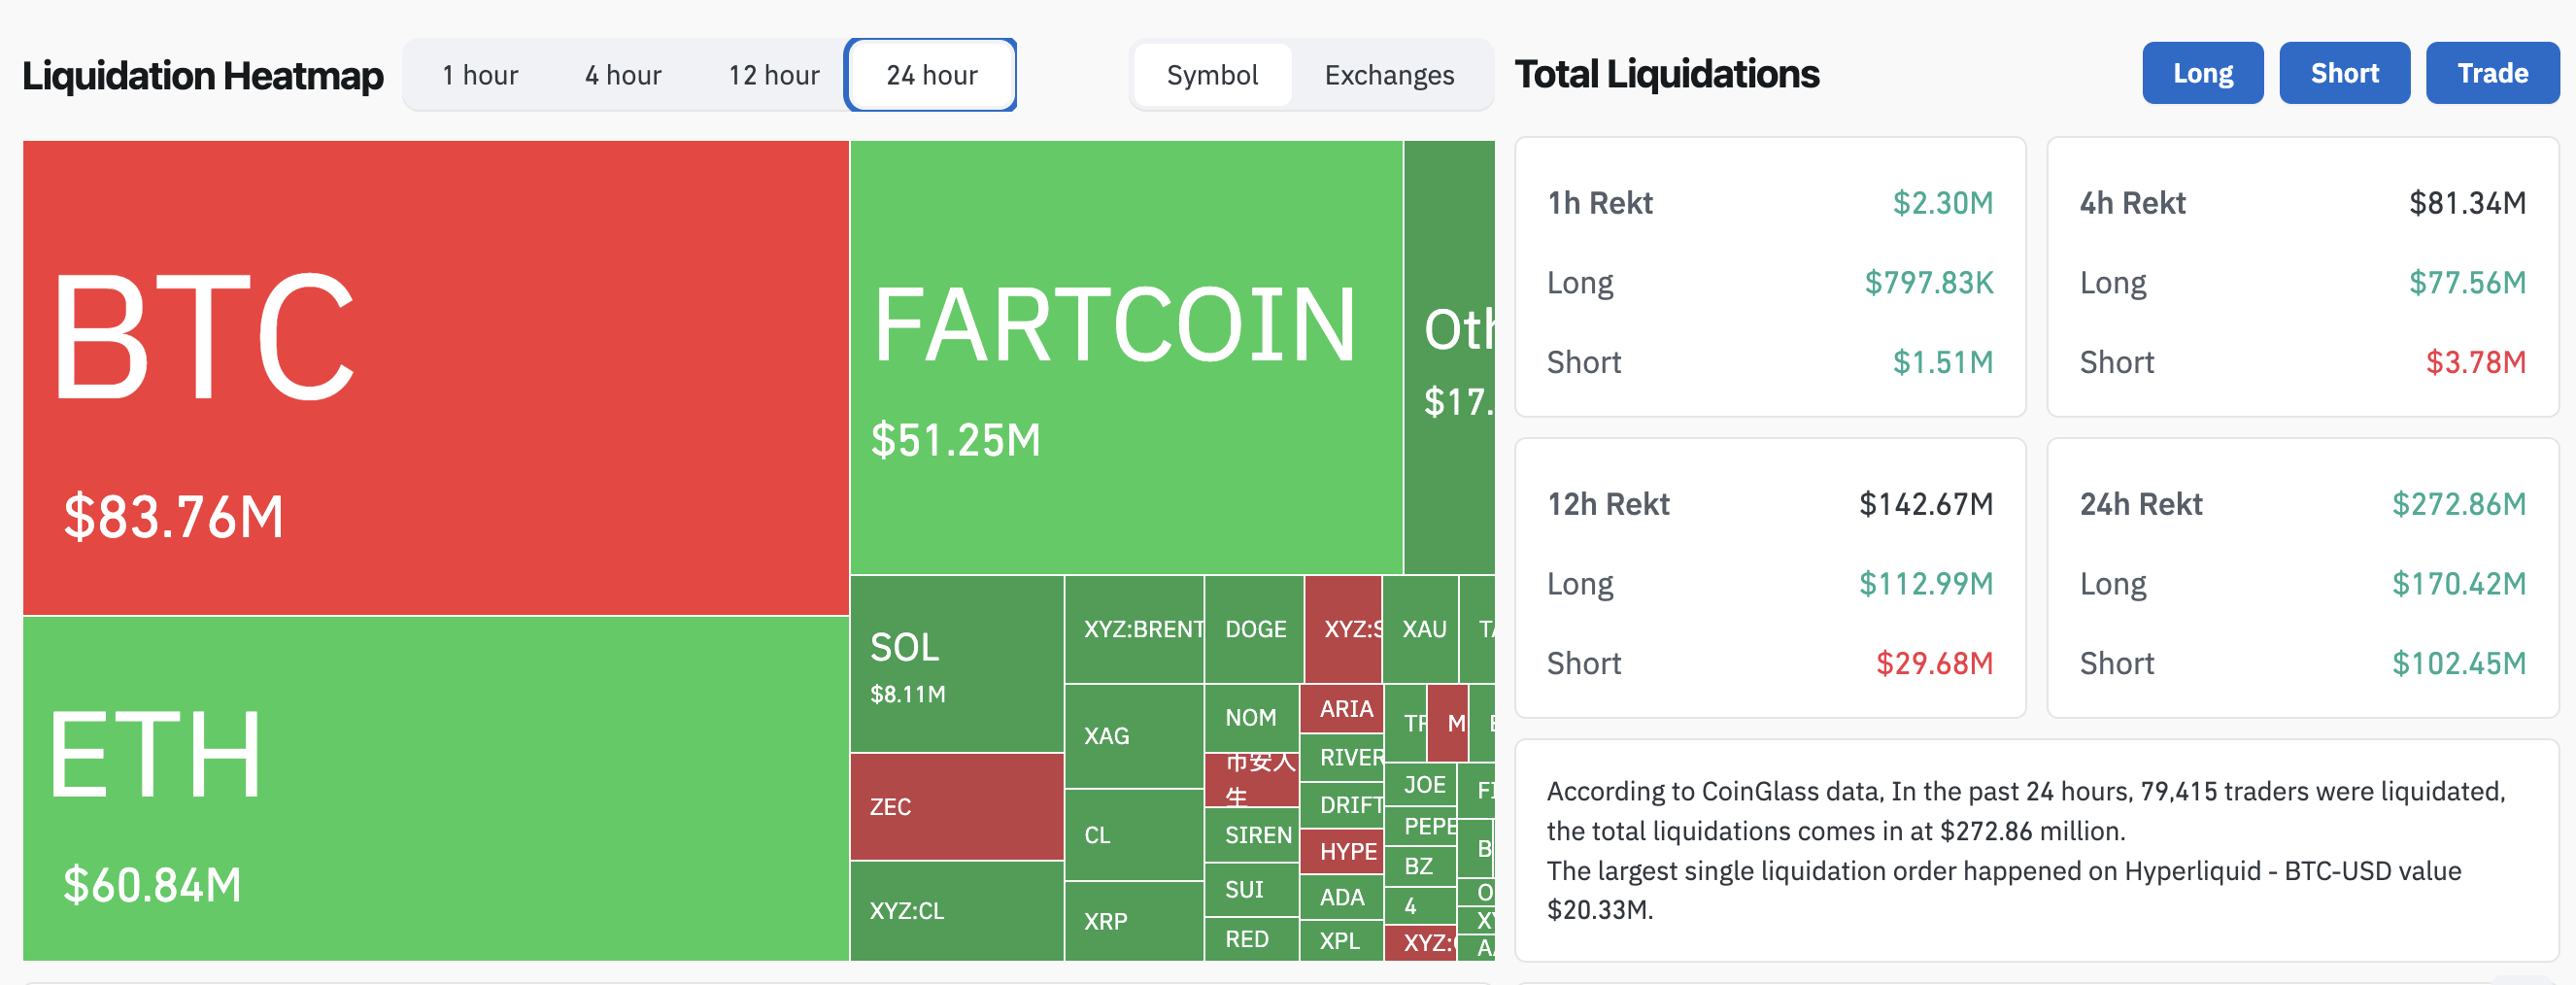 Liquidation Heatmap: CoinGlass
Friday’s March CPI report adds another layer of caution. A hot number would push rate-cut expectations further out, compressing the liquidity available for speculative assets.
The $2.39 trillion zone at the 0.382 level is the floor the market currently sits on. A break below exposes $2.33 trillion at the 0.236 level. On the upside, $2.44 trillion and $2.45 trillion need to be reclaimed, but $2.49 trillion at the 0.618 level stands as the line in the sand. A move above $2.49 trillion would open the path toward $2.56 trillion and $2.65 trillion.
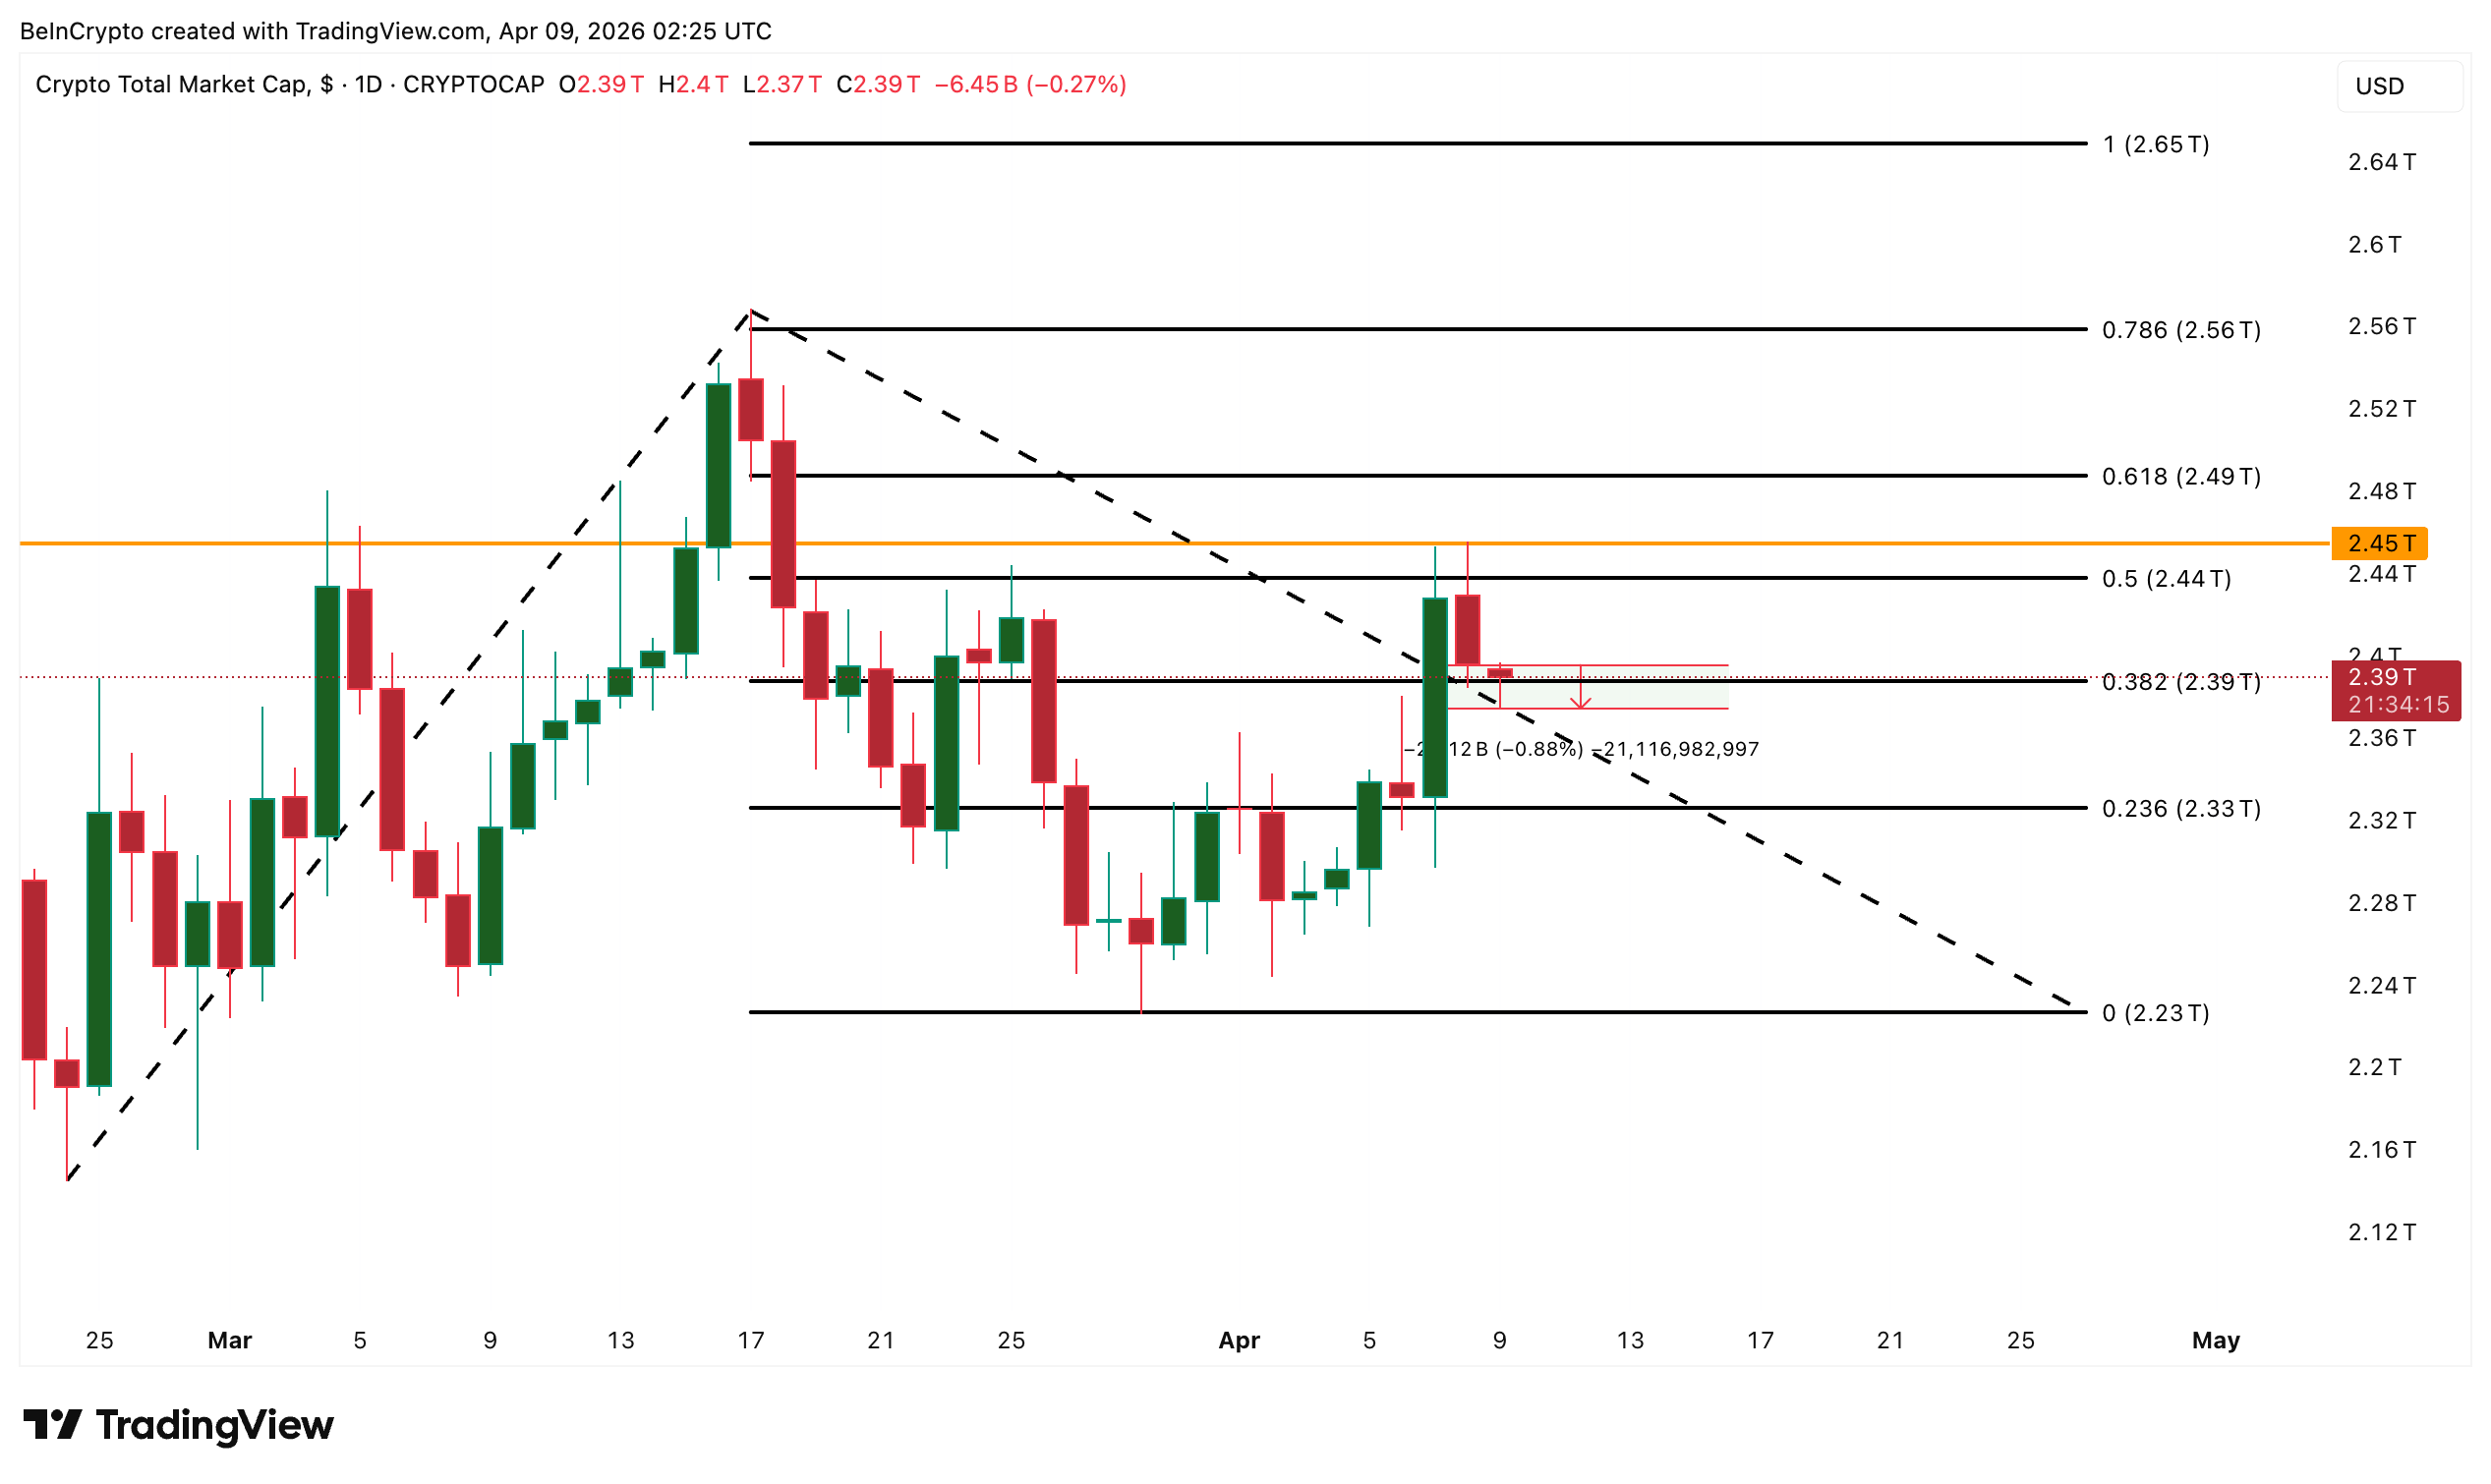 TOTAL Crypto Market Cap Analysis: TradingView
If $2.39 trillion holds, dip buyers may attempt another run at $2.45 trillion. If it breaks, $2.33 trillion becomes the next test.
Bitcoin’s Cup and Handle Keeps the $81,000 Target Alive
Bitcoin trades at $71,023 on April 9, down roughly 1% alongside the broader market. However, the daily chart still offers structural hope. Since late March, BTC has been forming what appears to be a cup and handle pattern. The cup’s rounded bottom took shape through late March, and the current consolidation is acting as the handle.
The pattern carries an 11.46% breakout projection from the neckline. BTC needs a clean daily close above $71,673 to break out of the handle. A close above $73,272 at the 0.618 Fibonacci level would break the neckline of the cup itself and could prime Bitcoin for a move toward the $81,000 zone.
The intraday drawdown does not invalidate the structure. Handles routinely pull back before breakout attempts, and the current decline keeps price well within the pattern’s boundaries. The ceasefire cracks and CPI overhang may extend the handle’s duration, but they do not break it.
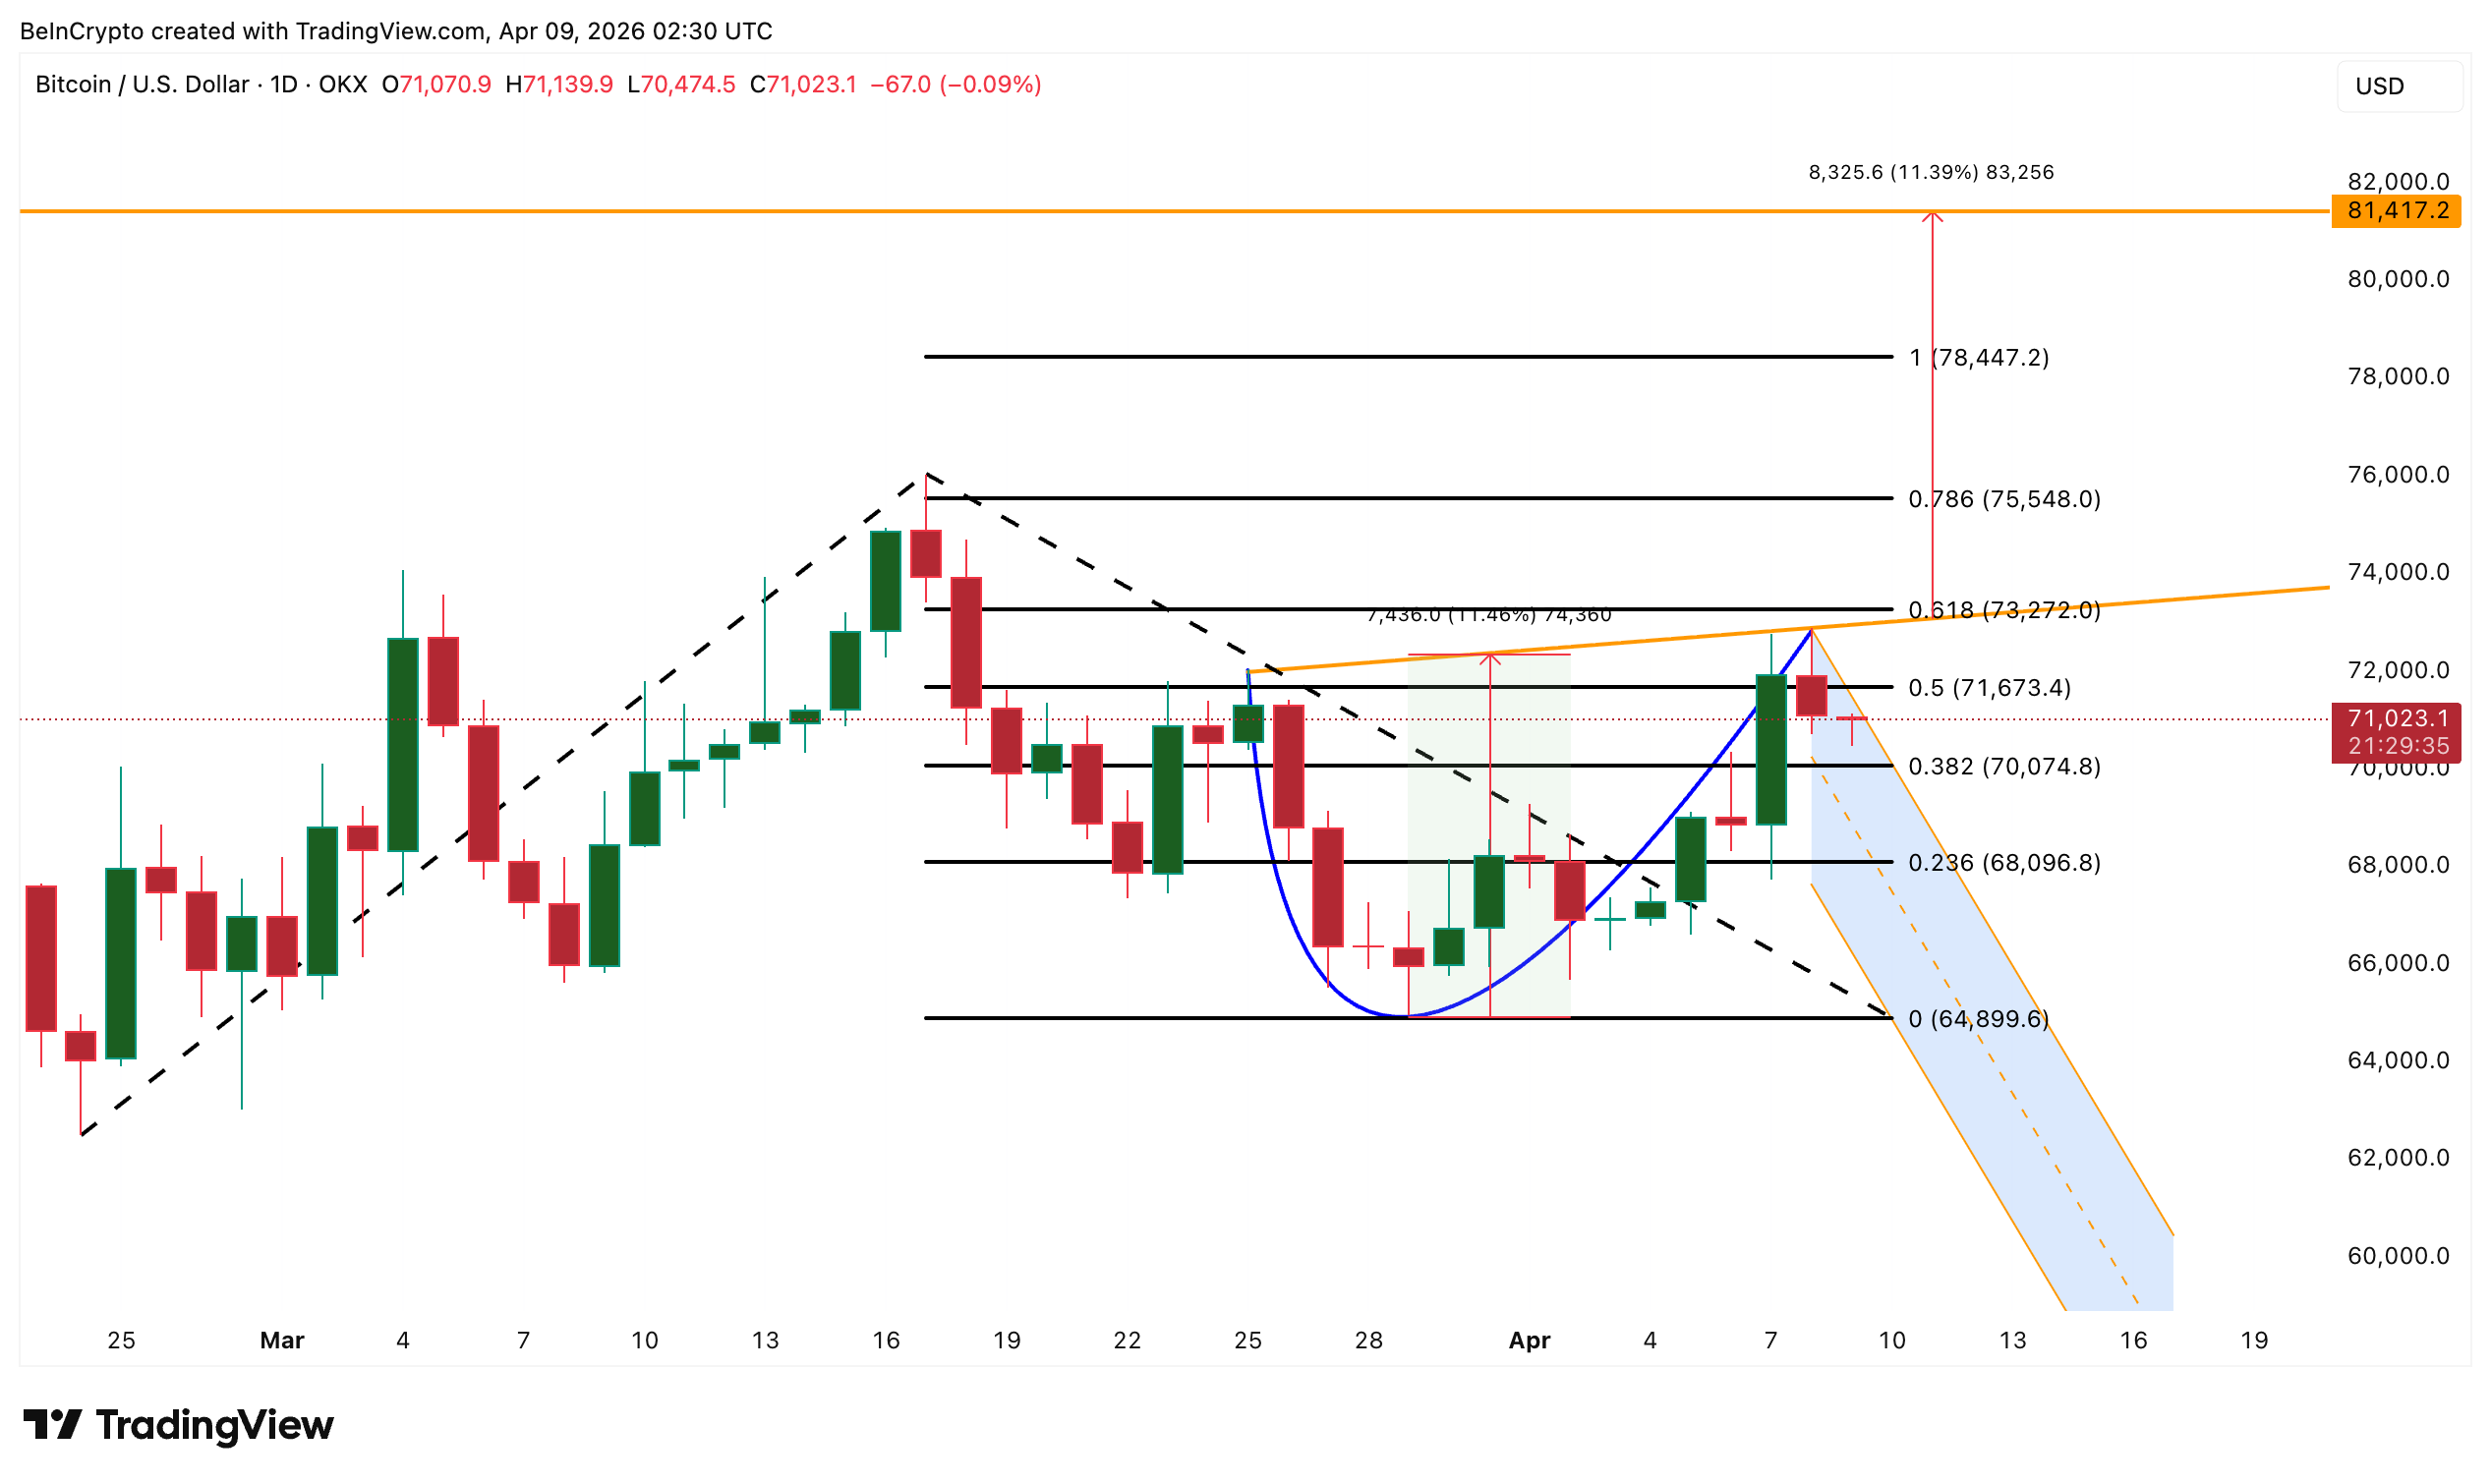 Bitcoin Price Analysis: TradingView
On the downside, $70,074 at the 0.382 Fibonacci level is the first support. A drop below $68,096 weakens the handle. A breakdown below $64,899 at the cup’s base invalidates the pattern entirely. A daily close above $73,272 targets $81,000. A close below $70,074 brings $68,096 into focus.
World Liberty Financial (WLFI) Drops 13% After Treasury Drains Its Own Lending Pool
World Liberty Financial (WLFI) trades at $0.0916 after dropping 13.42% since April 7, making it one of the weakest performers among actively traded tokens. The sell-off has a specific trigger beyond the broader market weakness.
On April 8, WLFI’s own strategic reserve wallet deposited approximately 3 billion WLFI governance tokens as collateral on Dolomite and borrowed $50.44 million in USD1, the project’s dollar-pegged stablecoin. The move pushed pool utilization past 100%, turning available liquidity negative at -232,000 tokens. USD1 deposit rates surged to 35.81% while borrowing costs hit 30%.
The concern is straightforward. If WLFI’s token price drops further, the over-collateralized position risks liquidation. This could cascade through the pool and trap lenders chasing the elevated yields.
The technical picture was already bearish before the drain. WLFI has traded inside a falling channel since mid-February. Between February 18 and April 7, price made a lower high while the RSI made a higher high, a hidden bearish divergence that signaled trend continuation. The signal proved accurate, with the 13.42% decline following immediately.
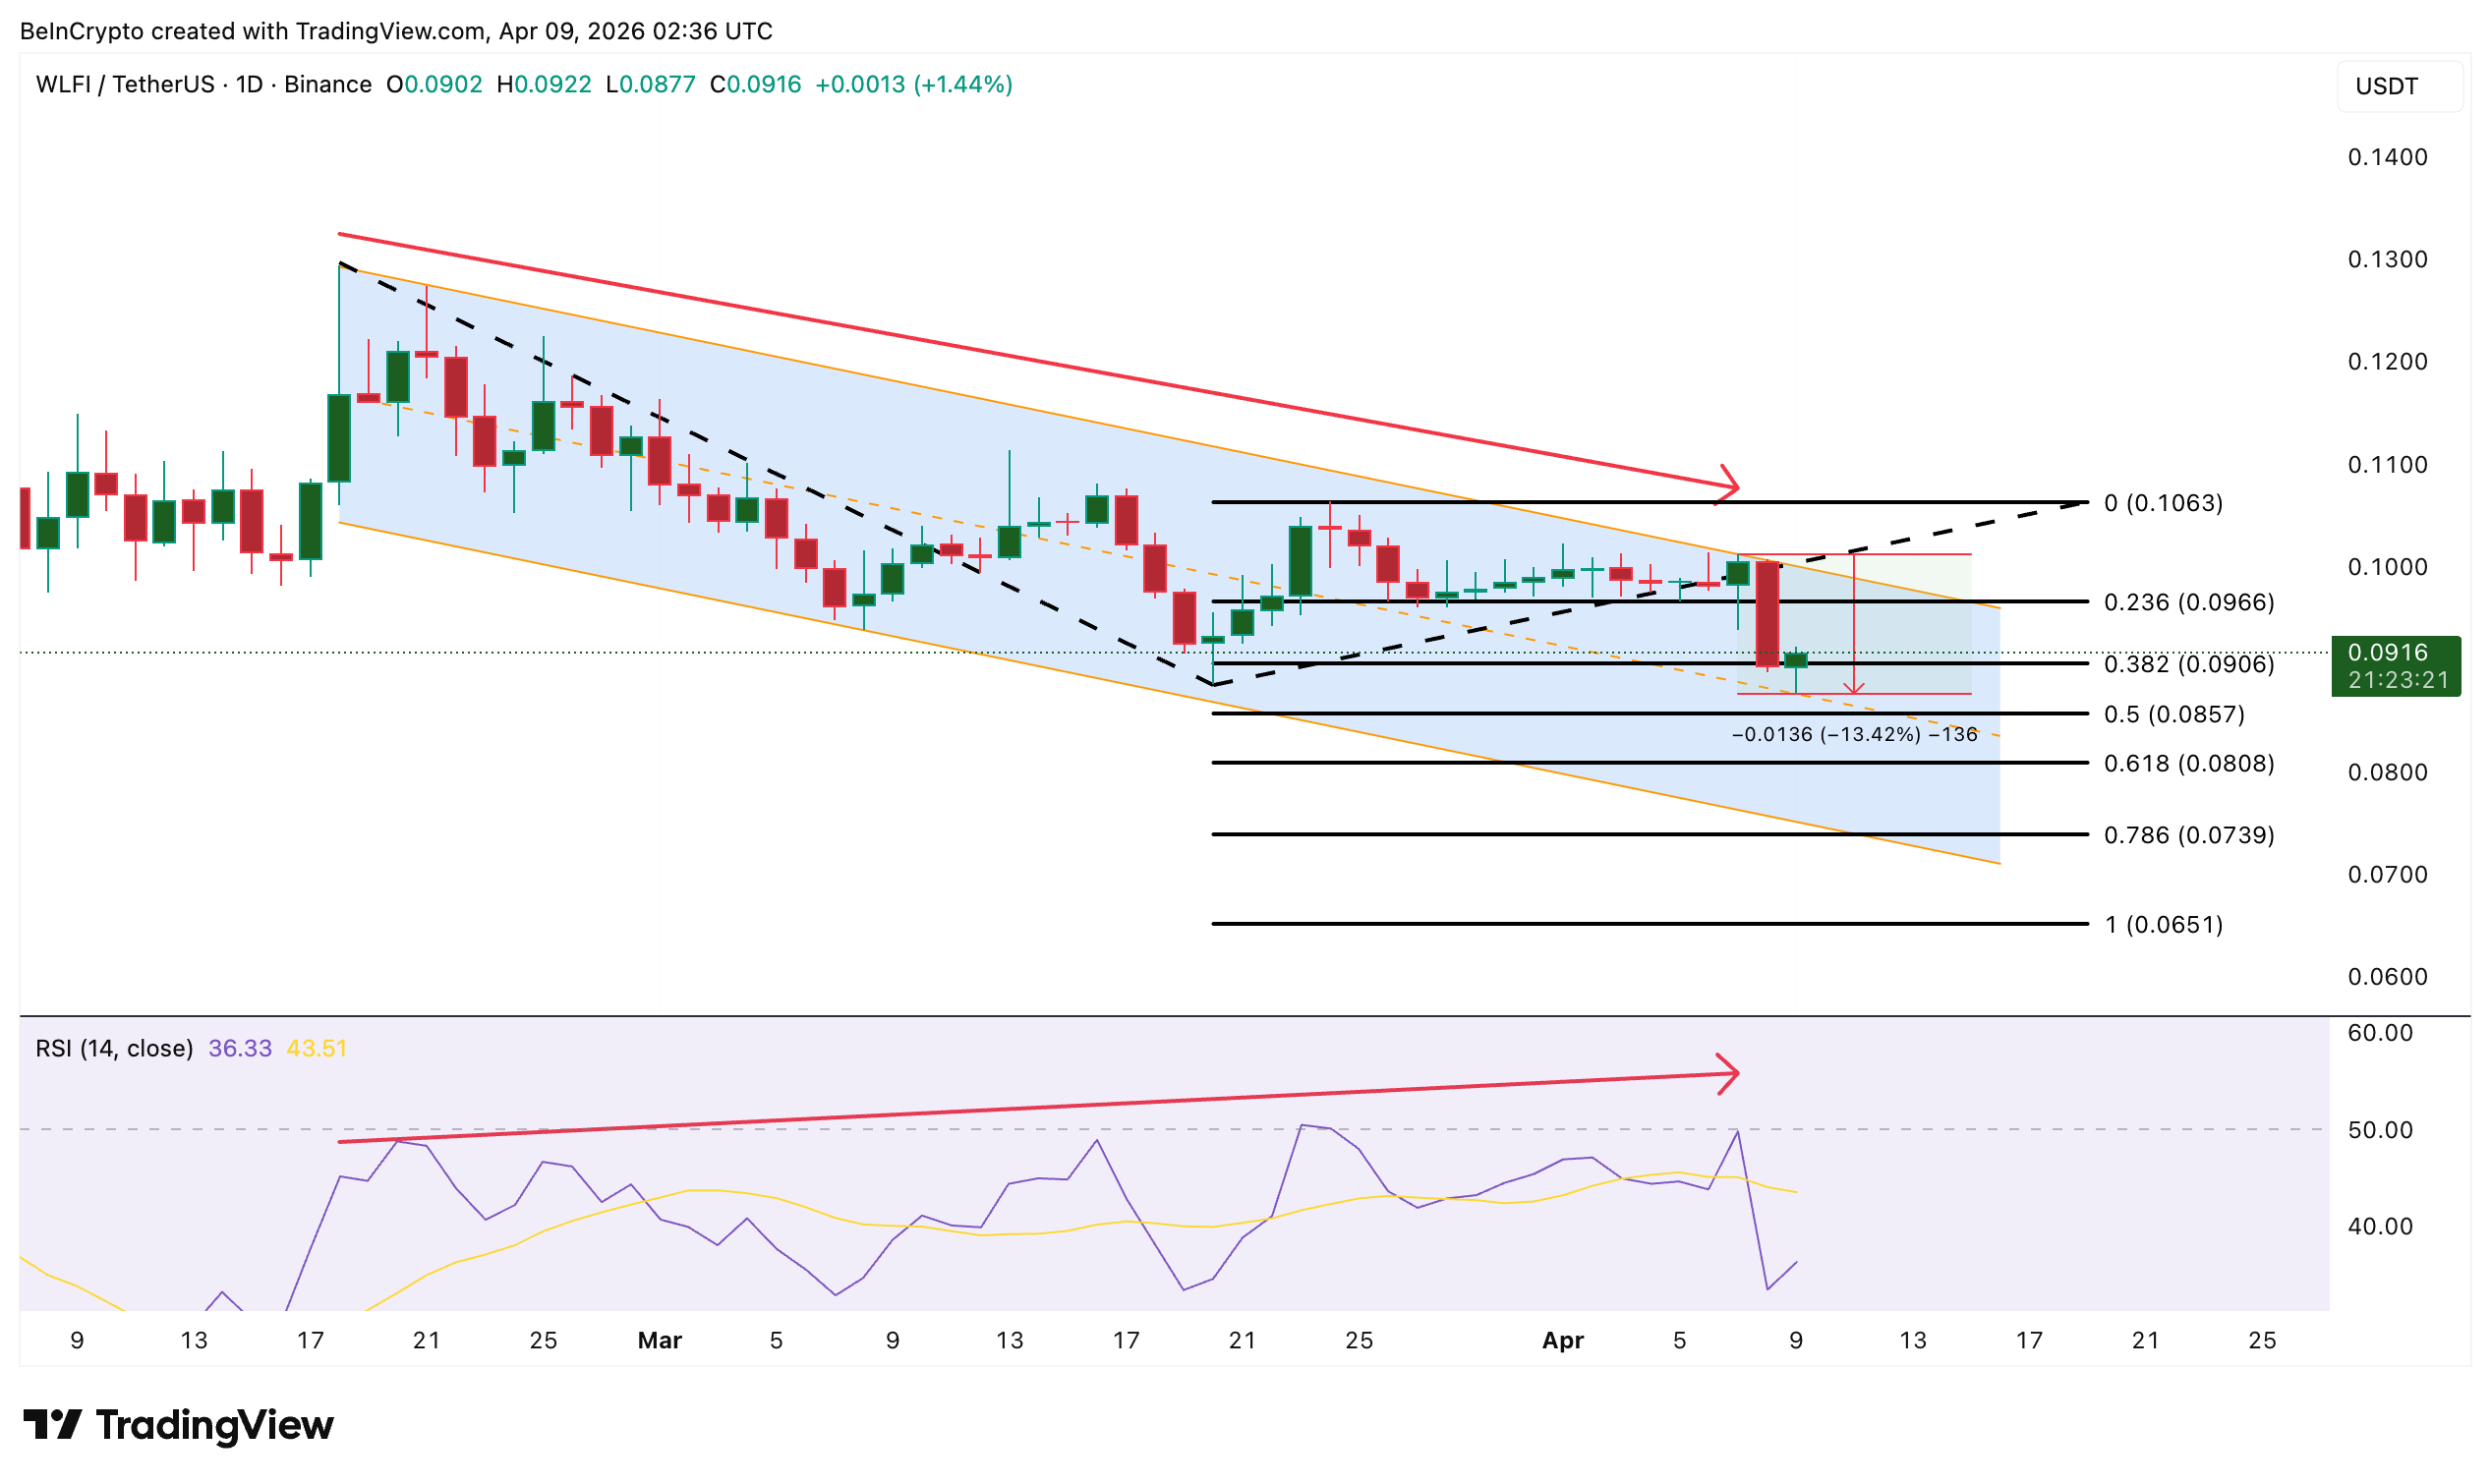 WLFI Price Analysis: TradingView
WLFI needs to stay above $0.090 at the 0.382 level to avoid a deeper drop toward $0.080 and $0.073. A drop below $0.073 would expose the lower trendline of the falling channel. Strength only returns if WLFI reclaims $0.096. Reclaiming $0.106 would shift the short-term structure back toward neutral.
$0.090 separates a potential stabilization from a liquidation-driven drop toward $0.073 and the lower boundary of the falling channel.
0
0


 Manage all your crypto, NFT and DeFi from one place
Securely connect the portfolio you’re using to start.

0
0

0
0

0
0

0
0