Chainlink Surpasses Ethereum in Development Activity Amid RWA Momentum

0
0

Chainlink (LINK) has surged to the forefront of crypto development, recently surpassing Ethereum (ETH) in GitHub activity.
This momentum coincides with Chainlink’s successful role in Hong Kong’s e-HKD+ Pilot Program, where its interoperability protocol enabled a cross-border exchange between CBDCs and stablecoins.
Chainlink Overtakes Ethereum in Development Activity Amid RWA Focus
Chainlink (LINK) has outpaced Ethereum in development activity over the past 30 days, according to on-chain analytics firm Santiment. The move solidifies its status as a leading real-world asset (RWA) tokenization infrastructure provider.
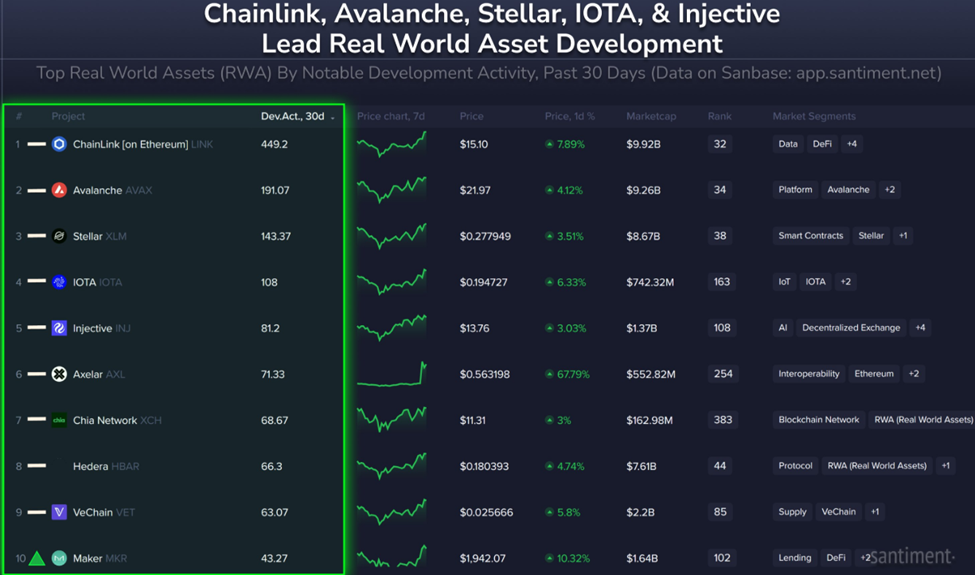 Chainlink leads crypto’s top RWA by development. Source: Santiment on X
The analytics firm also revealed a surge in GitHub activity, with Chainlink ranking second overall, even ahead of Ethereum, which placed eighth. This reflects Chainlink’s growing momentum, particularly in the context of institutional use cases.
“While most of crypto stays flat Tuesday, Chainlink (+7.7%) and Ethereum (+6.3%) have continued to break out. These two projects are known for their top ranked developing teams. Over the past 30 days, LINK has had the 2nd most notable github events and ETH is in 8th,” Santiment analysts noted.
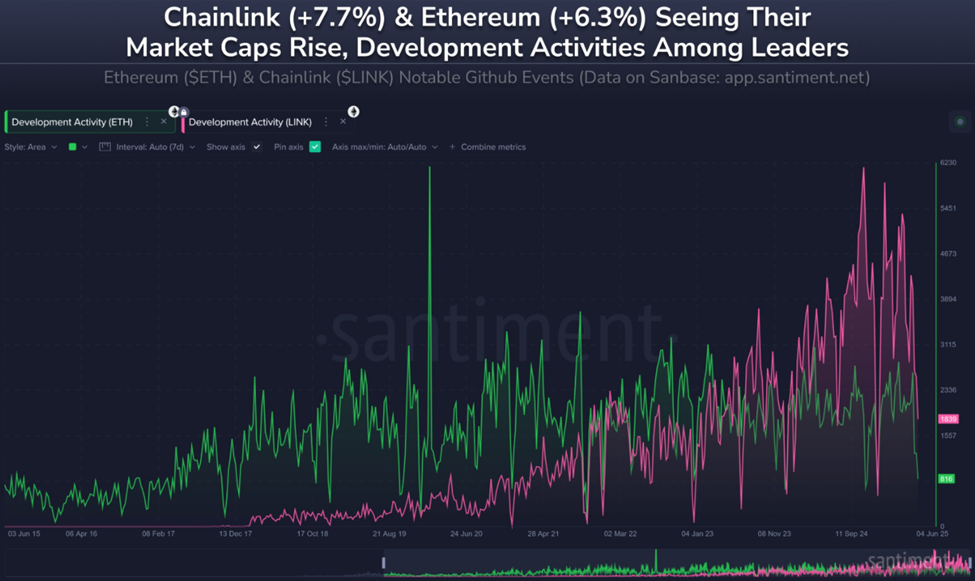 Chainlink leads GitHub activity. Source: Santiment on X
Chainlink’s continued technical progress comes as it deepens its ties with major financial institutions.
Co-founder Sergey Nazarov recently responded to a report from Visa, reflecting Chainlink’s role in solving three core challenges for institutional smart contracts: secure data feeds, cross-chain connectivity, and compliance standards.
“Very excited about this report from Visa, showcasing how Chainlink is able to solve the three biggest problems of next generation smart contracts for institutional transactions, all in one platform,” Nazarov said on X.
He cited a complex transaction involving ANZ and Fidelity International, executed within the HKMA’s regulatory framework. According to the Chainlink executive, this is a clear sign of the unique value the network provides.
“As more and more top institutions join the Chainlink standard for institutional transactions to happen on-chain, the network and the standards become more valuable to the current participants and the ones considering joining the transactional standard,” Nazarov added.
LINK Rallies 5% on Real-World Use Case with e-HKD Pilot
On June 9, Chainlink’s Cross-Chain Interoperability Protocol (CCIP) facilitated the secure exchange of a Hong Kong central bank digital currency (CBDC) and an Australian dollar stablecoin.
The test involved financial heavyweights including Visa, ANZ, China AMC, and Fidelity International. The announcement fueled a strong market reaction, with LINK rising from $13.90 to $14.60, an 8% increase in the aftermath.
The spike reflects growing investor confidence in Chainlink’s infrastructure as a foundational layer for institutional blockchain adoption. As of this writing, the chainlink price surge has increased by over 5% in the last 24 hours to trade for $15.28.
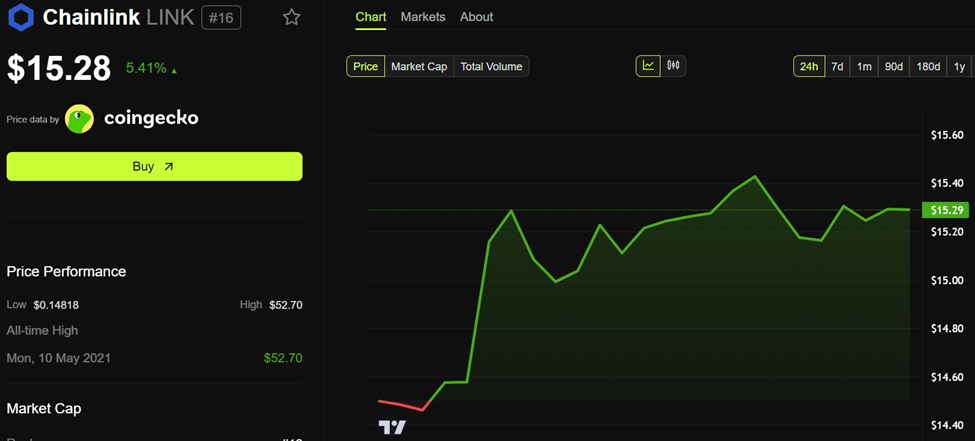 Chainlink (LINK) Price Performance. Source: BeInCrypto
“There simply isn’t a project with the institutional adoption of Chainlink,” Crypto analyst Quinten François noted.
Chainlink’s technical and institutional momentum appears to be converging. This is despite its dominance of GitHub activity, its leadership of the RWA category, and its execution of high-profile pilot programs with global financial players.
Chainlink Price Outlook
Despite bullish fundamentals, Chainlink price is confronting resistance due to an overhanging supply zone between $16.04 and $17.43. It also faces resistance presented by the upper trendline of a falling wedge pattern.
If the LINK price breaks and holds above the trendline, it could initiate a 57% run long term, executing the target objective of the falling wedge. This target is determined by measuring the longest height of the wedge and superimposing it at the prospective breakout point.
Technical indicators align, as Chainlink price flipped the 50-day SMA (Simple Moving Average) into support at $15.07. Additionally, the 100-day SMA also provides additional support at $14.35.
However, traders looking to take long positions on LINK should consider waiting for a candlestick close above $16.70, the midline or mean threshold of the supply zone. The Relative Strength Index (RSI) also shows rising momentum, adding credence to the bullish thesis.
The RSI indicator’s position above 50 accentuates the bullish outlook, showing LINK bulls have the upper hand. This is also seen in the higher highs on the LINK/USDT chart during the one-day timeframe over the past five trading sessions.
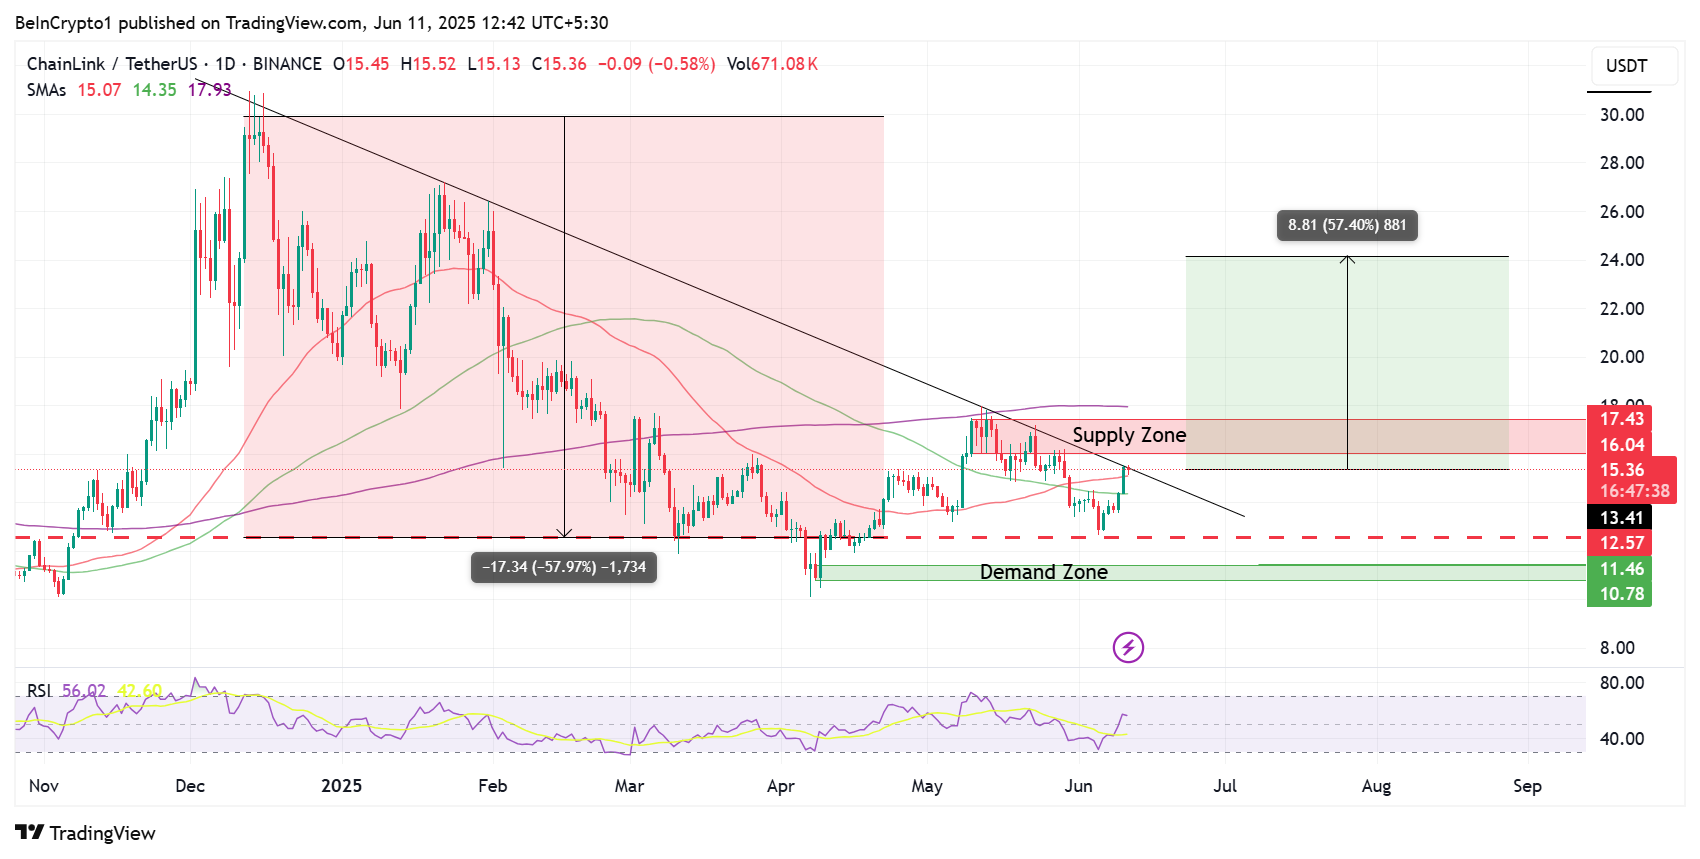 Chainlink (LINK) Price Performance. Source: TradingView
Conversely, if the upper trendline of the wedge holds as a resistance, Chainlink price could drop, flipping the 50-day SMA back into a resistance level.
Increased selling pressure could also see the LINK price lose support due to the 100-day SMA, at $14.35. The demand zone between $10.78 and $11.46 would offer LINK bulls a possible entry, but a breakdown of this buyer congestion zone could extend losses for LINK holders.
0
0


 Manage all your crypto, NFT and DeFi from one place
Securely connect the portfolio you’re using to start.


0
0

