Bitcoin Bulls Are Watching This Signal

0
0

Markets bottom in fear. Not in optimism, not in cautious recovery, and not when the headlines turn neutral.
They bottom when the selling exhausts itself and the last holders who wanted to exit have already done so.
By almost every sentiment measure available right now, that process may be closer to completion than most people are willing to admit.
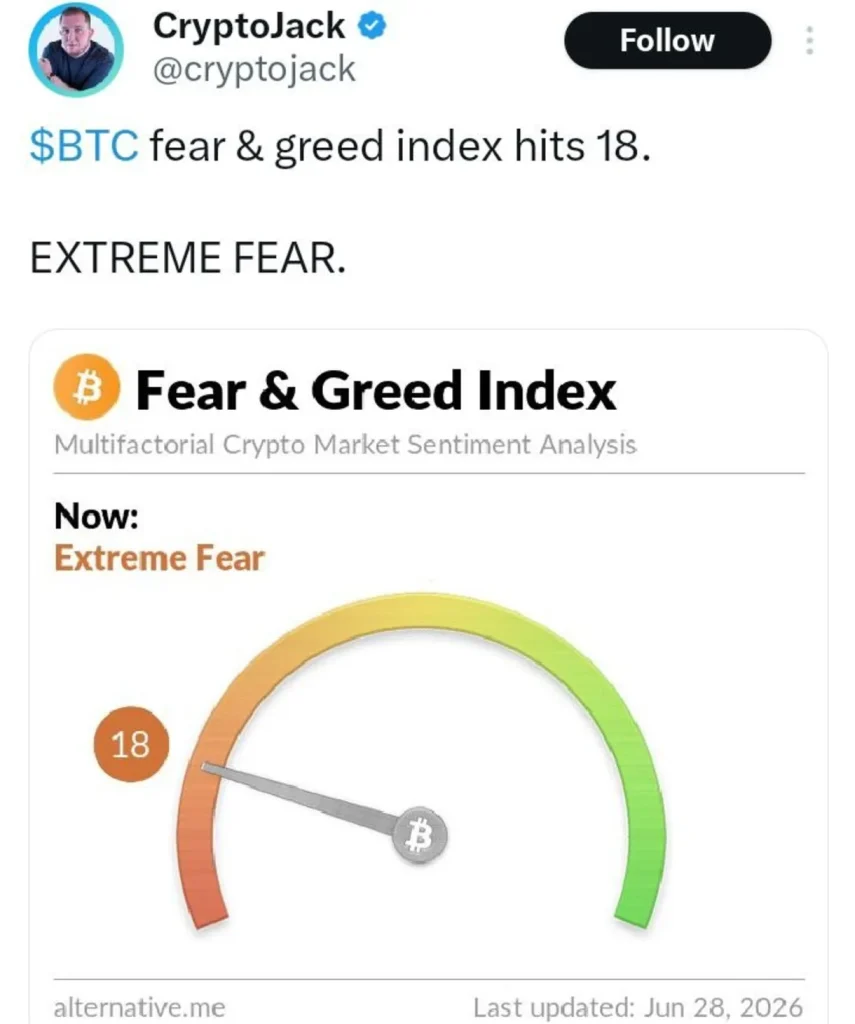
Two data points landed on June 28, 2026 that deserve to be read together. First, the Bitcoin Fear & Greed Index dropped to 18 — deep into Extreme Fear territory, a reading associated historically with cycle lows rather than cycle midpoints.
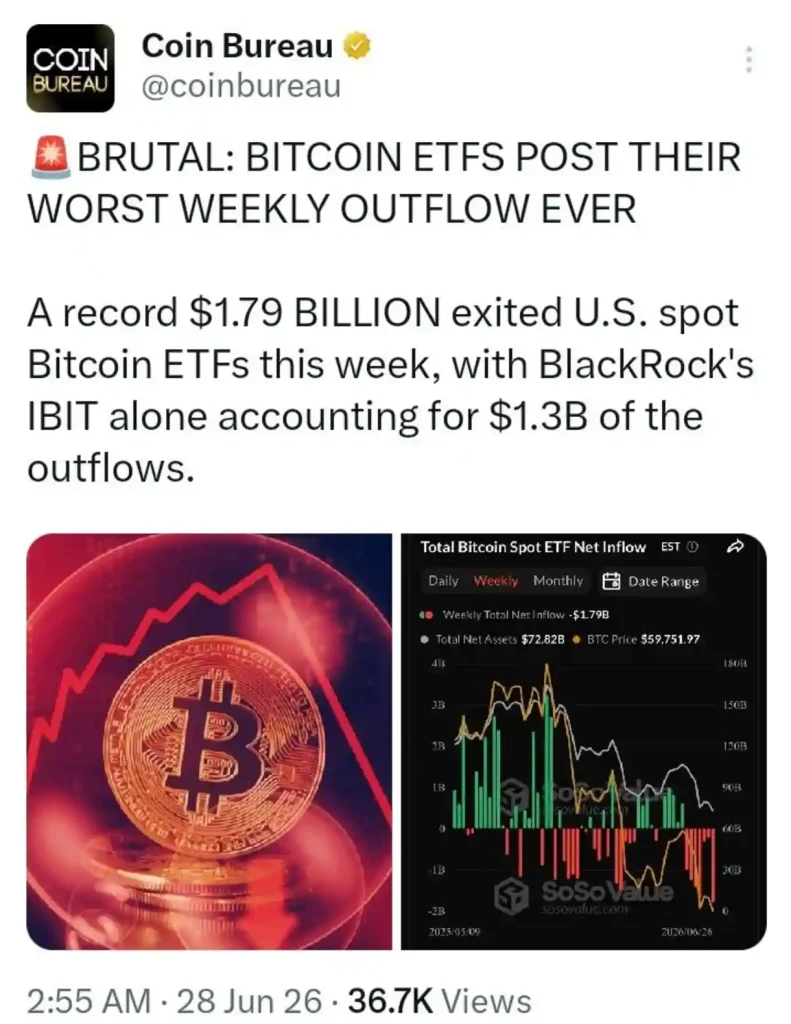
Second, Coin Bureau reported that U.S. spot Bitcoin ETFs just posted their worst weekly outflow on record — a staggering $1.79 billion exiting in a single week.
BlackRock’s IBIT alone accounts for $1.3 billion of those redemptions. Total net assets across Bitcoin ETFs now sit at $72.82 billion.
Why the Worst ETF Outflow on Record Is Not Straightforwardly Bearish
The instinct is to read $1.79 billion in outflows as unambiguously negative. But context matters.
Record outflow events in ETF history have frequently marked sentiment extremes rather than the beginning of sustained structural exits.
When institutional redemptions reach record levels, it typically means the investors most sensitive to short-term price pain have already sold.
What remains after a record outflow event is a holder base that chose not to redeem — and that cohort tends to be more conviction-driven and longer-duration than average.
BlackRock’s $1.3 billion in IBIT outflows is the headline figure. But IBIT still holds tens of billions in net assets.
The investors who stayed are making a deliberate choice in the face of the worst weekly outflow the product has ever seen.
A Month That Left a Mark on the Chart
Data pulled from CoinGecko on June 28, 2026 at approximately 17:00 UTC shows Bitcoin trading at $59,962.21, down 17.9% over thirty days.
The monthly chart tells the full story of June’s damage. Bitcoin opened the month near $73K, sold off sharply through the first week to $62K, staged a partial recovery to $65K by mid-June.
Then it rolled over again in the final ten days — breaking below $60K and now struggling to reclaim it.
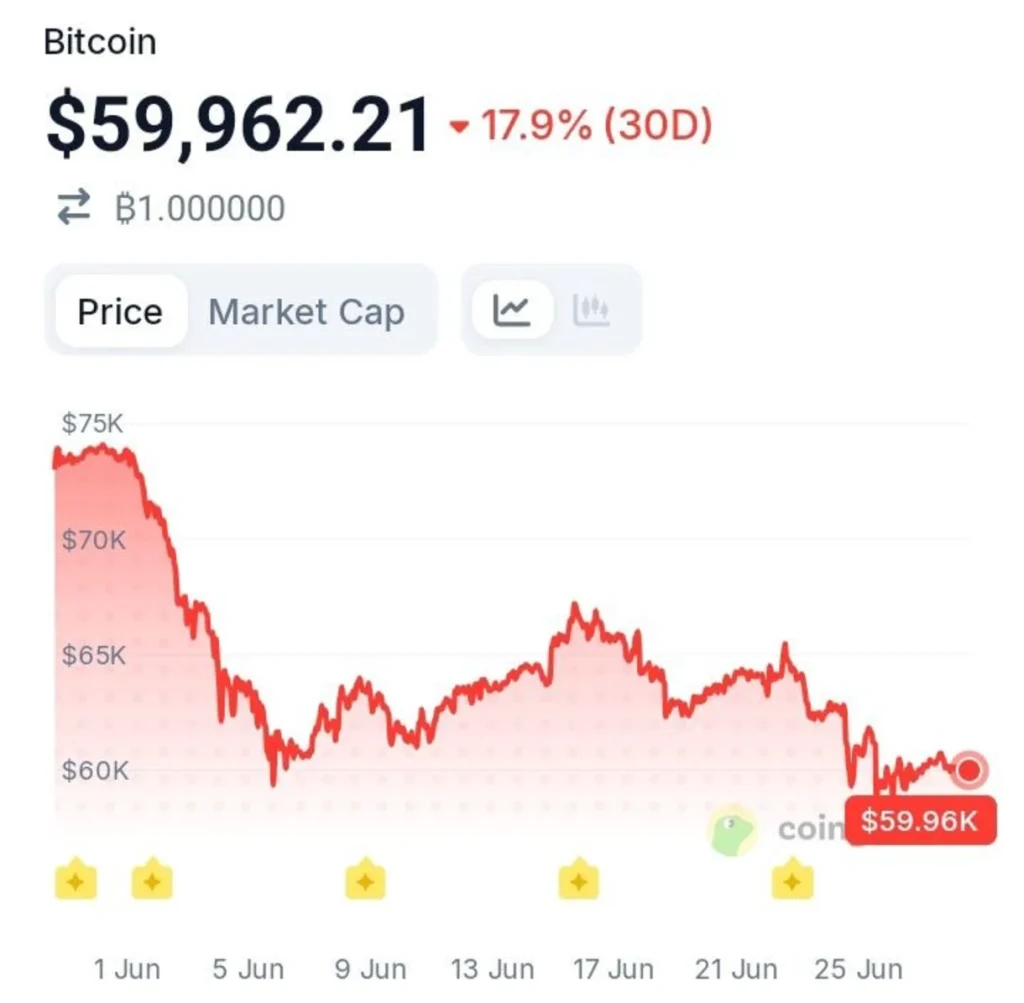
The structure is one of lower highs and persistent selling pressure with no sustained floor yet visible.
Thirty days of red ending at the psychological $60K boundary is not a setup that invites casual optimism.
What Happens After Peak Fear?
Bitcoin’s history with extreme fear readings is well documented. The asset has spent very little cumulative time at sentiment scores below 20 — and the periods when it has tend to cluster near generational entry points rather than the beginning of extended downtrends.
The current bear market is already one of the longest on record, with the shallowest drawdown in cycle history.
A record ETF outflow and a Fear & Greed score of 18 arriving simultaneously into that context does not describe a market in freefall. It describes a market running out of sellers.
Bitcoin bulls are not watching the price right now. They are watching this signal — because every major Bitcoin recovery in history has started somewhere that felt exactly like this.
Disclaimer:
This article is for informational purposes only and does not constitute financial, investment, or trading advice. The views expressed are based on publicly available data, market observations, and the author’s interpretation at the time of writing. Cryptocurrency markets are highly volatile and unpredictable, and past performance or current technical setups do not guarantee future results. Readers should conduct their own research and consult with a qualified financial advisor before making any investment decisions. TechGaged does not accept liability for any losses incurred based on the information presented.
The post Bitcoin Bulls Are Watching This Signal appeared first on TechGaged.com.
0
0


 Manage all your crypto, NFT and DeFi from one place
Securely connect the portfolio you’re using to start.

0
0


