3 Bullish Altcoins Predicted to Outshine Bitcoin (BTC) in February

0
1

These three altcoins exhibit bullish formations against Bitcoin (BTC) and could outperform it in February.
Despite Bitcoin’s (BTC) decrease since January 14, these altcoins display positive price movement. Can they outperform BTC in February?
Chainlink (LINK) Price Breaks Long-Term Resistance
The weekly time frame technical analysis shows that the LINK price had decreased under a descending resistance trend line since June 2020. The decrease led to a low of ₿0.00018 in June 2023.
While the movement seemingly caused a breakdown from the $0.00023 support area, LINK reclaimed it shortly afterward, turning the decrease into a deviation (red circle).
The LINK price broke out from the trend line after over 1,100 days, reaching a high of ₿0.00045 in November before falling. The ensuing decrease validated the ₿0.00042 area as resistance.
Despite the drop, LINK regained its footing and is attempting another breakout. If successful, the price can increase 100% to the next resistance at ₿0.00075.
The daily Relative Strength Index (RSI) supports the upward movement. Traders utilize the RSI as a momentum indicator to assess whether a market is overbought or oversold and whether to accumulate or sell an asset.
If the RSI reading is above 50 and the trend is upward, bulls still have an advantage, but if the reading is below 50, the opposite is true. The RSI is above 50 and increasing. Both are bullish signs.
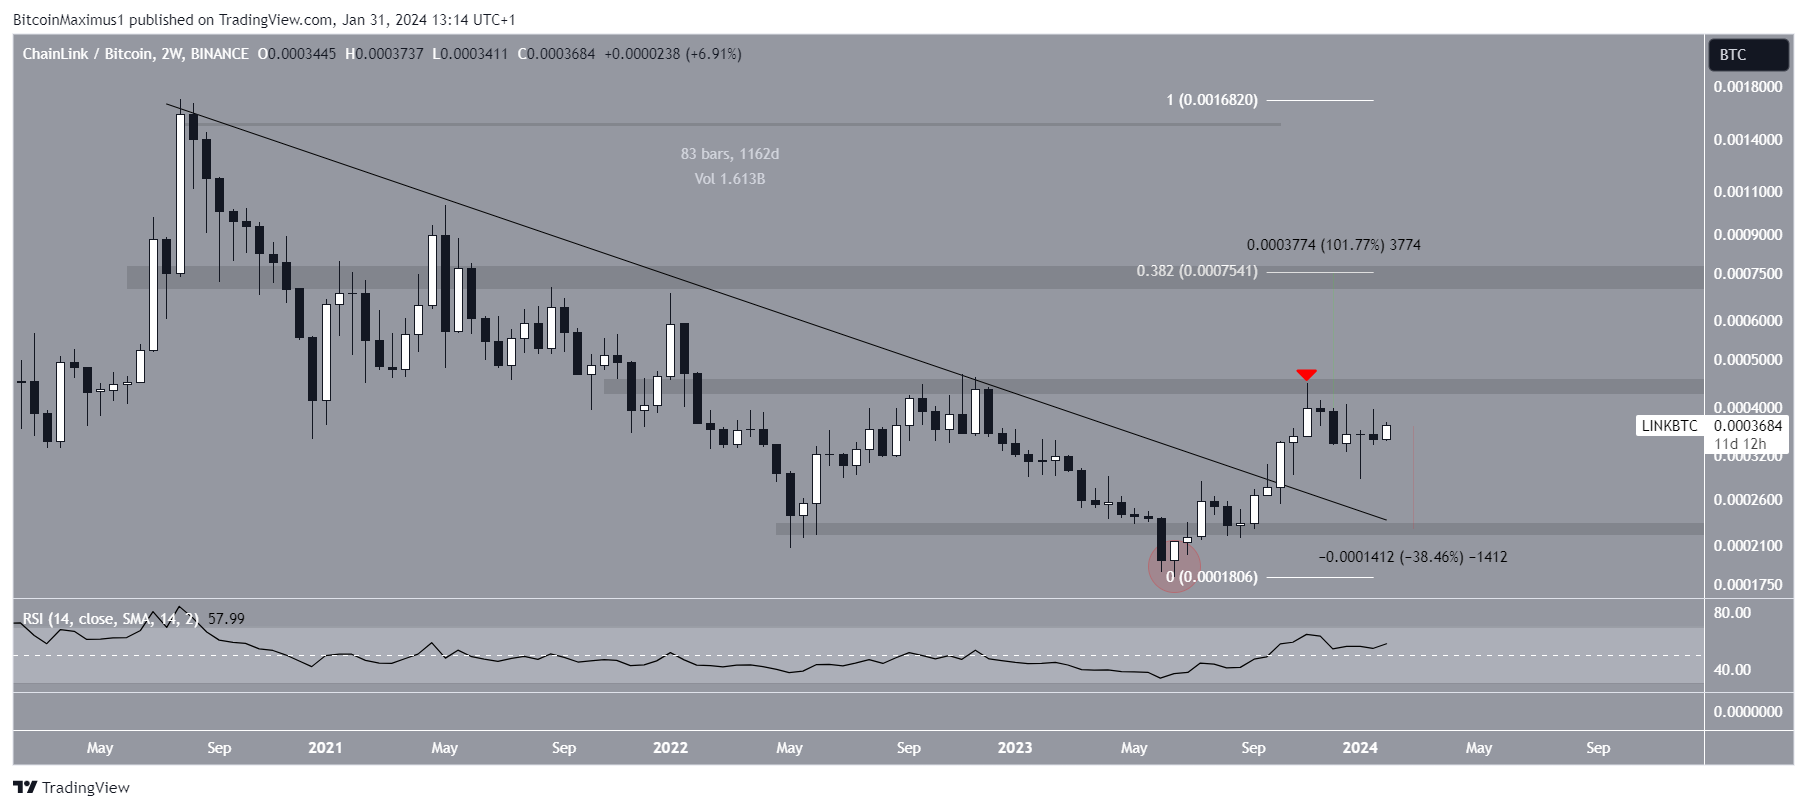 LINK/BTC 2-Week Chart. Source: TradingView
Despite this bullish LINK price prediction, failure to break out above ₿0.00042 can trigger a 40% drop to the closest support at ₿0.00022.
Read more: What is Chainlink (LINK)?
Frax Share (FXS) Completes Accumulation
The FXS price had fallen under a descending resistance trend line since its all-time high price of ₿0.0012 at the start of 2022. The trend line was validated several times, leading to a low of ₿0.00013 in November 2023.
The price has increased since and broke out from the trend line two weeks ago. At the time, the trend line had been in place for nearly 730 days.
Before the breakout, the weekly RSI generated bullish divergence for more than six months. Such a divergence is rare and often leads to bullish trend reversals.
If the FXS increase continues, the price can reach the ₿0.00048 resistance, 100% above the current price.
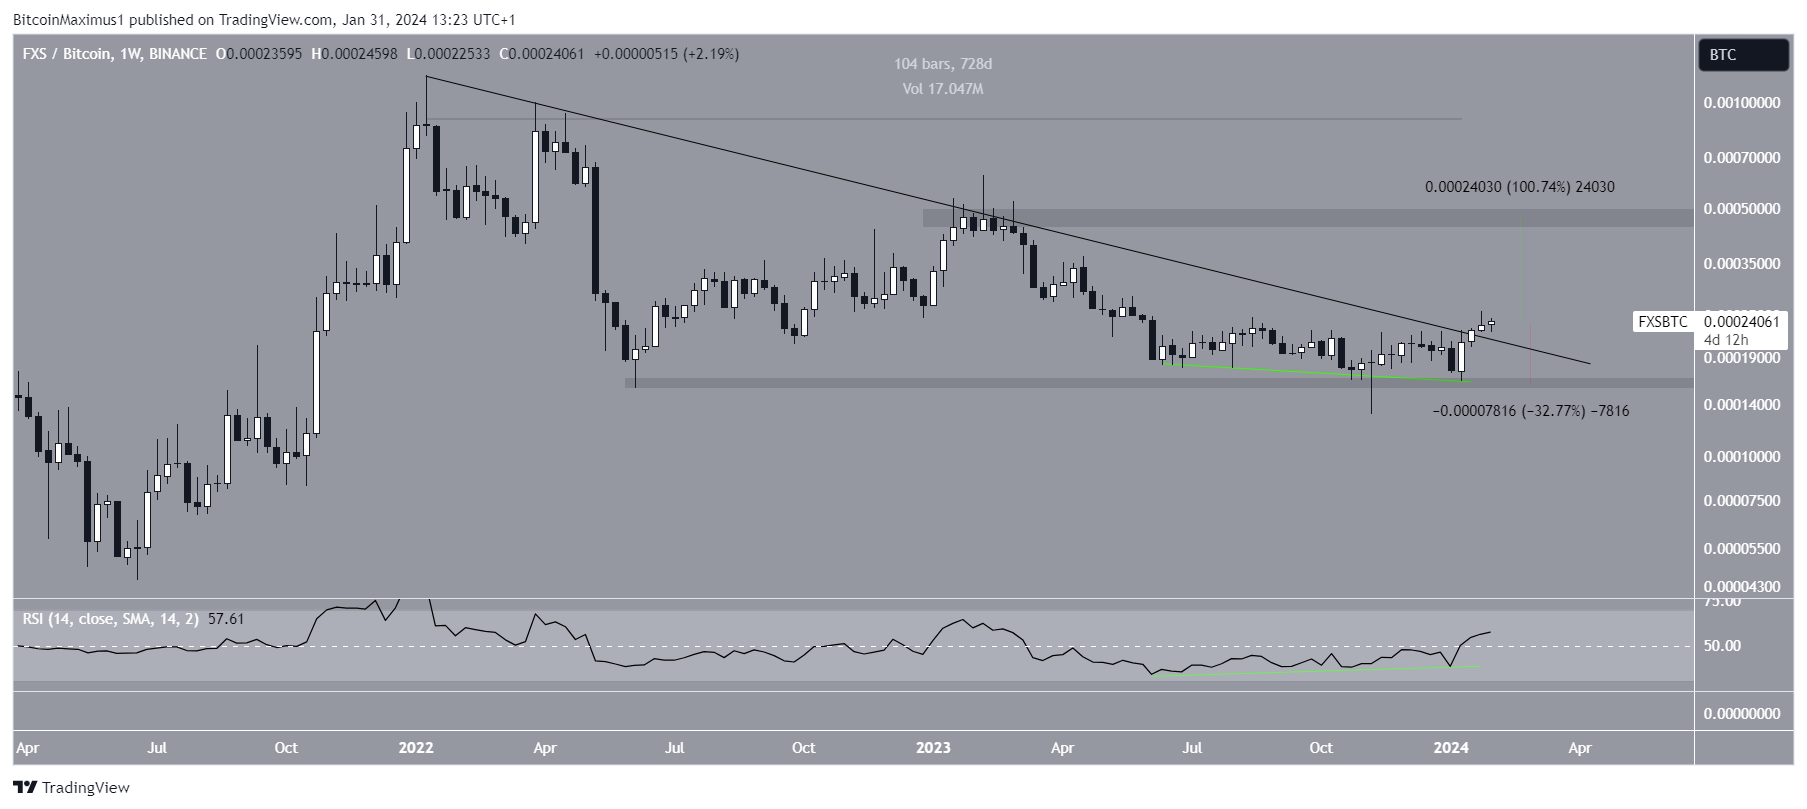 FXS/BTC Weekly Chart. Source: TradingView
Despite this bullish FXS price prediction, a weekly close below the resistance trend line can trigger a 30% fall to ₿0.00016.
Read More: What is The Impact of Real World Asset Tokenization?
Ethereum (ETH) Generates Bullish Divergence
The final altcoin that could outperform BTC is ETH.
The ETH price has increased alongside an ascending support trend line for 1,600 days. More recently, the trend line was validated at the start of January (green icon), creating a large bullish candlestick.
Interestingly, the weekly RSI generated a bullish divergence and moved outside its oversold territory. Previously, ETH created such a divergence when the upward movement started.
The ETH price will confirm its bullish trend reversal by breaking out from its descending resistance trend line (dashed). Then, it can increase by 50% to the next resistance at ₿0.08.
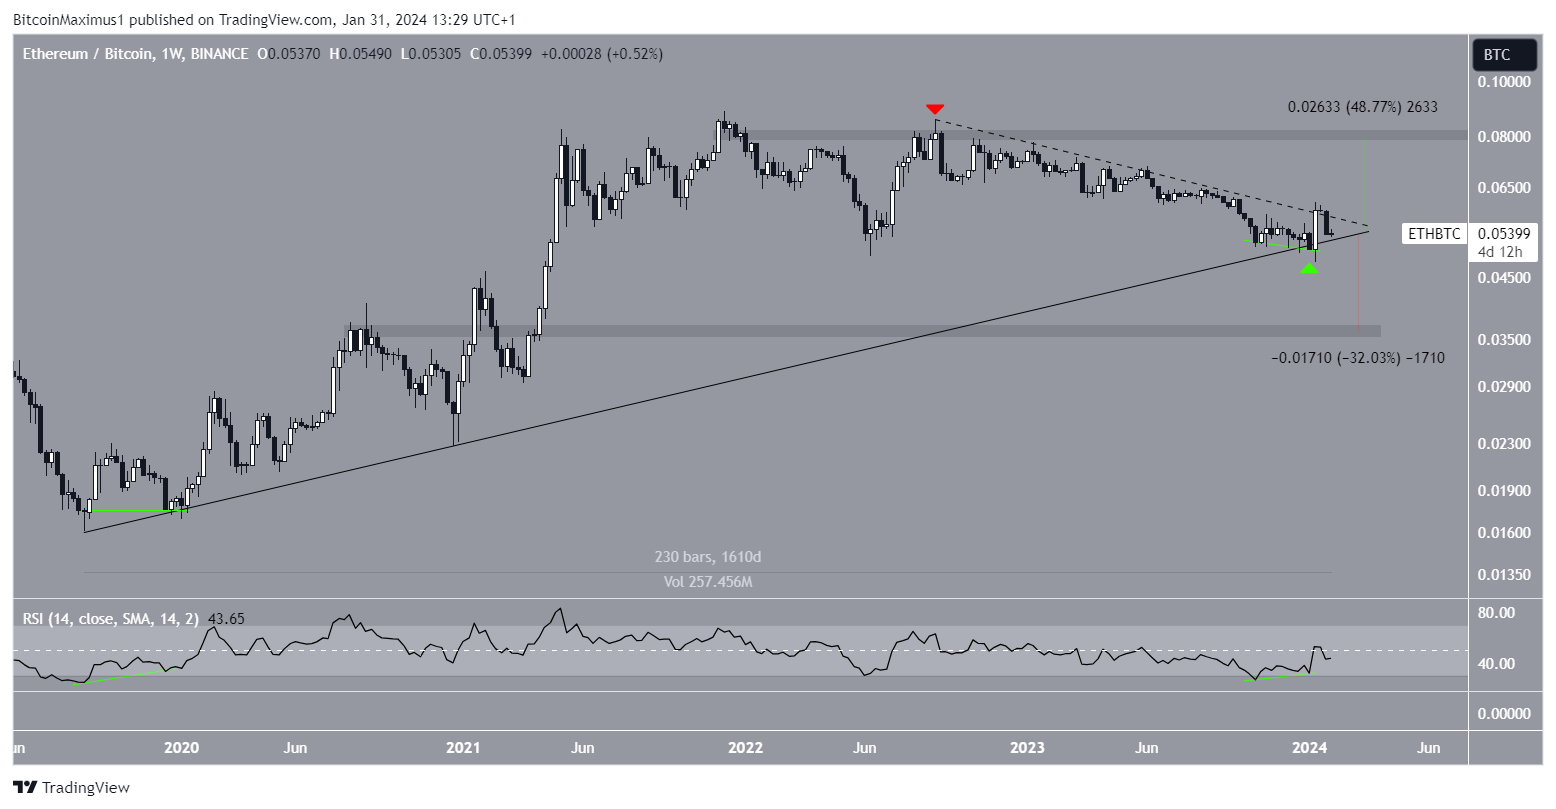 ETH/BTC Weekly Chart. Source: TradingView
Despite the bullish ETH price prediction, a weekly close below the ascending support trend line can trigger a 30% drop to the closest support at ₿0.036.
Read More: How to Buy Ethereum (ETH) With a Credit Card?
For BeInCrypto’s latest crypto market analysis, click here.
0
1


 Manage all your crypto, NFT and DeFi from one place
Securely connect the portfolio you’re using to start.


0
0