Is It a Good Time to Buy Crypto Right Now?

0
0

Crypto trading volume
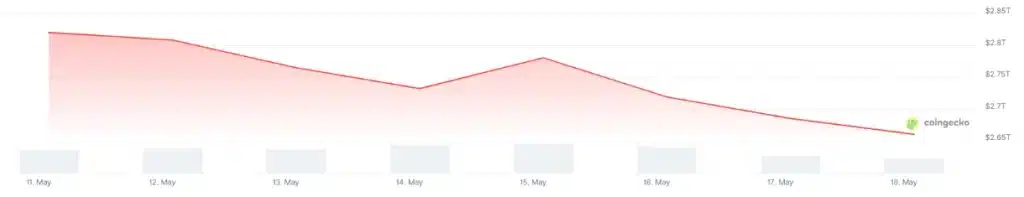
On May 18 (11:00 UTC), the global cryptocurrency market capitalization stands at $2.66 trillion, which is a 1% decrease since Sunday, May 17. It also decreased notably compared to Monday, May 11, when it was $2.78 trillion. After several weeks of green charts, it turned red in both the 14-day and the 30-day periods, while shifting to green in the 3-month timeframe.
At the time of writing, the total crypto trading volume in the last day is at $81.65 billion, lower than the level posted last Monday when it recorded $99.2 billion, and still quite low compared to the levels we’re used to seeing during the last bull run.
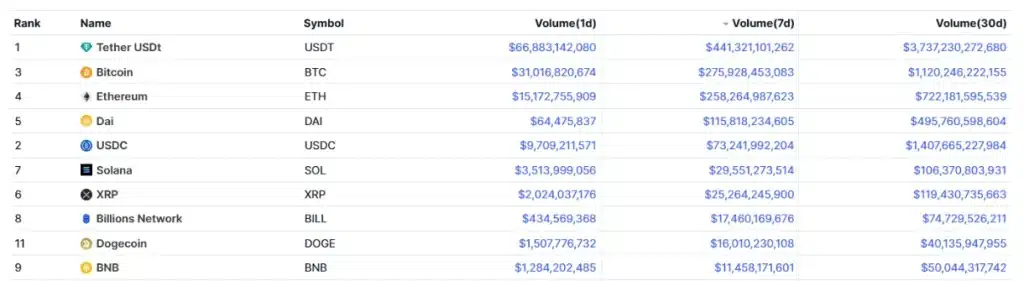
When it comes to the top coins by volume, four coins take the first three spots, depending on the timeframe: Tether (USDT), Bitcoin (BTC), Ethereum (ETH), and USD Coin (USDC). Tether is always at the top though. In the past day, USDT, BTC, and ETH recorded $67 billion, $31 billion, and $15 billion, respectively. Over the last week, USDT posted $441 billion, BTC $276 billion, and ETH $258 billion.
Two weeks ago, DAI entered the ranking for the 30-day period, and it now sits in the 4th and the 5th spot over the past week and the past month, respectively. Below you can see the rankings over the 7-day period.
Altcoins post notable changes in a week
Of the top 100 coins by market cap, only about 15 have seen their prices rise on Monday, May 18, over the past day (at 11:00 UTC), while the majority of them have decreased. Kite (KITE) jumped the most, 10.4% to the price of $0.2373, followed by Hyperliquid (HYPE)’s 9.4% to $0.4507. While Stable (STABLE) and DeXe (DEXE) went up about 5% each, the rest on this list appreciated 2.5% and less. The prices of Bitcoin Cash (BCH) and Pi Network (PI) decreased the most in this category, falling 9.2% and 6.3% to $375 and $0.1495, respectively. Dogecoin (DOGE) comes next on the list, with a 5.8% drop, now changing hands at $0.1049.
In the 7-day timeframe, we find just 10 of the top 100 coins in the green. Two of these posted double-digit increases. KITE is the winner in this category, having appreciated 30.5%. Next up is HYPE’s 11.5%, followed by DEXE’s 8.8% rise to $13.9. On the other side, 31 coins saw drops above 10%. The highest of these is Internet Computer (ICP), which fell 27.5% to $2.53. Jupiter (JUP) posted a 22.8% fall in this period to $0.1957, with Morpho (MORPHO) following, having dropped 20% in seven days to $1.7.
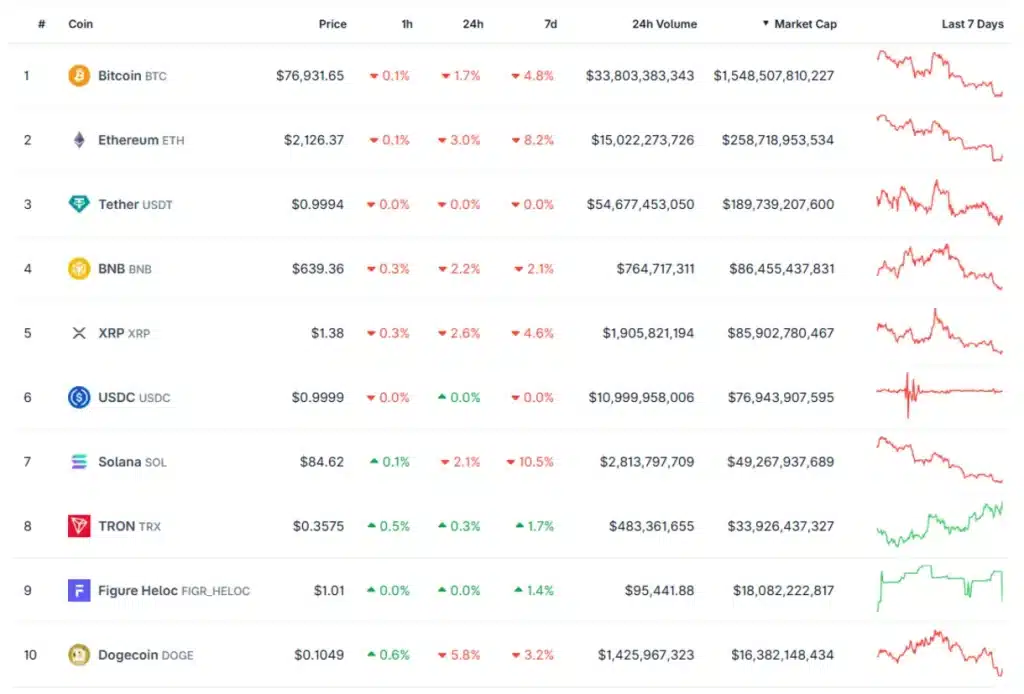
Now, let’s shift our focus to the top 10 coins. On May 18, we find that all but one are red over the past 24 hours (not taking the two stablecoins into account). The changes are not particularly high, however. Dogecoin’s 5.8% fall is the highest in this category. Ethereum (ETH)’s 3% is next, while XRP (XRP) decreased by 2.6%, now trading at $1.38.
The only rise in the category, and its winner by default, is Tron (TRX), though its change is barely noticeable. It’s up just 0.3% in a day to the price of $0.3575.
In the 7-day period, two coins are green, the highest of which is TRX’s 1.7%. It’s followed by Figure Heloc (FIGR_HELOC)’s 1.4% to the price of $1.01.
Of the red coins, Solana (SOL) recorded a 10.5% drop to $84, followed by Ethereum’s 8.2% and Bitcoin (BTC)’s 4.8%.
Bitcoin pulls back to the $76,000 level
Bitcoin has decreased by 1.7% since Sunday, currently standing at $76,931 on Monday. It last saw this level on May 1. In the 7-day category, it posted a 4.8% drop, the third-highest fall among the top 10 coins by market cap. It’s still up in the 1-month period, but just barely, now standing at 0.8%. Also, it’s down 26% in a year and 39% away from its all-time high of $126,080.
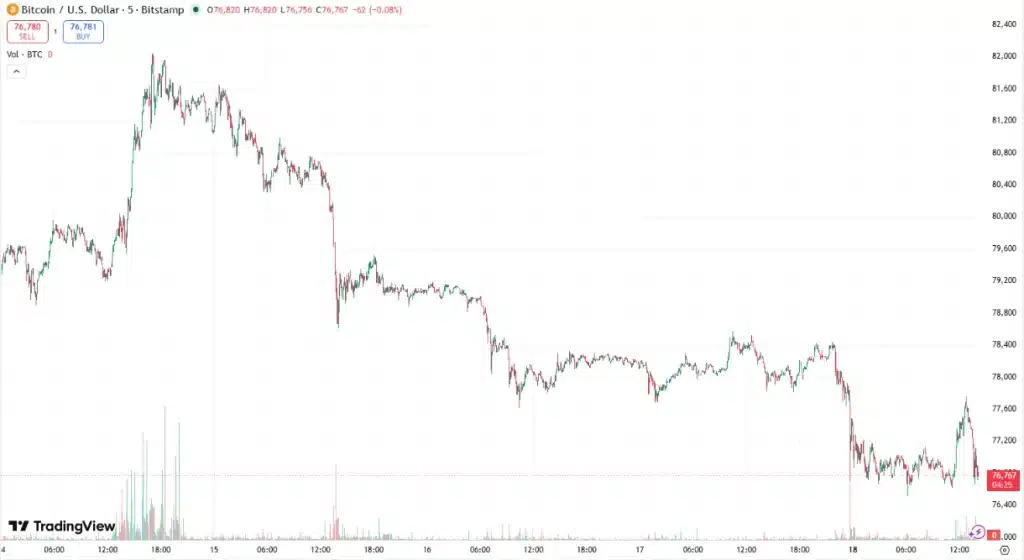
Over the past week, BTC plunged from the intraweek high of $81,939 to the intraweek low of $76,695, which it hit during the last day. The highest point in the past 24 hours was $78,419. Investors are now watching to see if there will be further increases, and if the price will reclaim and hold the key $82,000 level. If not, the rally is unlikely to continue, analysts argue.
BTC and the market in general fell as the increase in US Treasury yields resulted in massive ETF outflows. Moreover, the crypto market saw $670 million in liquidations.
Ethereum falls to $2,100
Ethereum fell 3% in a day, making this the second-largest fall among the top 10 in this timeframe. It’s currently changing hands at $2,126. It fell 8.2% over a week, also the second-largest drop on the top 10 list in this timeframe. It turned red over the other timeframes too. Overall, it’s down 9.9% in a month and 15.2% in a year at the time of writing. It also pulled back by 57% from its ATH of $4,946.
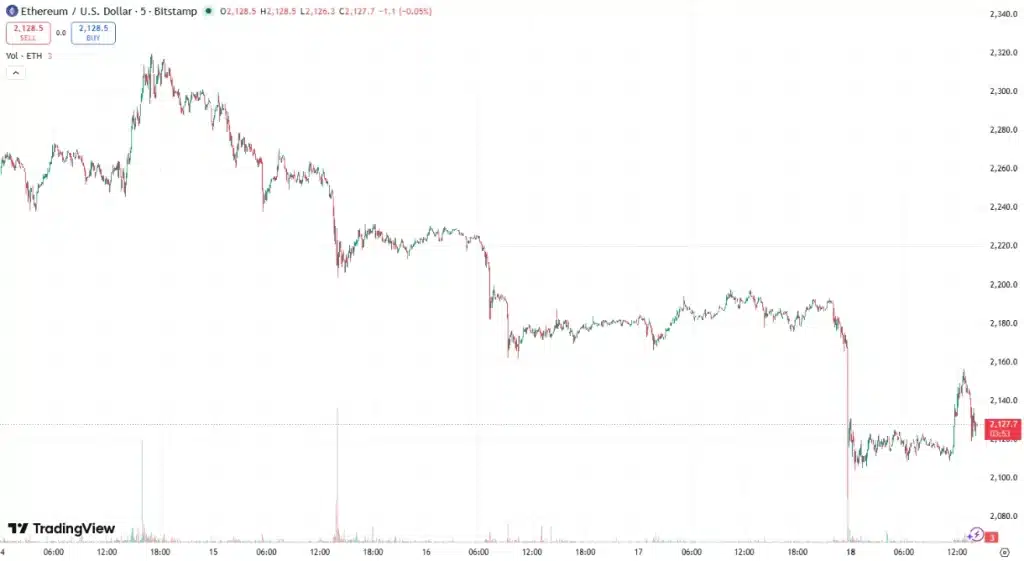
Over the past day, ETH moved from the low of $2,108 to the day’s highest point of $2,192. The price was unable to hold above the $2,400 level, which it had briefly reached. The intraweek low stands at $2,112, while the intraweek high reached $2,341.
The Verus-Ethereum bridge has been drained of approximately $11.58 million, according to security firm Blockaid’s post on Monday. The exploit is ongoing and may be affecting the price.
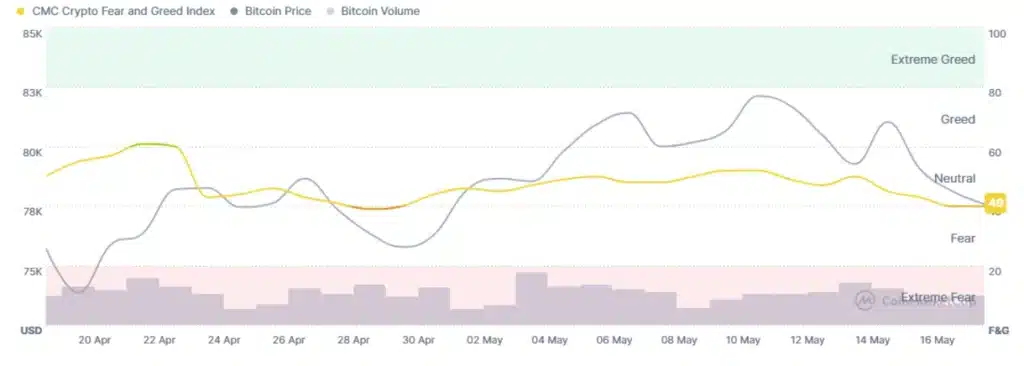
Sentiment falls within neutral zone
The crypto market sentiment is still sitting in the natural zone, but has moved from 50 recorded on Monday, May 11, to 40 seen this morning. Therefore, the sentiment is back to the April 30 level, meaning the lowest it’s been in two weeks. While sitting at the very verge of it, it had no trips to the fear zone this past week, the last time briefly dipping into it on April 29. On a similar note, the last time it briefly visited the greed zone was April 23. All this means that the sentiment largely moved within a range over the past three weeks.
A crypto Fear & Greed Index reading of 40 nonetheless indicates moderate fear in the market. Investors are turning more cautious, and risk appetite is weakening. Traders are generally less confident about short-term price growth. However, we’re not in the extreme panic territory.
Key drivers behind market moves
Two CryptoQuant analysts offered their perspectives amid the market moves last week. One argued that the spot demand is starting to weaken again. “Spot demand remains particularly fragile, even as Bitcoin is currently trading around a major pivot zone, caught between bullish continuation and a renewed corrective phase,” he writes.
The overall environment is currently under macroeconomic and geopolitical pressures, and this uncertainty doesn’t allow for a meaningful support to form, which would renew confidence in risk assets. “For BTC to sustain the bullish momentum that began in early February, it is becoming essential for spot demand to return and support the move more consistently. In the current environment, it will remain difficult for Bitcoin to deliver a more durable upside performance.”
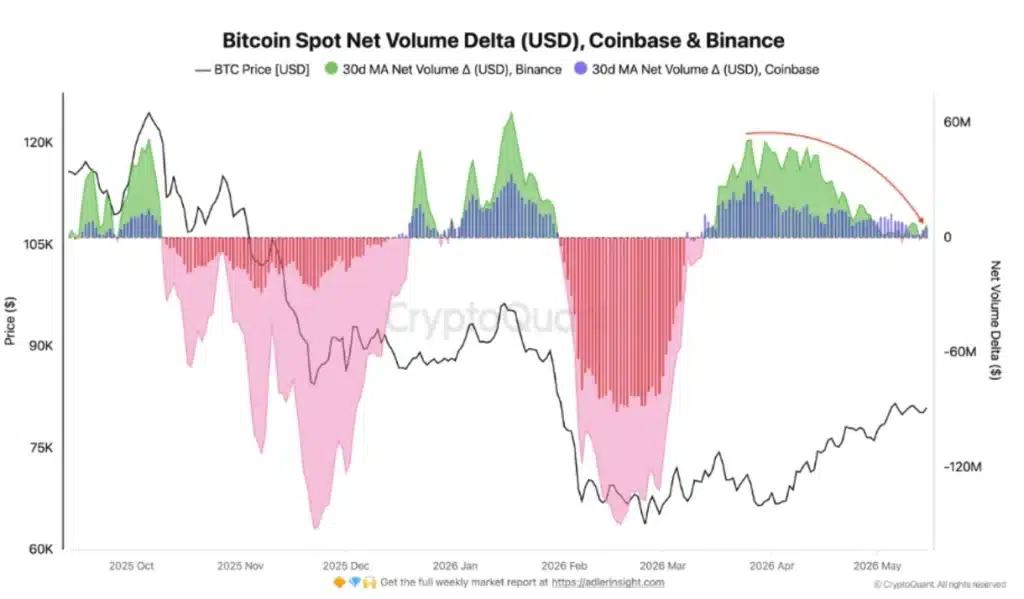
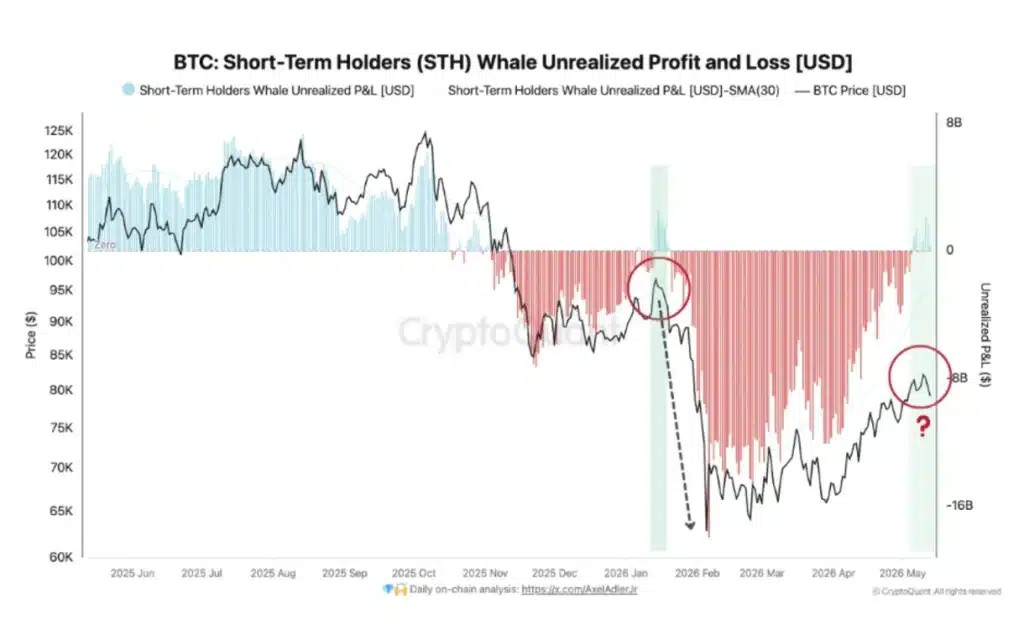
The other analysts noted on Friday that BTC was sitting on the short-term whale cost basis for the third time since October, with the first two tests ending in capitulation. This third test is “a genuine regime decision,” he says.
BTC keeps moving around the realized price of this cohort, near $79,000-$80,000. “If BTC can stabilize above this cohort’s cost basis, unrealized stress disappears and these whales may transition from defensive sellers into passive holders again, removing significant sell-side pressure from the market,” the analyst concludes.
US Treasury yield
The 10-year US Treasury yield hit 4.63% on Sunday night, up 70 basis points since the U began the war in Iran. This is the highest point since February 2025. The Kobeissi Letter post said on Monday that “the US bond market is collapsing in real-time,” as we are now about 4 basis points above the high that prompted Donald Trump’s “90-day tariff pause” in April last year.
“This puts the 10Y Note Yield up +70 basis points since the Iran War, with US mortgage rates now nearing 7.00%+. And, in a sudden turn of events, the odds of rate cuts have collapsed to 2% this year and US inflation is nearing 4%+,” it says.
The US CLARITY Act hits a milestone
The U.S. Senate Banking Committee finally advanced the much-anticipated CLARITY Act last Thursday, making the last week one of the most important crypto-policy weeks of the year. All Republicans and a couple of Democrats voted ‘yes’, though the two Democrats don’t guarantee further support.
The bill will now proceed to the full Senate for final approval, where a minimum of seven Democrats will need to give it support. Committee chairman Tim Scott refused to hold votes on certain amendments, including the stablecoin yield amendment. This has further increased tension across the US regulatory, political, and crypto spheres.

ETFs break the inflow streak
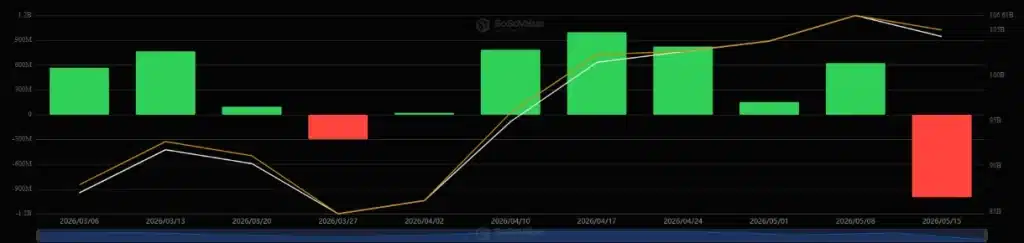
Exchange-traded funds (ETFs) are both a key market driver and an indicator of its direction. When it comes to BTC spot ETFs, over the past week, they broke the six-week weekly net inflow streak with a whopping $1 billion net outflow.
Two days posted minor inflows between $27 million and $132 million. On the other hand, the highest outflow was Wednesday’s $635.23 million. The other two days outflows quickly added up to a billion.
Not a single ETF recorded inflows by the closing time on Friday. BlackRock posted the highest negative flows of $136.25 million, followed by Ark & 21Shares’ $52.48 million.
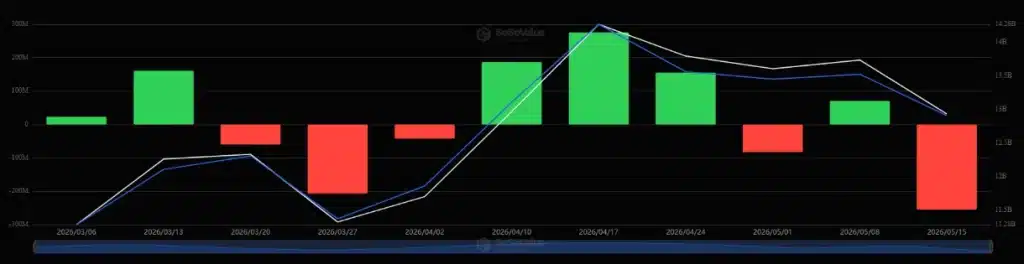
Moreover, the ETH spot ETFs posted a weekly net outflow of $255.11 million between May 11 and May 15. This is the highest weekly negative flow amount since the end of January this year. It’s followed by $206.58 million on March 27.
Notably, the week was fully red, with not a single green day, which we haven’t seen in quite a while. Tuesday posted the highest negative flow amount of $130.62 million. Friday is next with outflows of $65.65 million.
Speaking of Friday, three ETFs saw flows, and all three were negative. BlackRock is at the top of this list with $50.35 million in outflows. Fidelity let go of $11.08 million, while Grayscale said goodbye to $4.22 million.
BTC and ETH outperformed
Escalating Middle East tensions and rising oil prices affected the market, as higher energy prices increased inflation fears globally. This also exerted pressure on the traditional risk assets. All of this resulted in an interesting dynamic where crypto showed relative resilience compared with some traditional markets.
Analysts noted that both BTC and ETH outperformed during parts of the geopolitical turmoil. This reinforced the growing narrative that institutional investors are beginning to treat Bitcoin more like a strategic macro asset than simply a speculative trade.
Events to watch
BTC holding $82,000
Glassnode argues that BTC’s $82,000 remains the key area. The analysts write that the largest pocket of negative gamma sits just above spot, near this $82,000 mark. “A move into that region could reinforce momentum through dealer hedging flows. Higher up, positive gamma near 85K may act as a stabilizing zone,” they say.
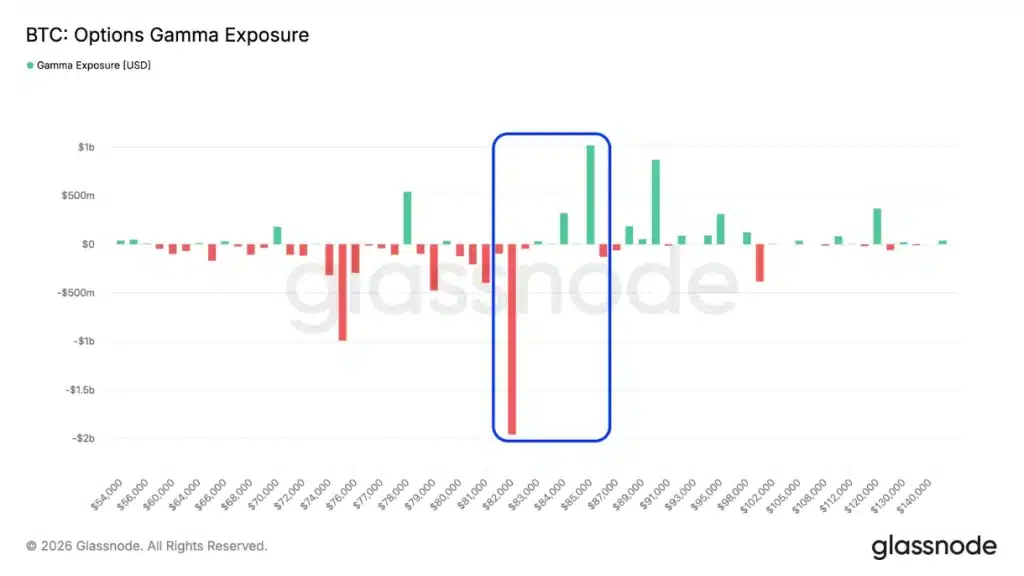
Therefore, $82,000 acts as the trigger zone, while $85,000 is the next upside test. Positioning around the $85,000 strike remains balanced. “Bought and sold call premium continue rising together. Traders are actively positioning around 85K, but without a strong directional bias yet,” the analysts conclude.
US Federal Reserve policy signals and Treasury yields
Crypto markets remain highly sensitive to US monetary policy expectations, and it’s likely this will continue for the foreseeable future. Traders will closely watch Fed commentary, bond yields, and economic data this week for signs about whether interest rates could stay higher for longer. Rising yields typically pressure risk assets like Bitcoin and altcoins, and softer macro signals could improve sentiment and support another crypto rally.
The key events planned for this week include the FOMC meeting minutes on May 20, which could provide hints about future interest-rate policy and inflation concerns, but also about any potential division among Fed officials on rate cuts. PMI and other economic data follow on May 21, while several Fed officials are scheduled to speak this week.
The CLARITY Act developments
The market is very focused on the further developments around the CLARITY Act, as well as the broader US crypto regulation following the latest momentum in Congress. Any signs of progress toward clearer rules for digital assets could strengthen institutional confidence and support ETF inflows. However, further delays or political pushback (as had been the case until just recently) could hurt sentiment across the sector, though just temporarily.
Spot Bitcoin ETF flows
This is still one of the strongest indicators of real market demand. While inflows are currently steady rather than explosive, they continue to provide structural support for BTC prices by absorbing part of the sell pressure and helping limit deeper corrections. Keep an eye on future moves as well.
Is it a good time to buy crypto right now?
Based on what we’ve seen above, this is a relatively good time to buy crypto, but for different investor cohorts, it’s advisable to wait. Long-term investors may choose gradual accumulation during the current volatility, but this is a high-risk environment with fast sentiment swings for short-term traders. Most investors are waiting for confirmation, looking to see if BTC can sustainably reclaim the $82,000 zone.
Institutional demand is still strong, providing structural support for BTC, and the regulatory momentum is rising. However, macro pressure has increased. Rising Treasury yields, inflation concerns, and Middle East tensions recently pushed Bitcoin back below $80,000 and triggered heavy liquidations. Overall, short-term volatility is likely this week. Markets are watching Fed signals, bond yields, ETF flows, and geopolitical developments closely. Analysts generally expect choppy trading rather than a straight breakout.
Disclaimer: This article is for informational purposes only and does not constitute financial, investment, or trading advice. Cryptocurrency markets are highly volatile and involve significant risk. Always conduct your own research and consult with a qualified financial advisor before making any investment decisions. Never invest more than you can afford to lose.
The post Is It a Good Time to Buy Crypto Right Now? appeared first on TechGaged.com.
0
0
 Manage all your crypto, NFT and DeFi from one place
Securely connect the portfolio you’re using to start.