Monero Bull Run Accelerating, XMR-BTC Price Chart Signals
0
0

This is a daily technical analysis by CoinDesk analyst and Chartered Market Technician Omkar Godbole.
Leading privacy-focused cryptocurrency monero (XMR) has outperformed bitcoin BTC this year, and the trend is likely to continue in the coming weeks.
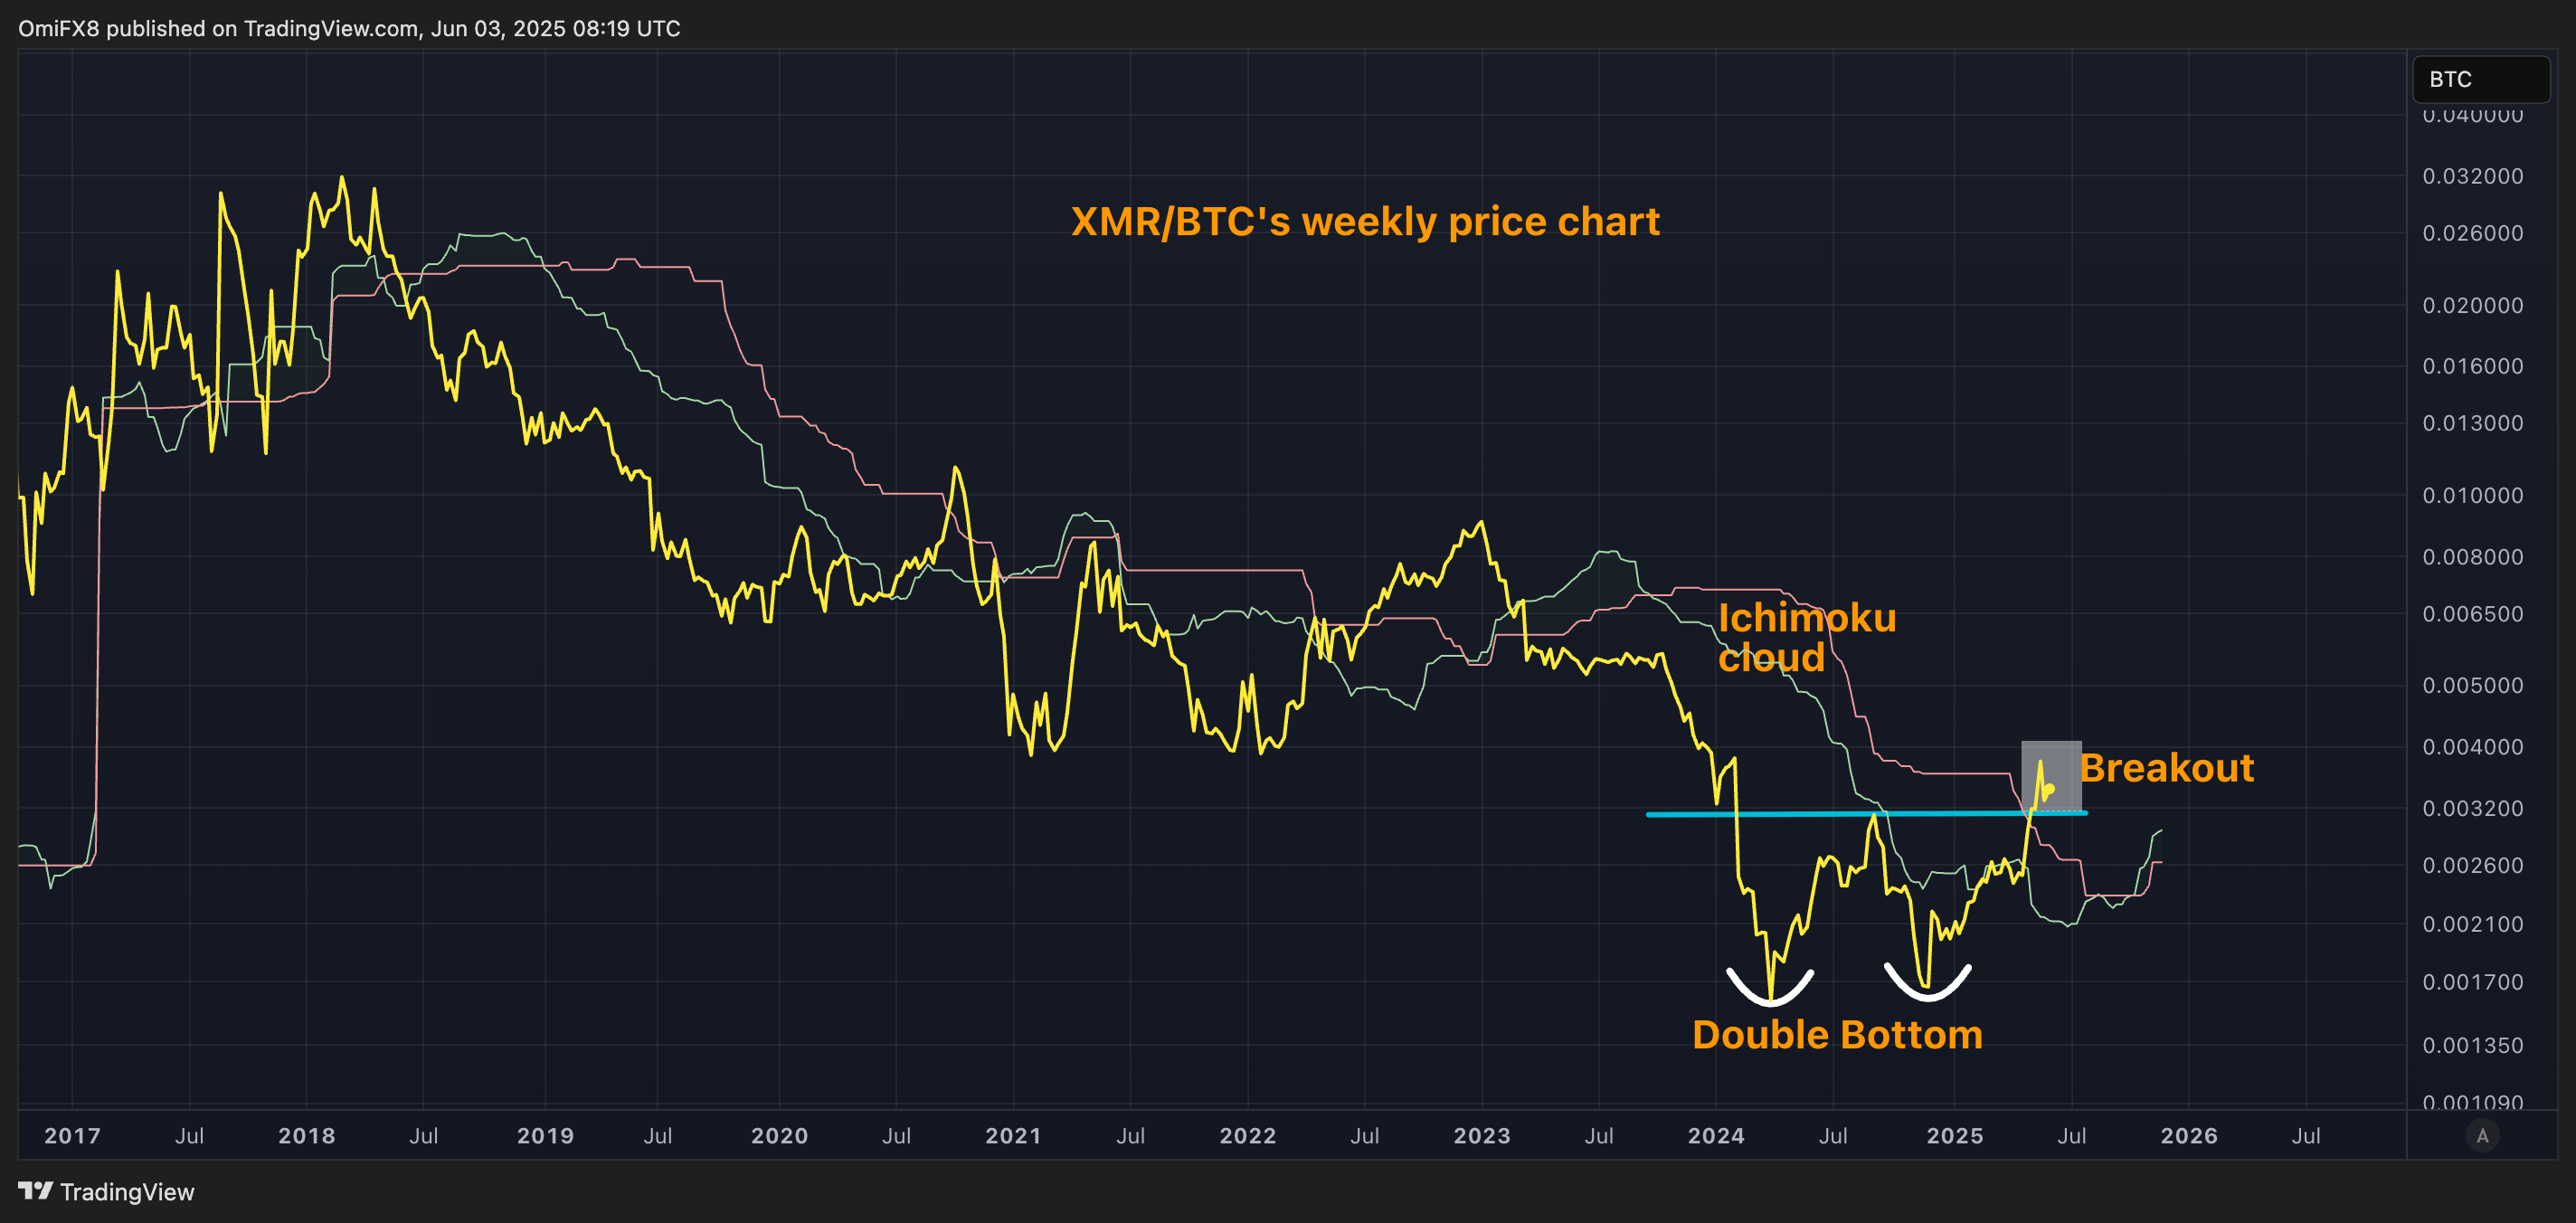
That's the message from the XMR-BTC ratio trading on Poloniex. The ratio representing XMR's bitcoin-denominated price recently rose to the highest since January 2024, confirming a "double-bottom" breakout on the weekly time frame.
The double bottom comprises two consecutive peaks with lows at about the same price, representing an exhaustion of the preceding downtrend. It also includes a horizontal line, called the neckline resistance, drawn connecting the temporary recovery between the two troughs.
A move past the neckline is said to confirm the breakout or a bearish-bullish shift in the market trend.

The ratio carved out two troughs at around 0.00165 early this year and recently broke above the neckline resistance, indicating a double-bottom bullish reversal.
In other words, XMR has likely begun a new bull run relative to bitcoin. The pair's move above the Ichimoku cloud also suggests the same. The bullish outlook risks invalidation in case of a renewed dip below the double top support (former resistance).
Monero has surged 86% this year, outperforming Bitcoin's 12% rise by a significant margin, according to CoinDesk data.
0
0
 Manage all your crypto, NFT and DeFi from one place
Securely connect the portfolio you’re using to start.


