
SODAX Price Prediction 2026-2030: What the Market Data Shows?

0
0
Traders scanning SODAX price prediction charts this week found something worth a second look. SODA broke a multi-week pattern almost overnight. Turns out, the move wasn't random.
This piece walks through what the data actually shows. Section by section. No skipped numbers.
SODAX Price Prediction Snapshot
Analysis updated: September 22, 2026, 14:30 UTC
Metric | Current SODAX Data |
Price | $0.01854 |
24H Change | +99.8% |
Market Cap | $21.44M |
Volume (24H) | $313,698 |
Trend | Bullish |
RSI (14, 4H) | 80.83 |
Support | $0.008164 |
Resistance | $0.02627 |
Next Target | $0.03696 |
Invalidation | Below $0.00789 |
SODAX Price Prediction Today
SODA is trading at $0.01854, up 99.8% over 24 hours. The market cap sits near $21.44 million, with a fully diluted valuation close to $29.79 million, per CoinGecko data.
That's a big single-day jump for a token most desks weren't watching a week ago.
Trading volume, though, tells a quieter story. Just $313,698 changed hands in 24 hours. A near-100% move on thin volume is a flag, not a dismissal.
The current trend reads bullish. But bullish doesn't mean risk-free. And a move this fast usually invites a cooldown before it invites a continuation.
SODAX Technical Analysis and Key Levels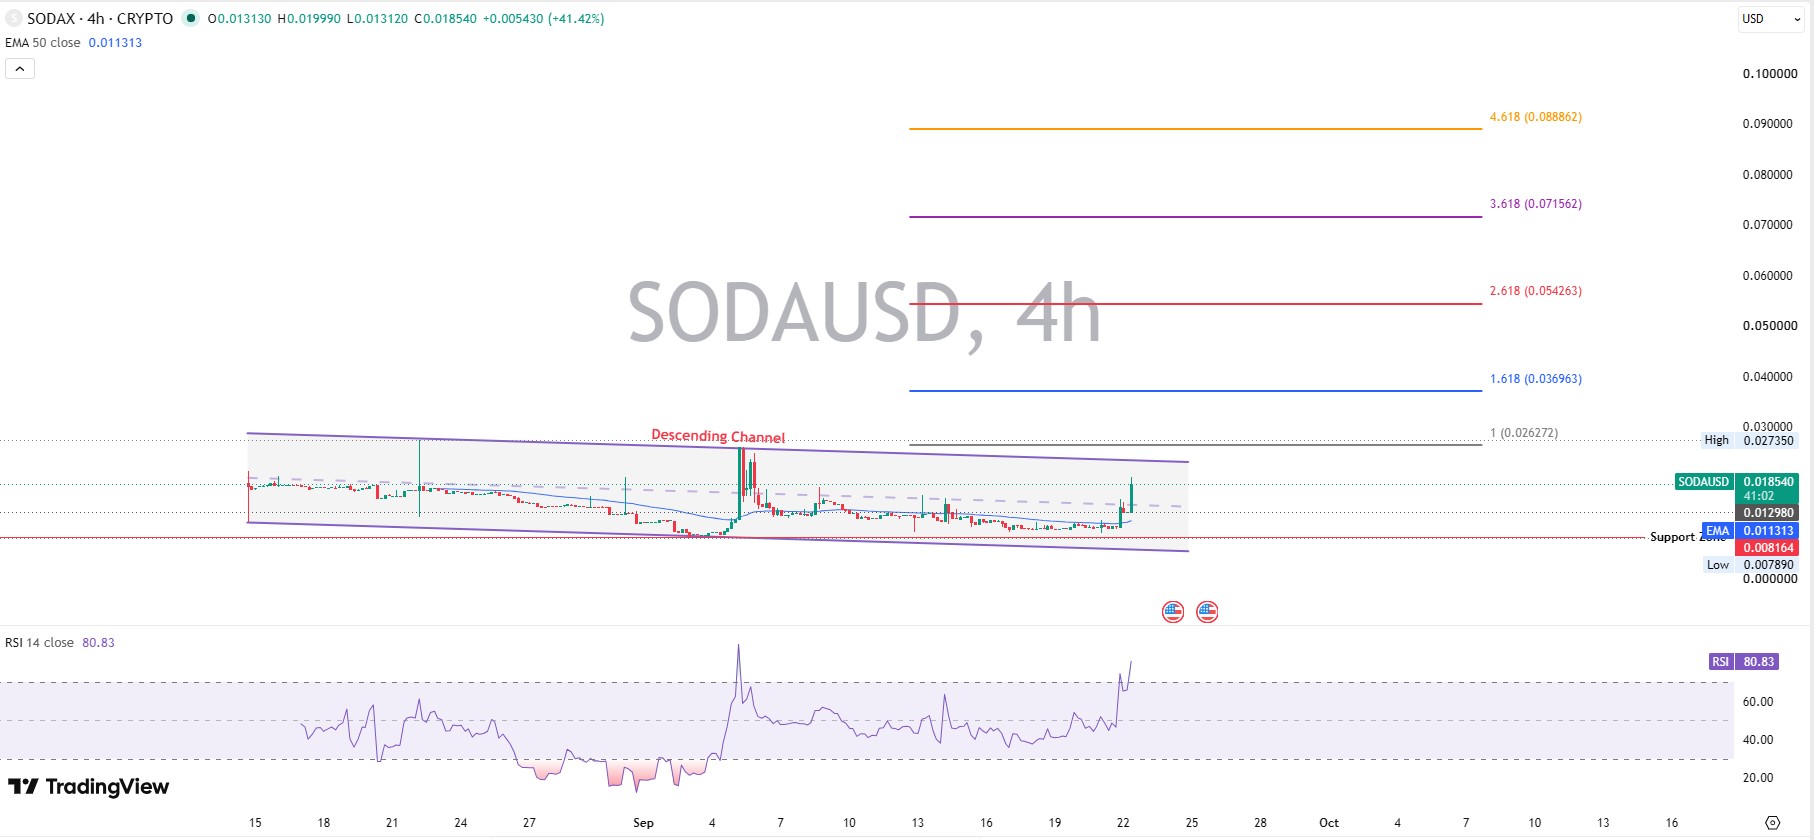
The 4-hour chart on TradingView shows SODA breaking out of a descending channel that had capped price action since mid-August.
SODAX Support Levels
The nearest support sits at the 50-period EMA, currently near $0.01131. Price is trading well above it, which keeps the short-term structure intact.
Below that, a firmer support zone runs from $0.008164 down to $0.00789. That's roughly where the token bottomed on September second.
If that zone breaks, the setup weakens fast. Traders watching exchange listing activity will likely treat a break of $0.00789 as the line that separates a healthy pullback from a failed breakout.
SODAX Resistance Levels
Immediate resistance lines up near $0.02627, a level drawn from the prior swing high on the chart. SODA is trading just below it as of this writing.
A clean trade above $0.02627 on rising volume would confirm the breakout. Without that confirmation, the move risks stalling right where it stands now.
Further out, $0.03696 marks the next real test. Beyond that, $0.05426 and $0.07156 come into view, though those levels assume the current momentum holds through several more sessions. Traders tracking upcoming protocol milestones will want those dates lined up against this chart.
RSI, MACD, and Volume
When we pulled up the RSI, the reading sat at 80.83 on the four-hour chart. That's deep overbought territory, the kind that historically precedes at least a short pause.
MACD tells a different part of the story. The MACD line sits at 0.000980, above the signal line at 0.000715, with a positive histogram of 0.000265. That's bullish momentum, and it's expanding, not fading.
So which indicator wins?
Basically, both are right at once. RSI flags short-term exhaustion. MACD confirms the broader push higher hasn't broken down. When indicators disagree like this, volume usually settles it, and current volume is too thin to settle anything convincingly.
SODAX Price Prediction 2026
The scenarios below cover the rest of 2026, based on the current structure and the fee mechanics described further down.
Scenario | Price Range | Main Condition | Invalidation |
Bear | $0.010 - $0.015 | Support failure, thin liquidity | Recovery above $0.02627 |
Base | $0.018 - $0.030 | Consolidation, steady demand | Break below EMA50 support |
Bull | $0.037 - $0.054 | Breakout confirmed, volume expands | Failed breakout below $0.02627 |
None of these is a promise. They're ranges tied to conditions, and conditions change. A full breakdown of ongoing price prediction coverage tracks how these scenarios shift week to week.
SODAX Price Prediction 2027-2030
Longer horizons get compact treatment here, because certainty shrinks the further out a forecast reaches.
Year | Bear | Base | Bull | Expected Market Cap (Base) | Main Driver |
2027 | $0.012 | $0.028 | $0.048 | $32M | Adoption |
2028 | $0.015 | $0.035 | $0.065 | $44M | Protocol activity |
2029 | $0.018 | $0.045 | $0.085 | $61M | Liquidity and fees |
2030 | $0.022 | $0.058 | $0.110 | $87M | Network growth |
These figures come from market cap assumptions layered onto a mostly-fixed supply, not arbitrary growth-rate stacking. The expected market cap column reflects the base scenario, using circulating supply gradually approaching the 1.5 billion cap. Broader crypto market coverage offers useful context for how sector-wide cycles tend to interact with tokens at this size.
SODAX Fundamentals: Supply, Burn, and Network Reach
SODA has a maximum supply of 1.5 billion tokens. Roughly 1.079 billion were circulating as of September 17, 2026, according to official SODAX data.
There's no future minting. No emission schedule. No vesting cliff waiting to unlock. The supply cap has already been reached.
Protocol fees get split three ways: 60% into liquidity inventory, 20% into programmatic buyback and burn, and the remaining 20% into staking. The buyback mechanism uses real fee revenue to purchase SODA on the open market and remove it from supply permanently.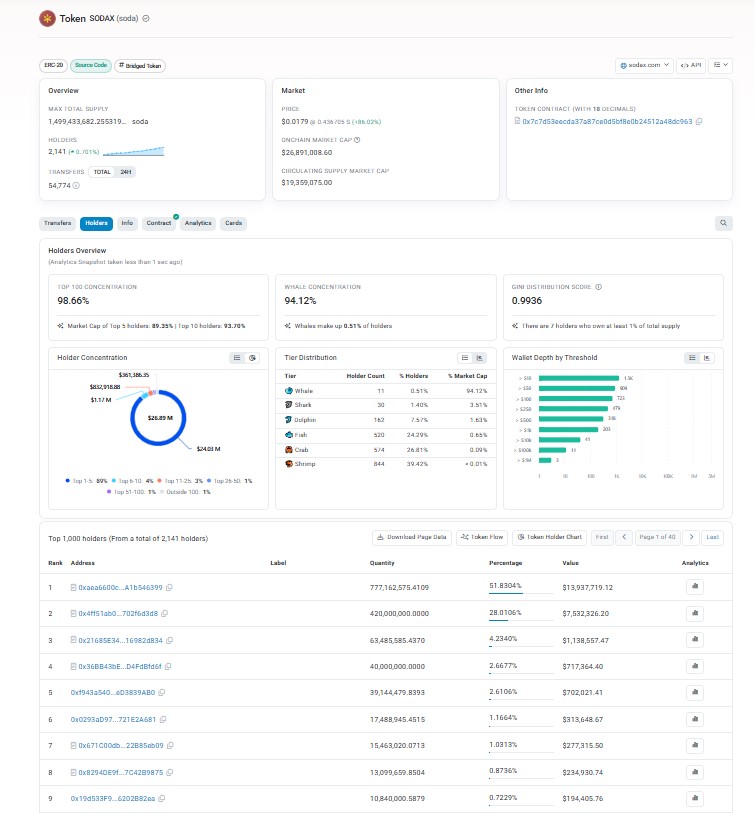
That raises the actual question worth asking. Does rising network activity generate enough fee-driven burn pressure to matter for valuation? When we cross-checked holder data on Sonicscan, the top address alone controlled over half of circulating supply. That concentration is worth watching alongside any burn narrative.
SODAX currently operates across 21 networks, supporting cross-network trading, lending, borrowing, and settlement. That's a wide footprint for a token still under a month removed from its low. Airdrop-driven ecosystem incentive programs tend to accelerate that kind of cross-chain adoption when they land.
What Could Push SODA Higher or Lower
Breaking: SODAX confirmed a partnership with Port66, an on-chain luxury marketplace, on September 16. Buyers can now pay across more than 20 networks SODAX supports. No separate bridging step required.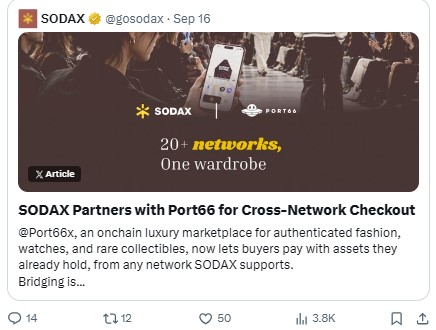
That's a real utility expansion, not a speculative rumor. It showed up directly on SODAX's official account, and checkout integrations like this tend to compound quietly over months rather than spike overnight.
On the downside, thin volume remains the biggest risk. A near-100% rally on $313,698 of turnover can reverse fast. And whale concentration means a handful of wallets could move the price sharply either way.
New exchange listings, expanded presale and launch activity across the sector, and continued burn pressure from protocol fees would all support the bull case. Broader risk-off sentiment across crypto markets would work against it just as easily.
When the RSI, the volume figures, and the whale concentration data get pulled up side by side, the picture that emerges isn't purely bullish or bearish. It's a breakout that needs confirmation. That's where things stand.
Disclaimer
This article is for informational purposes only and does not constitute financial, investment, or trading advice. Cryptocurrency markets are highly volatile, and price predictions carry considerable uncertainty. Readers should conduct independent research and consult a qualified financial advisor before making any investment decisions.
0
0
 Manage all your crypto, NFT and DeFi from one place
Securely connect the portfolio you’re using to start.