
Dogecoin Price Prediction: $DOGE Eye Breakout as Bulls Return Strongly

0
0
Dogecoin Price Prediction: DOGE Coils Inside a Symmetrical Triangle as Bulls and Bears Fight for the Apex
This Dogecoin price prediction lands at a decisive moment for the chart. Dogecoin isn't moving in isolation right now.
It rarely does. Every meme coin chart eventually answers to what Bitcoin and Ethereum are doing, and DOGE's current squeeze is playing out while broader crypto majors dictate the risk appetite that memecoin traders lean on for confirmation.
DOGE Price Snapshot
Dogecoin price is trading at $0.07333, up 0.9% over the last 24 hours, having ranged between $0.07251 and $0.07381 in that window.
The token carries a market cap of $11.379B against a fully diluted valuation of $12.531B, with a circulating supply of $155.17B DOGE out of a 170.882B total supply and no max supply cap. 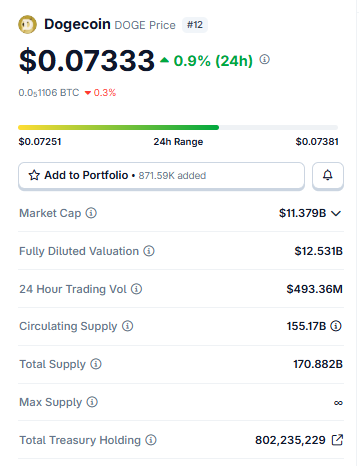
Source: Data Taken From CoinGecko as of 22/07/2026. Figures may vary slightly across other tracking websites.
Which keeps long-term dilution part of every serious Dogecoin price prediction discussion.
24-hour trading volume sits at $493.36M, and the network's treasury currently holds 802,235,229 DOGE.
Liquidation Heatmap: Shorts Have Been Paying the Price
The liquidation heatmap for Dogecoin tells an interesting short-term story.
Over the last 24 hours, total liquidations reached $471.86K, split between $196.68K in long liquidations and a heavier $275.18K in short liquidations, meaning traders betting against DOGE have taken the bigger hit as the price pushed higher into this range.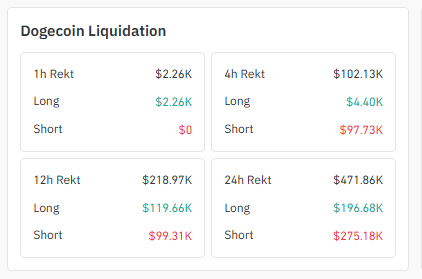
Source: Liquidation Data Taken From Coinglass.
That short-liquidation dominance is even sharper on the 4-hour window: $102.13K total, with shorts accounting for $97.73K of it against just $4.40K in long positions.
This suggests a sharp squeeze move recently forced short sellers out of their positions.
The most recent 1-hour data flips the picture slightly: $2.26K in liquidations, entirely from longs, with zero short liquidations.
That's a small signal of near-term profit-taking or a minor pullback after the squeeze, consistent with price cooling off right at trendline resistance.
Exchange Volume Heatmap
Looking at the exchange volume distribution for Dogecoin futures, Binance dominates with $253.44M in volume, followed by OKX at $161.68M.
Bybit ($64.07M), MEXC ($53.66M), Gate ($35.35M), and Bitget ($24.57M) round out the mid-tier venues, with WhiteBIT, Bitunix, KuCoin, BingX, Hyperliquid, and LBank contributing smaller shares. 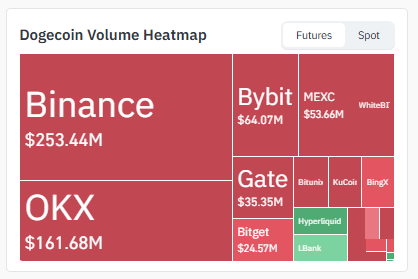
Source: Volume Heatmap Data Taken From Coinglass.
This concentration on Binance and OKX means liquidity for any breakout or breakdown move is likely to be led by these two venues first, with other exchanges following price rather than setting it.
Social Sentiment: Merge Mining Debate Resurfaces
Dogecoin News Analysis : The $DOGE community had a lively exchange this week over merge mining security after Dogecoin Foundation developer Paulo Vidal raised questions about whether the network leans too heavily on Litecoin for security through merge mining.
Dogecoin co-founder Billy Markus pushed back on the concern, pointing critics toward the original Bitcoin white paper and arguing that miners simply follow economic incentives. 
Source: Data from the @BSCN account on x
He dismissed the idea of removing merge mining as "dumb and pointless."
While this is a governance and technical debate rather than a price catalyst, it reflects an active, engaged community, a factor that historically supports Dogecoin's resilience during broader market chop.
DOGE vs Other Meme Coins: Where It Stands
| Factor | Dogecoin (DOGE) | Typical Large-Cap Meme Coin |
|---|---|---|
| Supply Model | No max supply, ~155B circulating | Often fixed or capped supply |
| Exchange Liquidity | Deep, led by Binance & OKX | Varies, often thinner |
| Market Cap Rank | Top-15 asset | Usually lower-ranked |
| Volatility Driver | BTC/ETH correlation + community sentiment | Often narrative and social media-driven |
4H Chart: Falling Trendline Still in Control
Zooming into the TradingView chart 4-hour timeframe, DOGE has been respecting a falling trendline for several sessions, and the price is once again testing it near the current $0.07337 mark.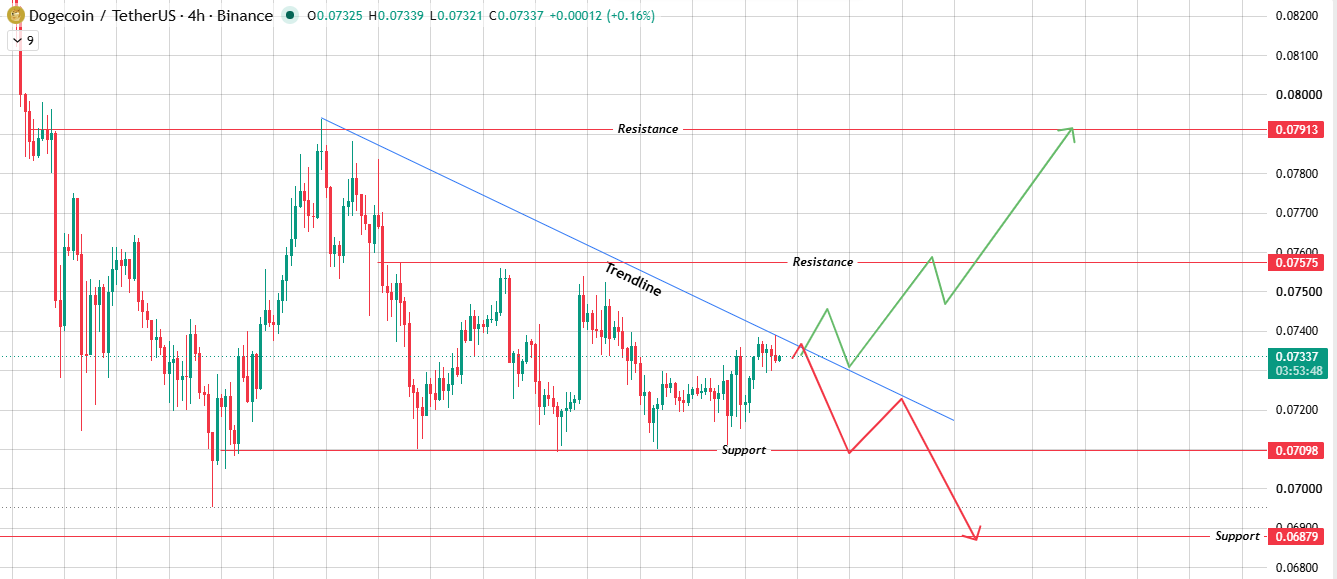
Source: Chart Taken From TradingView.
A break and close above this trendline would flip the short-term structure bullish, with $0.07575 as the first resistance level and $0.07913 as the extended target if momentum holds.
If the trendline continues to reject price and DOGE fails to close above it, the setup favors a move back down toward the $0.07098 support zone. A breakdown below that level, without buyers stepping in, would open the path to $0.06879.
1D Chart: The Symmetrical Triangle Apex Decision
Any short-term Dogecoin price prediction right now has to start with the daily chart, which shows DOGE inside a well-defined symmetrical triangle, with converging trendlines meeting almost exactly where price is trading right now.
This apex zone is where triangles typically resolve; the range has been squeezed too tight for consolidation to continue much longer.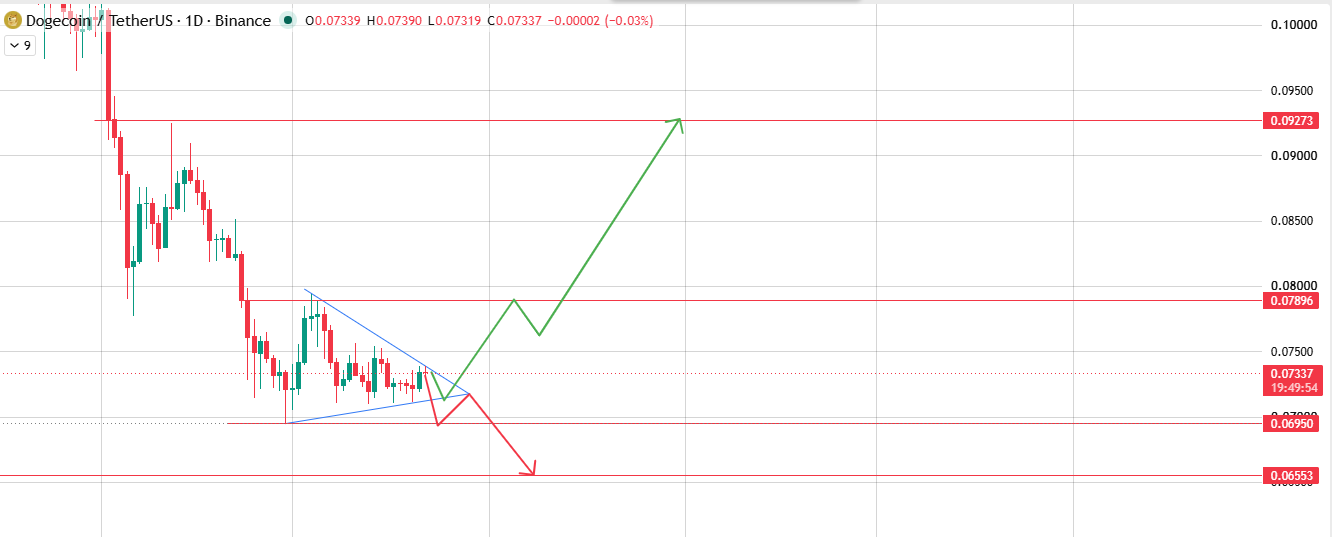
Source: Chart Taken From TradingView.
If the upper boundary of the triangle breaks and holds, the first target is the resistance level at $0.07896.
A clean push through that level, with follow-through buying, extends the move toward $0.09273, the next major supply zone visible on the chart.
If the lower boundary breaks first, DOGE is likely to test the support zone at $0.06950.
This is where a rejection attempt is probable, since it's the first meaningful floor beneath the triangle. If sellers stay active and that zone fails to hold, the next level in view is $0.06553.
Three-Scenario Price Outlook
Each price target below is derived strictly from the chart levels visible on the 1D and 4H timeframes, with no extrapolated Fibonacci extensions or arbitrary round numbers.
| Scenario | Trigger | Near-Term Target | Extended Target |
|---|---|---|---|
| Bullish Breakout | 1D triangle upper boundary breaks, and the 4H trendline is reclaimed. | $0.07896 / $0.07575 | $0.09273 / $0.07913 |
| Range-Bound (Base Case) | Price stays trapped at the apex, with no confirmed breakout. | $0.07098 – $0.07896 | Triangle resolution pending |
| Bearish Breakdown | 1D triangle lower boundary breaks and 4H support fails. | $0.06950 / $0.07098 | $0.06553 / $0.06879 |
-
Symmetrical Triangle: A chart pattern formed by a descending resistance line and an ascending support line converging toward an apex, typically preceding a breakout in either direction.
-
Falling Trendline: A downward-sloping resistance line connecting lower highs, used to track bearish momentum until it's broken.
-
Liquidation Heatmap: A visualization of forced position closures (longs or shorts) across exchanges, often used to identify where leveraged traders are getting stopped out.
-
BTC Dominance: The percentage of total crypto market cap held by Bitcoin, often used as a gauge of risk appetite for altcoins and meme coins.
Methodology
This Dogecoin price prediction is based on technical analysis of 1D and 4H DOGE/USDT chart data (Binance), liquidation figures across 1h/4h/12h/24h windows, exchange futures volume heatmap data, and current market statistics as of July 22, 2026.
All price levels referenced are drawn directly from charted support/resistance and trendline structures; no levels have been extrapolated beyond what the charts show.
This is not financial advice; always do your own research before trading.
Final Outlook
The bottom line for this Dogecoin price prediction: DOGE's next move hinges on which boundary of its symmetrical triangle gives way first, and that decision is likely to be shaped as much by Bitcoin and Ethereum as by DOGE.
Price action, as by Dogecoin-specific flows, the tight ETH correlation, and the broader BTC dominance trend that meme coins tend to follow during risk-on or risk-off swings.
A confirmed bullish breakout above $0.07896 keeps $0.09273 in play, while a failure to hold the triangle's lower boundary shifts focus to $0.06950 and, if that gives way, $0.06553.
Until one side wins the apex, DOGE traders should treat both directions as live and size positions accordingly.
Disclaimer: This article is for informational purposes only and does not constitute financial advice. Cryptocurrency markets are highly volatile; always conduct independent research before making investment decisions.
0
0


 Manage all your crypto, NFT and DeFi from one place
Securely connect the portfolio you’re using to start.


0
0

0
0

0
0