Market watcher Casi analyzes XRP corrective phase with Elliott Wave theory, highlighting key support levels and potential for a breakout into Wave 3.
The analysis comes as XRP has been navigating through a narrow trading range between $2.04 and $2.18 from April 16 to 22. The price saw several fluctuations during this period, including a sharp surge on April 21, where the value briefly spiked to $2.14 before retreating to $2.07.
Amid this performance, Casi Trades has called attention to key support levels and potential breakout signals for the crypto asset.
Analysts Watch XRP's Corrective Phase
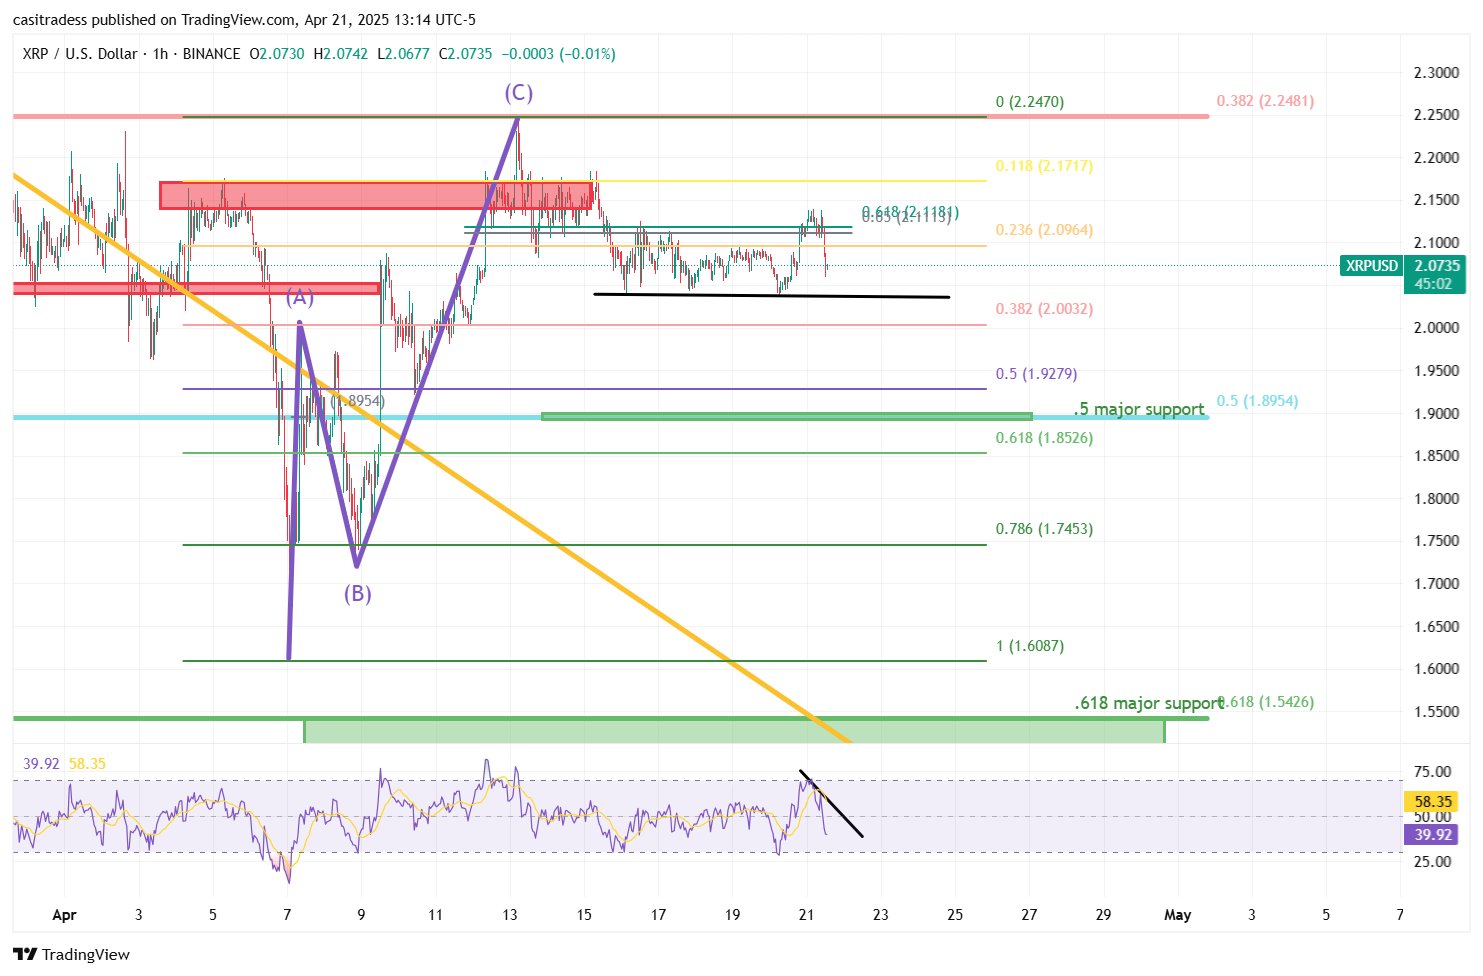
Casi Trades presents a view of XRP’s current price action. According to a previous April 17 analysis, XRP has been in a corrective phase, identified as Wave 2 in the Elliott Wave structure. This phase typically involves a pullback and comes after a significant upward move from the previous wave.
Meanwhile, in the latest chart, Casi Trades shows how XRP attempted to break out alongside Bitcoin but faced resistance at the 0.618 Fibonacci retracement level, which is located just above $2.10. According to the analyst, this resistance point is often seen as a point of exhaustion for price movements, leading to a quick rejection.
In her analysis, Casi Trades also identified the ABC wave, which propelled XRP towards $2.25 in mid-April, and suggests that, similar to wave C, wave 3 is on the verge of unfolding.
XRP Elliot Wave Structure
Casi Trades highlights the $1.90 and $1.55 levels as key support zones that could prevent further decline. If XRP manages to hold above these levels, the likelihood of a breakout into Wave 3 increases. This wave, in Elliott Wave cycles, is known for being the most powerful upward phase.
Extension targets for XRP, according to the April 17 analysis, suggested potential price levels of $6.50 at the 1.618 Fibonacci extension, $9.50 at the 2.618 extension, and possibly exceeding $12 at the 3.618 extension.
Indicator Point to Weakened Bullish Strength
In addition to Elliott Wave theory, Casi Trades incorporates momentum indicators further to assess XRP's trajectory in the latest chart. The Relative Strength Index (RSI), which tracks price momentum, currently shows a neutral reading of 39.92.
This indicates that XRP is neither overbought nor oversold at present. However, there is a noticeable bearish divergence on the RSI, as the indicator is trending downward while the price has been either moving sideways or slightly upward.
Notably, this suggests weakening momentum, confirming the notion that XRP may soon complete its corrective phase and break out if key support levels hold.
Further Optimism for Major Upsurge
Meanwhile, another analyst, Papa, has a more bullish outlook on XRP. He argues that XRP could be poised for a significant rally, drawing parallels with historical patterns observed during its 2017/2018 bull run.
Papa points to the formation of a symmetrical triangle pattern in late 2017, which marked the beginning of a massive rally. After an initial surge of 7,875% from $0.0055 to $0.3988 in 2017, XRP faced a pullback and consolidation, which then led to a breakout that saw the cryptocurrency soar 1,762% to its all-time high of $3.31 in January 2018.
Papa believes that XRP is now forming a similar consolidation pattern. Following a surge from $0.50 in November 2024 to a high of $3.39 in January 2025, XRP has encountered a pullback, dropping 39% from its peak.
However, instead of a symmetrical triangle, XRP is currently trading within a parallel channel. Papa suggests that if XRP breaks above the $3 resistance level, it could trigger a similar uptrend to the one seen in 2017. His projections suggest that XRP could reach as high as $14.


 Manage all your crypto, NFT and DeFi from one place


