Analyst "GalaxyBTC" has reignited aggressive sentiment in the XRP community with a chart comparison showing XRP’s current price action closely mimicking its 2017 breakout.According to the chart, XRP has completed a six-year consolidation phase. This culminated in a breakout and retest that resembled the setup preceding XRP's legendary bull run from 2017 to early 2018.
Two Key Historical Phases Defining XRP's Trajectory
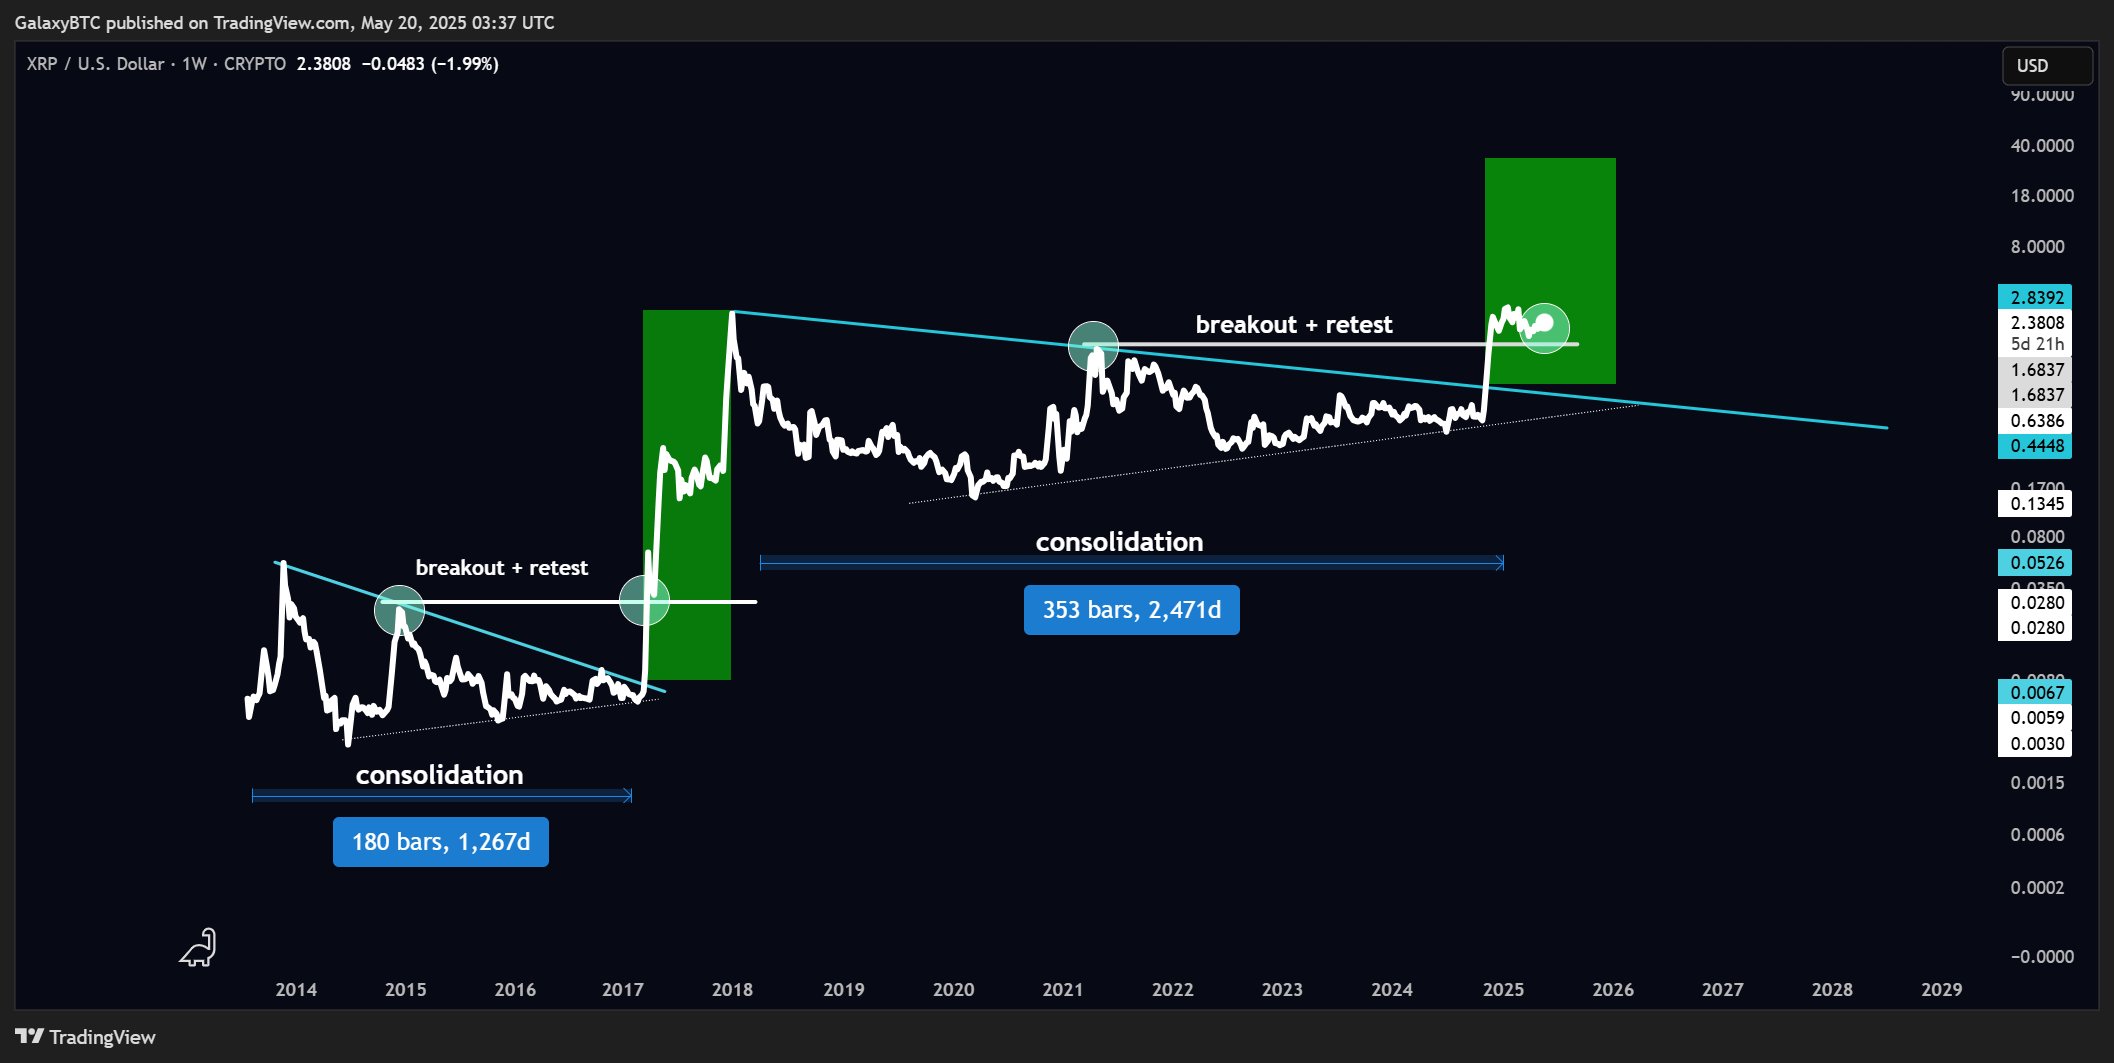
Specifically, GalaxyBTC’s chart highlights two key phases of price behavior in XRP's history. The first was a 1,267-day consolidation period before the 2017 rally, following a cooldown from the earlier 2013 price surge when XRP traded above $0.05.
However, XRP dipped massively after that and added another zero in the following years, until early 2017, when the trend dramatically reversed. XRP surged to over $3, marking a more than 70,000% gain from the end of that consolidation period to its peak.
The second key phase in XRP's history was a much longer 2,471-day accumulation phase that ended in late 2024. GalaxyBTC's chart shows XRP breaking through a multi-year descending resistance line, nearly identical to the one that triggered the 2017 breakout.
Notably, XRP’s recent breakout has already resulted in a 5X surge before experiencing a brief cooldown. GalaxyBTC emphasized that XRP closely mirrors its historical chart patterns. He suggested that an even more explosive move could follow the prolonged consolidation.
XRP historical chart by GalaxyBTC
While he provided no exact targets, the chart includes a potential upside to nearly $40 by next year. This would represent a 1,580% increase from the current price of around $2.38. However, some believe this is a conservative estimate based on XRP’s historical performance.
XRP to Hit $1,700 in a 64,000% Rally?
GalaxyBTC’s post drew attention from several XRP advocates, including commenter Remi Relief, who asserted that XRP would repeat history. He predicts a 64,000% increase that could send XRP to $1,700 by Q4 2025 or Q1 2026. For 2025 alone, his “conservative” estimate is $1,200 per XRP by year-end.
Remi also mentioned his broader expectations of an 80,000% to 150,000% increase this cycle, should XRP follow the same trajectory as it did in 2017. “History will be made,” he added.
https://twitter.com/RemiReliefX/status/1924886747948675091
Reality Check: Market Cap Math Still Matters
While excitement builds, such bullish forecasts raise eyebrows due to the sheer scale of the projections. A price of $1,700 per XRP would imply a market cap of approximately $100 trillion, which seems impossible and unrealistic.
This far exceeds the combined capitalization of Bitcoin and gold and is nearing the total value of the global bond market.
While projections of 64,000% to 150,000% gains are extreme, repeated calls for such outcomes highlight the community's optimism that this cycle could mark a new chapter in XRP’s history, after more than seven years below its all-time high.


 Manage all your crypto, NFT and DeFi from one place


