Crypto Market Price Analysis Today: Bitcoin (BTC), Ethereum (ETH), Helium (HNT), Aerodrome (AERO), Pups Ordinals (PUPS)

0
0

Last week, Bitcoin experienced significant downward pressure, though a promising development was notable purchases at lower levels around $61,000, indicating that overall sentiment remains upbeat and dips are seen as purchase opportunities.
However, the downward trend may not have concluded as Bitcoin miners might sell around $5 billion worth of Bitcoin in the four to six months following the Bitcoin halving event. This could result in Bitcoin moving sideways in the coming months.
A sideways market often confuses traders, presenting misleading signals in both upward and downward directions. Consequently, traders should exercise caution and avoid making immediate buying or selling decisions based on initial movements. It’s advisable to wait for a sustained breakout before placing substantial trades.
Let’s review the charts to determine the critical resistance levels Bitcoin needs to surpass to indicate that the correction phase has ended.
Bitcoin (BTC) Price Analysis
Bitcoin price has been declining heavily for over the last few hours; however, it has rebounded from the $61,840 support level to the moving averages, where it is expected to encounter significant resistance from the bears. As of writing, BTC price trades at $63,878, surging over 0.15% in the last 24 hours.
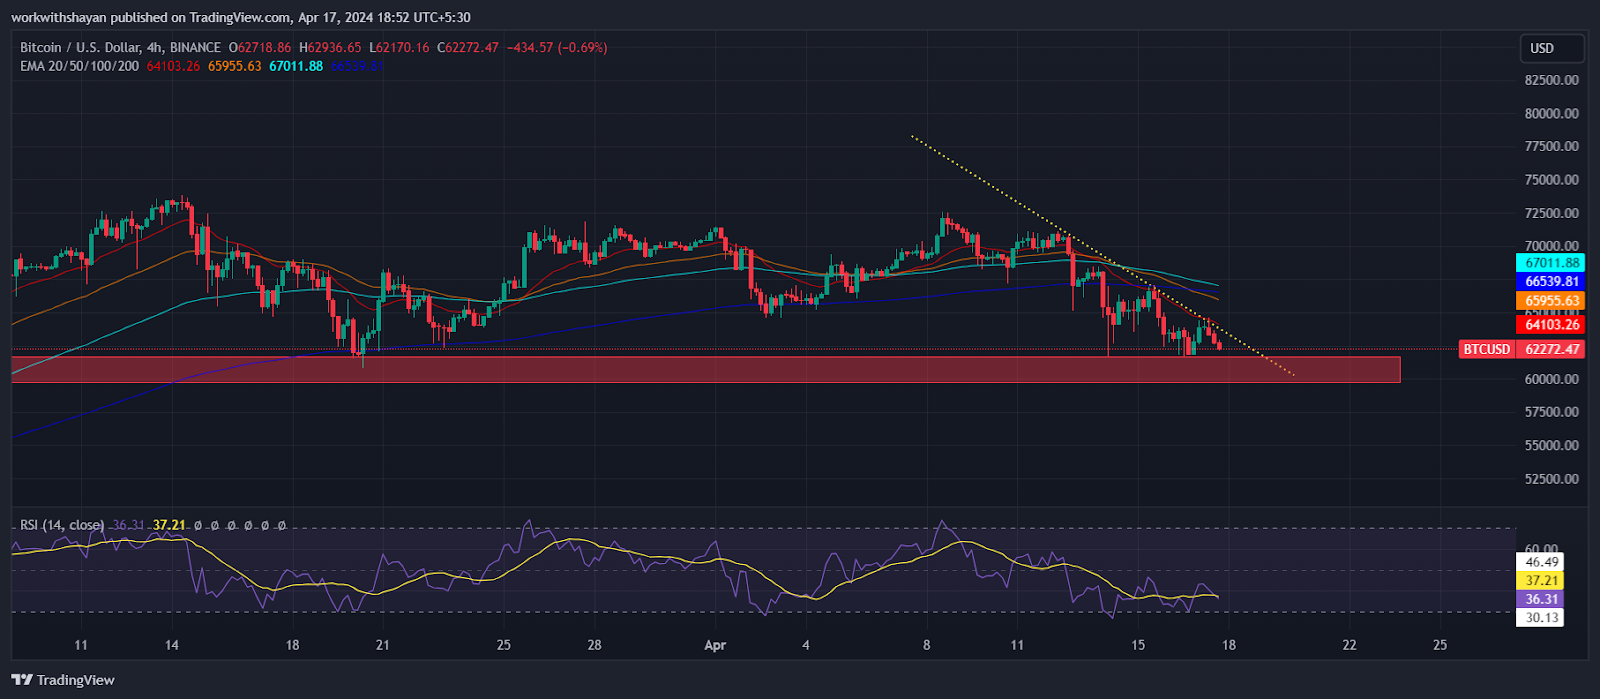
BTC/USDT Chart On TradingView
Should the price retreat from the moving averages, the bears will likely attempt to push the BTC/USDT pair back below the $60K mark. A breach below this level could trigger a deeper correction, potentially leading to a decline towards the 61.8% Fibonacci retracement level at $57,441.
On the other hand, if the price can break through the moving averages, it suggests that the pair might continue to oscillate within the $65K to $73,777 range for a while longer. Successfully breaking and closing above $73.7K would signal a continuation of the upward trend, possibly reaching up to $80,000.
Ethereum (ETH) Price Analysis
Ether price is facing extreme volatility around the $3K mark and it recently slipped below that support line, but the bears failed to capitalize on this move. The bulls are strongly defending a decline now as they are aiming to send the price above $3,300. As of writing, ETH price trades at $3,085, declining over 0.12% in the last 24 hours.
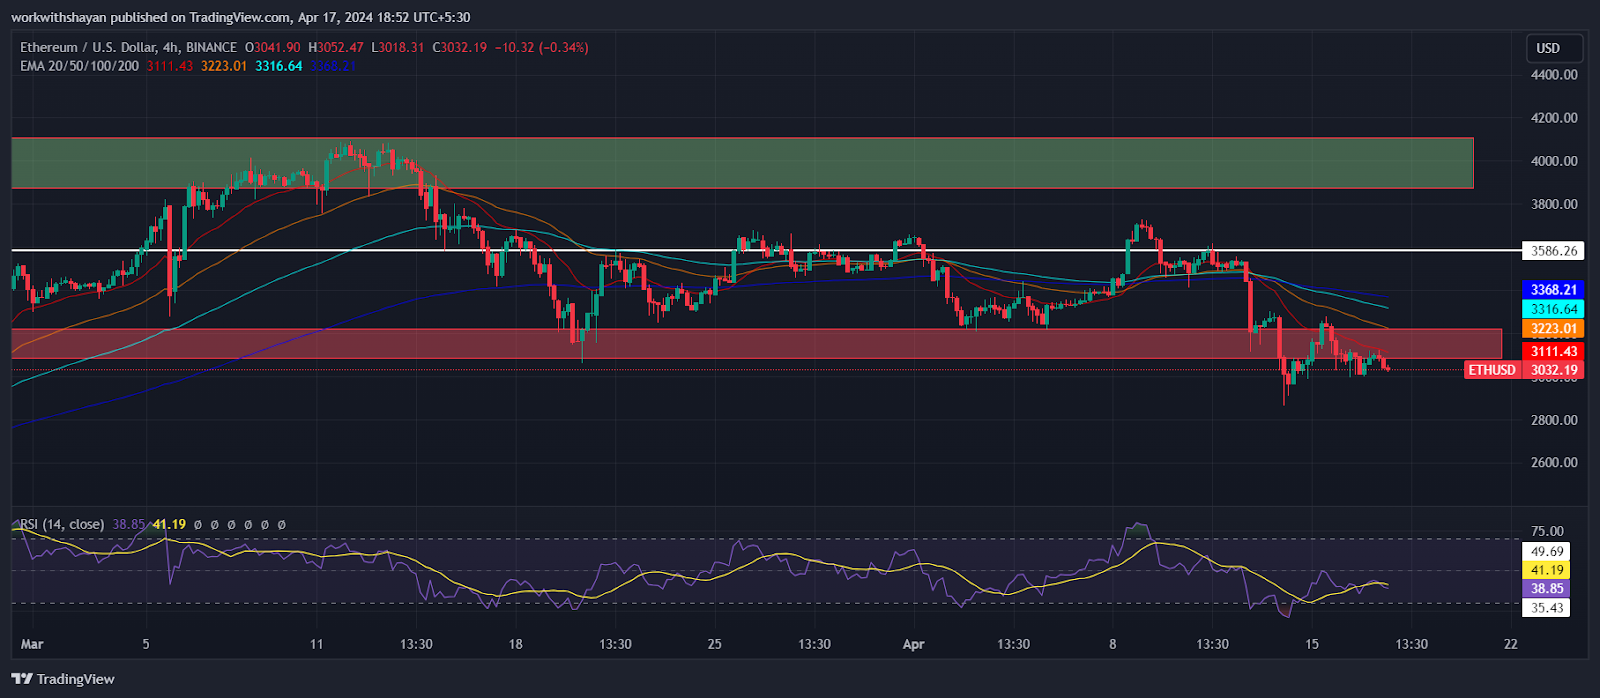
ETH/USDT Chart On TradingView
The recovery might extend to the 100-day EMA at $3,323, a critical level to watch. If the price retreats from the 100-day EMA, the ETH/USDT pair could fall back to $3,056 and might even extend the decline to $2,800.
Conversely, if the price holds above $3,300, it indicates that the sideways trading pattern is still in effect. A push above the 100-day EMA would strengthen the bulls, potentially triggering a rally to $3,600. For a continued upward movement, buyers need to overcome the key resistance level of $4,100.
Helium (HNT) Price Prediction
HNT has been oscillating within a broad price range of $6.3 to $3.7 recently, reflecting uncertainty regarding its future direction. The price has been on a severe downtrend in recent days following the market crash; however, buyers are strongly defending a decline below the support line. As of writing, HNT price trades at $4.25, surging over 7% in the last 24 hours.
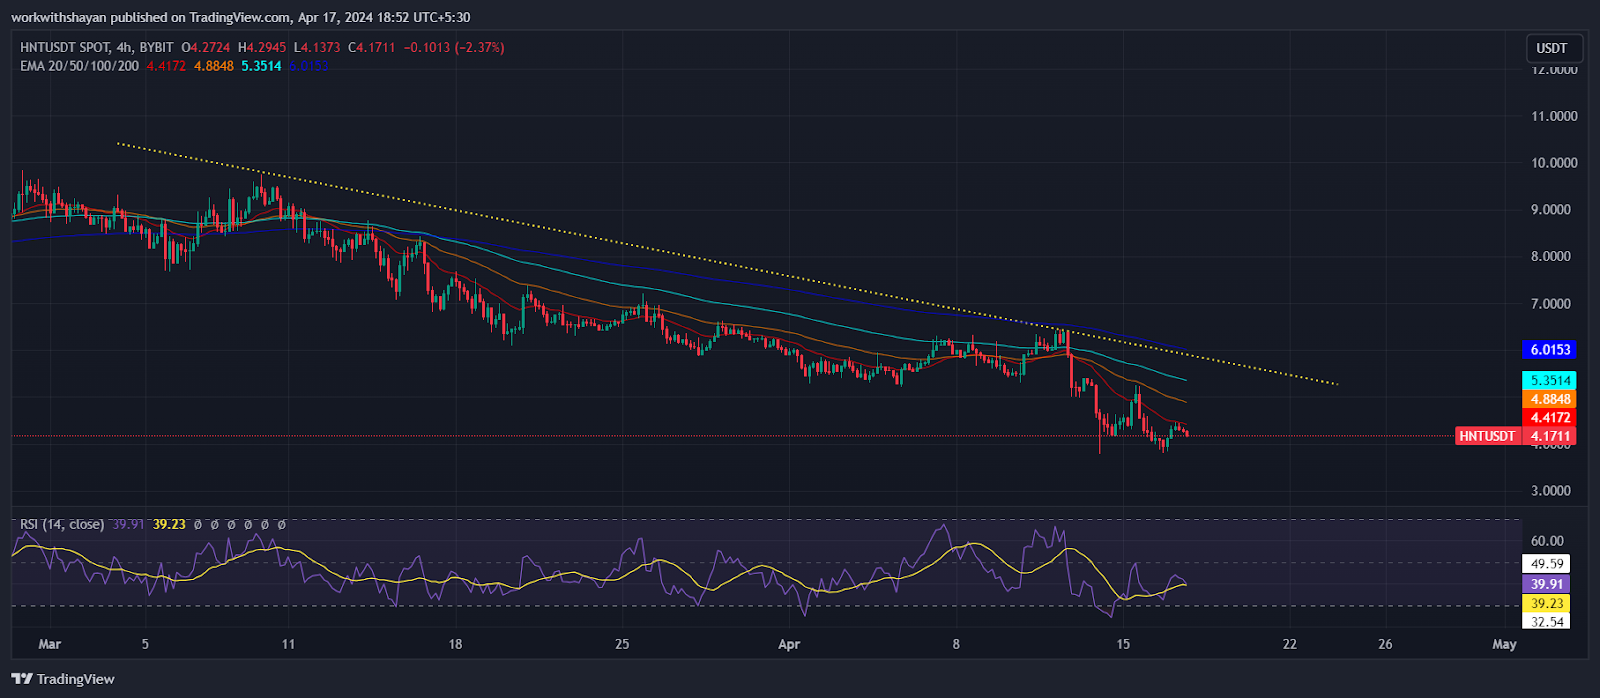
HNT/USDT Chart On TradingView
Buyers are creating pressure to push the price above immediate Fib levels and the price is currently facing resistance near the EMA20 trend line. The 20-day EMA has leveled off at $4.4, and the RSI hovers below the midpoint, giving advantage to bearish positions. Should the price sustain a rise above the 20-day EMA, the HNT/USDT pair might ascend to $6.3. Surpassing this threshold could mark the beginning of a new upward trend towards $8.4.
On the other hand, a reversal from the 20-day EMA could indicate that bears are taking the opportunity to sell during price rallies. Consequently, the pair might retreat to the $2.8 support level.
Aerodrome (AERO) Price Analysis
Aero price declined from the 20-day EMA at $1.79 and fell beneath the 50-day SMA. The selling pressure continues to intensify, with bears aiming to plunge the price below immediate Fib levels. Currently, Aero price trades at $1.6, declining over 6.1% in the last 24 hours.
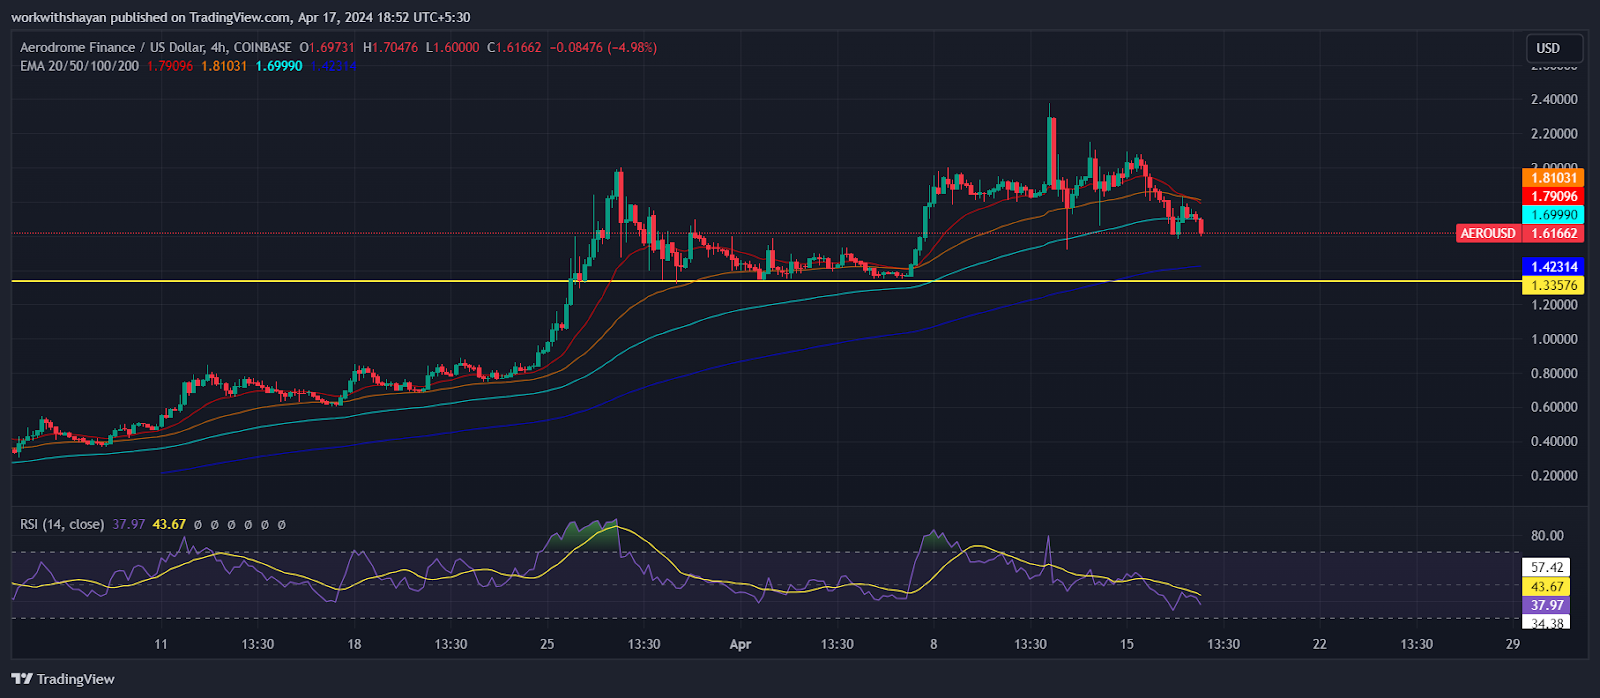
AERO/USDT Chart On TradingView
The pronounced wick on the candlestick indicates strong buying at the $1.59 level as bulls aim to hold this support. The goal for buyers will be to drive the price back up to the moving averages, which could act as a substantial resistance.
Should the price decline sharply from the moving averages, the bears may attempt to push the AERO/USDT pair back below $1.6. A successful breach below this level could see the pair descending towards $1.33. Conversely, a breakout above the moving averages would negate this bearish outlook in the short term and potentially lead to a rally up to $2.3.
Pups Ordinals (PUPS) Price Analysis
Pups price remains within an upward-sloping channel, suggesting a favorable position for buyers. Buyers defended the $49 level strongly, resulting in a strong rebound above 23.6% Fib level. Currently, Pups price trades at $52.9, declining over 9.7% in the last 24 hours.
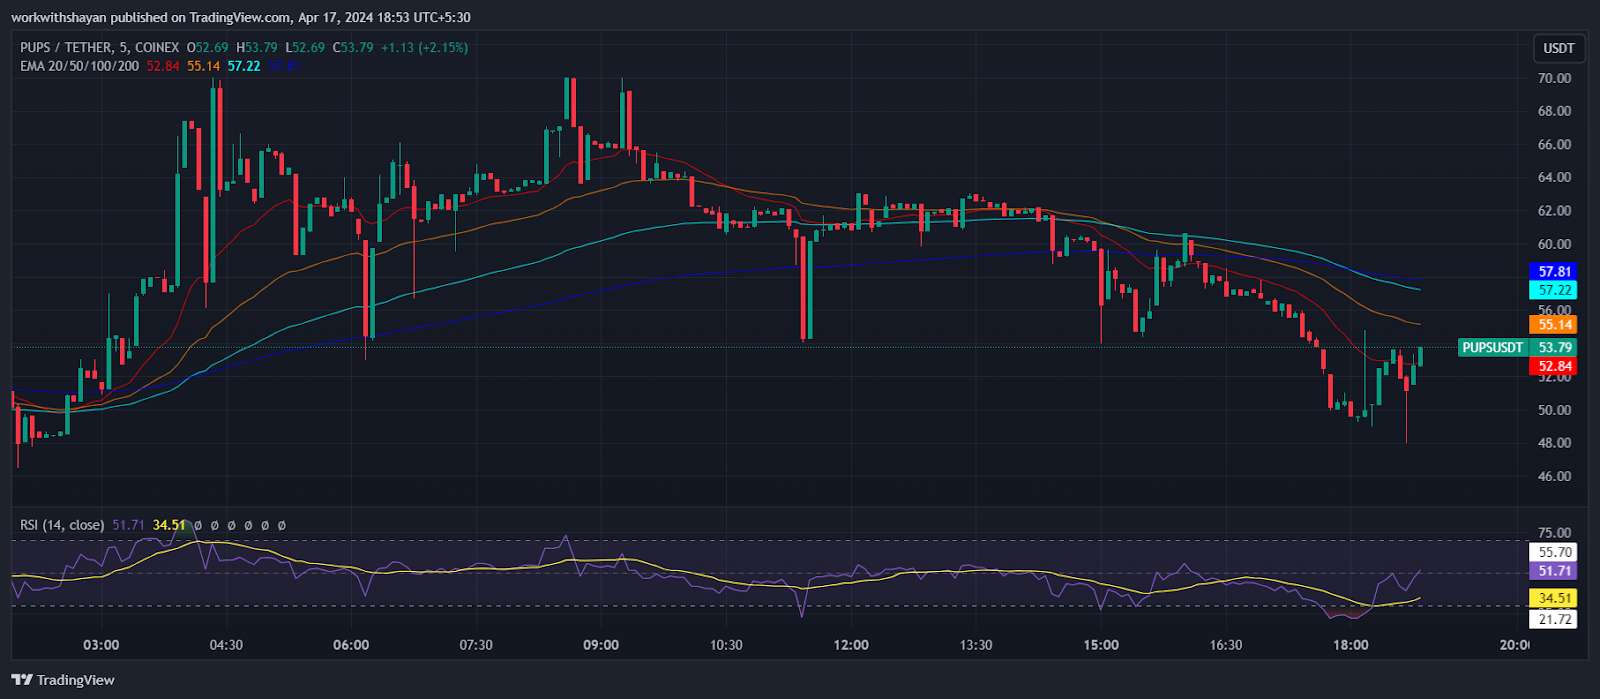
PUPS/USDT Chart On TradingView
The price has approached the channel’s upper resistance line, a point where a robust defense by sellers is anticipated. Should the price retreat from this resistance, the PUPS/USDT pair might fall toward the channel’s support line of $49. A definitive break below this channel could indicate a possible bearish momentum in trend.
Conversely, if buyers successfully push the price above the channel of $53.5, this would indicate an increase in momentum. Following this, the pair may aim for a rise to $62 and potentially reach $70.
0
0


 Manage all your crypto, NFT and DeFi from one place
Securely connect the portfolio you’re using to start.

0
0


0
0
