Chainlink Stabilizes Near Critical Support as Exchange Outflows Continue
0
0

- Chainlink holds near key Fibonacci support with potential rebound target at $19.
- Persistent exchange outflows signal long-term accumulation amid reduced trading activity.
- LINK market cap declines after early 2025 rally, testing investor sentiment near $12 support.
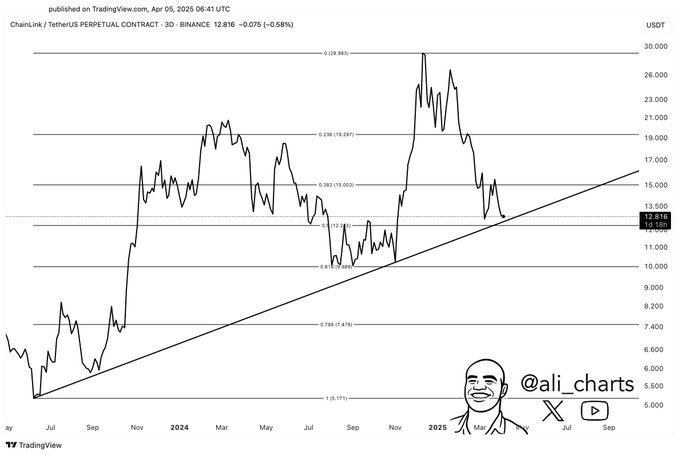
Ali, a crypto analyst, recently took to X to note that Chainlink (LINK) could rebound toward $19 if buying pressure increases around the $12 mark. He pointed to a group of technical indicators, specifically the 0.618 Fibonacci retracement level, and a long-standing ascending trendline, as signals of possible strength.
According to his analysis, the $13.05 price zone marks a major area for a trend reversal, while the structural support near $11.18 could offer additional stability if tested. The post suggests that LINK is approaching a decisive point in its medium-term price direction.

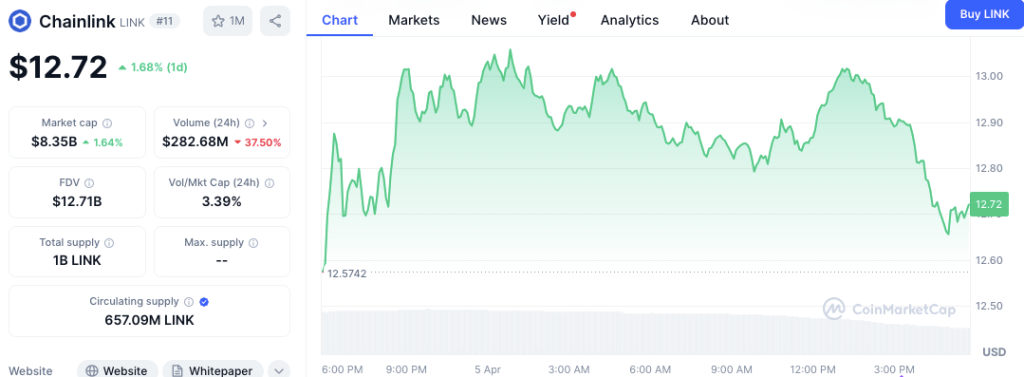
As of press time, Chainlink was trading at $12.72, up 1.68% in the last 24 hours, according to data from CoinMarketCap. The token rebounded from a low of $12.57 during intraday trading, climbing above the $12.70 range with session highs near $13.00.

The current price action places LINK just above the 0.618 Fibonacci retracement level, derived from its previous peak of $28.86. This zone has historically acted as strong support during corrections.
Also, the upward-sloping trend line, which started in the middle of 2023, provides structural support, currently at around $11.18. In the event LINK cannot sustain this support level, the next significant technical level is at $9.75, which is the 0.786 Fibonacci retracement.
Exchange Outflows Suggest Long-Term Holding Behavior
According to CoinGlass data, Chainlink has seen consistent net outflows from spot exchanges since early December 2023. These outflows, represented by red bars in the chart, indicate that more LINK tokens are withdrawn from trading platforms than deposited. The most outflows occurred in mid-December and late January, each surpassing $40 million in daily volume.

However, gradual flows have been negative, suggesting long-term accumulation, which signifies inflation either in the short or long periods, which briefly has inflow. If market demand go up in the future, bearish immediate sell-side pressure might reduce as more tokens are transferred off exchanges.
Market Cap Shrinks Following Early-Year Rally
LINK’s price and market capitalization have declined since peaking earlier in 2025. In late February, the market cap reached over $20 billion as the token surged above $40. Since then, both metrics have reversed, with the price falling below $15 and the market cap dropping under $10 billion.

More than 657.09 million LINK tokens exist in the market alongside the total supply of 1 billion tokens. The complete diluted evaluation of LINK amounts to $12.71 billion. LINK’s long-term upward trend since mid-2023 continues to strengthen despite recent market corrections because investors watch for new support levels to form before its next movement.
0
0
 Manage all your crypto, NFT and DeFi from one place
Securely connect the portfolio you’re using to start.


