Ethereum High Selling Pressure Mounts but Bulls See Long-Term Strength
0
0

Ethereum’s market is walking a tightrope. Short-term momentum shows clear selling pressure, yet deeper indicators suggest this could be a cooling phase before the next leg up.
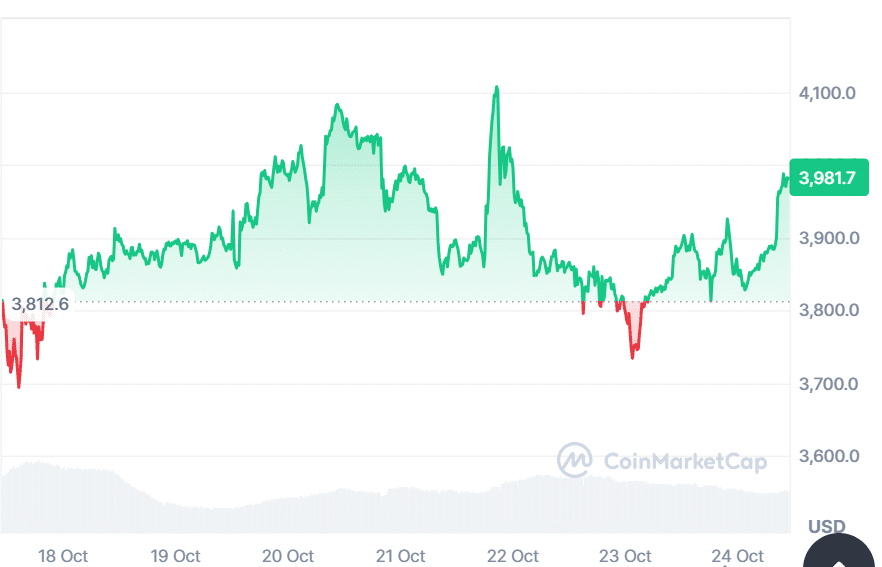
Analysts note that Ethereum recently hovered around the $3,980 mark, a key level that’s acted as both support and resistance since midsummer. If it breaks below, traders are eyeing $3,400 as the next possible floor. Despite this, the long-term picture still leans bullish.
Exchange Inflows Show Growing Ethereum Selling Pressure
According to on-chain data from CryptoQuant analyst CryptoOnchain, Ethereum’s 7-day moving average of netflows swung dramatically in mid-October, from heavy outflows of around –31,000 ETH to net inflows of +3,000 ETH. This flip signals stronger Ethereum selling pressure as traders move coins onto exchanges, often a prelude to selloffs.
“Until this changes, traders should be wary of another downward price swing,” CryptoOnchain explained in a post on CryptoQuant. The sudden inflows echo patterns seen during consolidation phases rather than outright collapses.
Market Leverage Drops, But Fundamentals Hold
Data from derivatives markets show Ethereum open interest hovering near $19–20 billion, down sharply from $27 billion before the October liquidation wave. This signals a deleveraged environment, less speculation, more caution. “The funding rate briefly dipped negative,” said one derivatives tracker, “but that’s healthy when markets reset after leverage flushes.”

Ethereum’s realized price, sitting near $2,300, remains a vital line of defense. Analyst TeddyVision noted that dips below this level often mark capitulation. With the current price still above it, long-term holders are in profit, with the MVRV ratio around 1.67, showing investors are roughly 67% in gains on average.
Institutional Shadows and Sentiment Reset
The broader narrative is also shaped by traditional finance. T. Rowe Price’s upcoming multi-asset ETF, expected to include Ethereum, hints at institutional confidence, even if the short-term price impact is muted. The sentiment has cooled since early October’s liquidation, but many analysts see that as a healthy reset.
“The market isn’t euphoric, and holders are in profit but not overheated,” wrote Akashnath S, a market analyst. “This mix often precedes mid-term growth phases.” Such dynamics show Ethereum selling pressure might actually be the market exhaling before it rallies again.
Support, Resistance, and the Road Ahead
As the chart stands, $3,980 is Ethereum’s short-term pivot point. If bulls defend this line, the next major resistance looms near $4,200. If it gives way, $3,400 becomes the next area of interest. Historically, similar dips, where MVRV stays below 2, have preceded strong rebounds.
Ethereum’s network fundamentals remain solid. Daily active addresses, staking participation, and L2 activity continue to climb, balancing out market noise. The cooling phase, though uncomfortable, often resets the stage for organic recovery.
Conclusion
Ethereum selling pressure is undeniable in the short term, reflected in exchange inflows and falling open interest. Yet, the long-term structure shows resilience.
Profitability levels, fundamental support, and muted sentiment collectively paint a picture of consolidation, not capitulation. Unless $3,400 breaks decisively, Ethereum remains well within its long-term bullish zone.
Frequently Asked Questions (FAQ)
1. What does Ethereum selling pressure mean?
It refers to increased movement of ETH to exchanges, typically signaling traders are preparing to sell. Sustained inflows can pressure prices lower.
2. Why is Ethereum’s $3,800 level important?
It has acted as both a support and resistance zone since July 2025. A break below could push ETH toward $3,400, while holding it may spark a rebound.
3. How does the MVRV ratio affect Ethereum’s outlook?
The Market Value to Realized Value (MVRV) ratio measures investor profitability. An MVRV around 1.5–2 suggests the market isn’t overheated, often preceding bullish reversals.
4. What role does institutional interest play?
Institutions like T. Rowe Price entering crypto ETFs support Ethereum’s long-term legitimacy, though short-term price moves remain driven by retail and derivatives flows.
5. Is Ethereum still considered a safe long-term investment?
While no crypto is “safe,” Ethereum’s ecosystem strength and consistent institutional adoption give it strong long-term fundamentals despite short-term volatility.
Glossary
MVRV Ratio: A metric comparing the market value of a coin to the average cost basis of holders. It helps identify overbought or oversold conditions.
Realized Price: The average price at which all coins last moved on-chain, serving as a key psychological and technical support level.
Open Interest (OI): The total value of outstanding futures and perpetual contracts, showing how much leverage is in the market.
Exchange Netflows: The difference between coins moving into and out of exchanges. Positive netflows indicate selling pressure, while negative ones suggest accumulation.
ETF (Exchange-Traded Fund): A financial product that tracks an asset or basket of assets. When institutions include cryptocurrencies, it signals broader market adoption.
Read More: Ethereum High Selling Pressure Mounts but Bulls See Long-Term Strength">Ethereum High Selling Pressure Mounts but Bulls See Long-Term Strength
0
0
 Manage all your crypto, NFT and DeFi from one place
Securely connect the portfolio you’re using to start.


