Ethereum Price Recovers Above $2,620 but Faces Strong Overhead Resistance
0
0

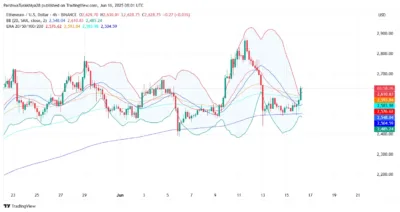
Ethereum has staged a moderate recovery, with its price climbing above $2,620 in the past 24 hours. The uptrend follows a rebound from the $2,517 to $2,540 demand zone, an area identified by Smart Money Concepts as a recent liquidity grab and breakout level.
A break of structure above 2600 in the 4-hour chart supported recovery, meaning a short-term bullish power. Nevertheless, the wider price formation is unchanged, and Ethereum has several barriers of resistance and few impetuses of volume indicators.
The price is currently on the edge at around $2,628, testing 50 EMA resistance on the 4-hour chart. It has already broken the 20 and 100 EMAs, and the short-term charts tend to push to the upper Bollinger Band above $2,610.

Source: Tradingview
Also Read: Metaplanet Buys 1,112 BTC, Surpasses Coinbase with 10,000 Bitcoin Holdings
Technical Indicators Point to Cautious Optimism
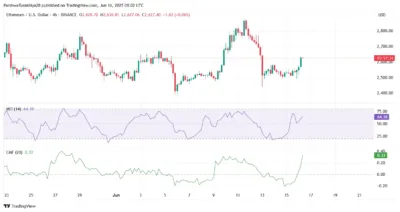
The Awesome Oscillator is printing rising green bars, and the Bull and Bear Power indicator is reading 115.98, reflecting improved buying pressure. The Money Flow Index has climbed toward 64, and the Chaikin Money Flow remains positive at +0.33, suggesting continued capital inflow.

Source: Tradingview
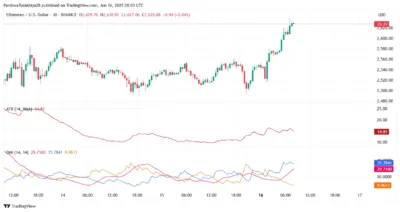
In the meantime, the Directional Movement Index is causing an upsurge, with the +DI bullish at 35.78 against the –DI of 29.71, although the ADX remains below levels, which confirms a strong trend. The Supertrend has become green since the price rose and stayed beyond 2,584 and has so far held on, which hints at a bullish trend in case ETH manages to hold above 2,600.

Source: Tradingview
Although various indicators have created a bullish trend, the 30-minute Average True Range shows 14.8, which indicates low volatility. Unless a prolonged volume rise can be recorded, Ethereum might not be able to push past the latest series of resistance.
Key Liquidity Levels Define Short-Term Outlook
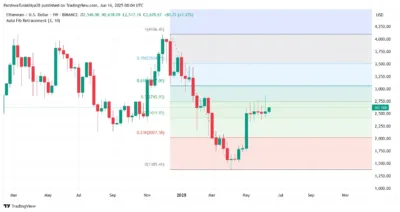
Ethereum is now trading just below a key supply zone between $2,680 and $2,735. This area includes a higher timeframe resistance at the 0.236 Fibonacci level ($2,745), which must be breached on a daily close to confirm a stronger trend reversal.

Source: Tradingview
While the recent move cleared minor liquidity near $2,540, central buy-side liquidity remains untested between $2,785 and $2,810. Until that zone is challenged, Ethereum’s current movement remains part of a mid-range consolidation.
In the short term, a failure to sustain above $2,640 could lead to a retest of the $2,580–$2,540 support area. Bulls will need to demonstrate further strength to shift the broader structure into a confirmed uptrend.
Also Read: D’CENT Wallet Issues Important Announcement For XRP Army
The post Ethereum Price Recovers Above $2,620 but Faces Strong Overhead Resistance appeared first on 36Crypto.
0
0
 Manage all your crypto, NFT and DeFi from one place
Securely connect the portfolio you’re using to start.


