Analyst Identifies Historically Bullish Formation in Dogecoin Chart: What’s Next For DOGE?

0
0

- Technical analyst spots historically bullish pattern formation on Dogecoin daily chart.
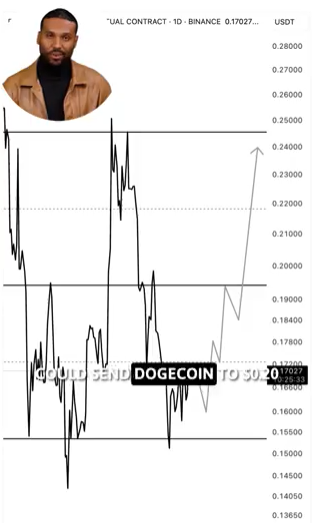
- Dogecoin targets $0.20 resistance level requiring 9.5% rally from current levels.
- Multiple analysts converge on $0.25 price target citing various technical patterns.
A leading cryptocurrency analyst has identified a historically bullish chart pattern in Dogecoin’s daily timeframe that could trigger upward price movement from current trading levels.
The technical formation occurs as DOGE recovers from its mid-June low of $0.1514 with three consecutive weeks of positive performance.
Dogecoin has gained 19% during its recent recovery phase, marking the first sustained uptrend after months of declining price action. The meme cryptocurrency remains down 42% year-to-date and trades 75% below its all-time high, creating potential upside opportunity according to technical analysis.
The analyst’s pattern recognition focuses on parallel channel formations that have historically preceded major price advances in Dogecoin. Current weekly gains of 5% contribute to broader meme coin sector revival as market conditions improve across alternative cryptocurrencies.
Technical targets establish resistance roadmap
The identified bullish formation points toward an initial target of $0.20, representing a 9.5% advance from current trading levels. This price zone has created multiple rejection points throughout 2025, including March 26, April 26, and June 11 attempts that failed to sustain above the resistance.
Historical price action shows concentrated supply pressure around the $0.20 region, where DOGE faced rejection on March 26 before declining to April’s low of $0.129. The resistance level’s significance stems from repeated failed breakout attempts that created overhead supply.
A successful reclaim of $0.20 would establish pathway toward the secondary target of $0.25, requiring a 36% rally from current price levels. This upper resistance zone generated dual rejection signals during May trading, indicating strong selling pressure from existing holders.
Tom Tucker’s analysis aligns with the bullish outlook through identification of a double bottom formation on Dogecoin’s daily chart. This technical pattern typically signals trend reversal from bearish to bullish conditions when properly confirmed.
Additional analysis from The Crypto Basic cites bullish divergence indicators and increasing open interest as catalysts supporting upward price movement. These fundamental factors complement the technical pattern recognition for potential rally confirmation.
More aggressive price targets extend beyond near-term resistance levels, with some analysts projecting moves toward $0.46, $1.4, and $4 based on historical cycle patterns. CryptoELITES maintains a $5 target threshold for DOGE, suggesting current market expectations underestimate potential gains.
0
0


 Manage all your crypto, NFT and DeFi from one place
Securely connect the portfolio you’re using to start.


