Is the Zcash Price Rally Over? Continuation Patterns Say ‘Not Yet’

0
0
Zcash has been one of the strongest movers in the market. It jumped more than 1,000% in three months, but the last seven days have brought a 15% drop. Many traders now wonder if the Zcash price rally is done.
But the chart still holds two important continuation signs. Both point to a pause, not a finish.
Price Structure Still Favors Rally Continuation
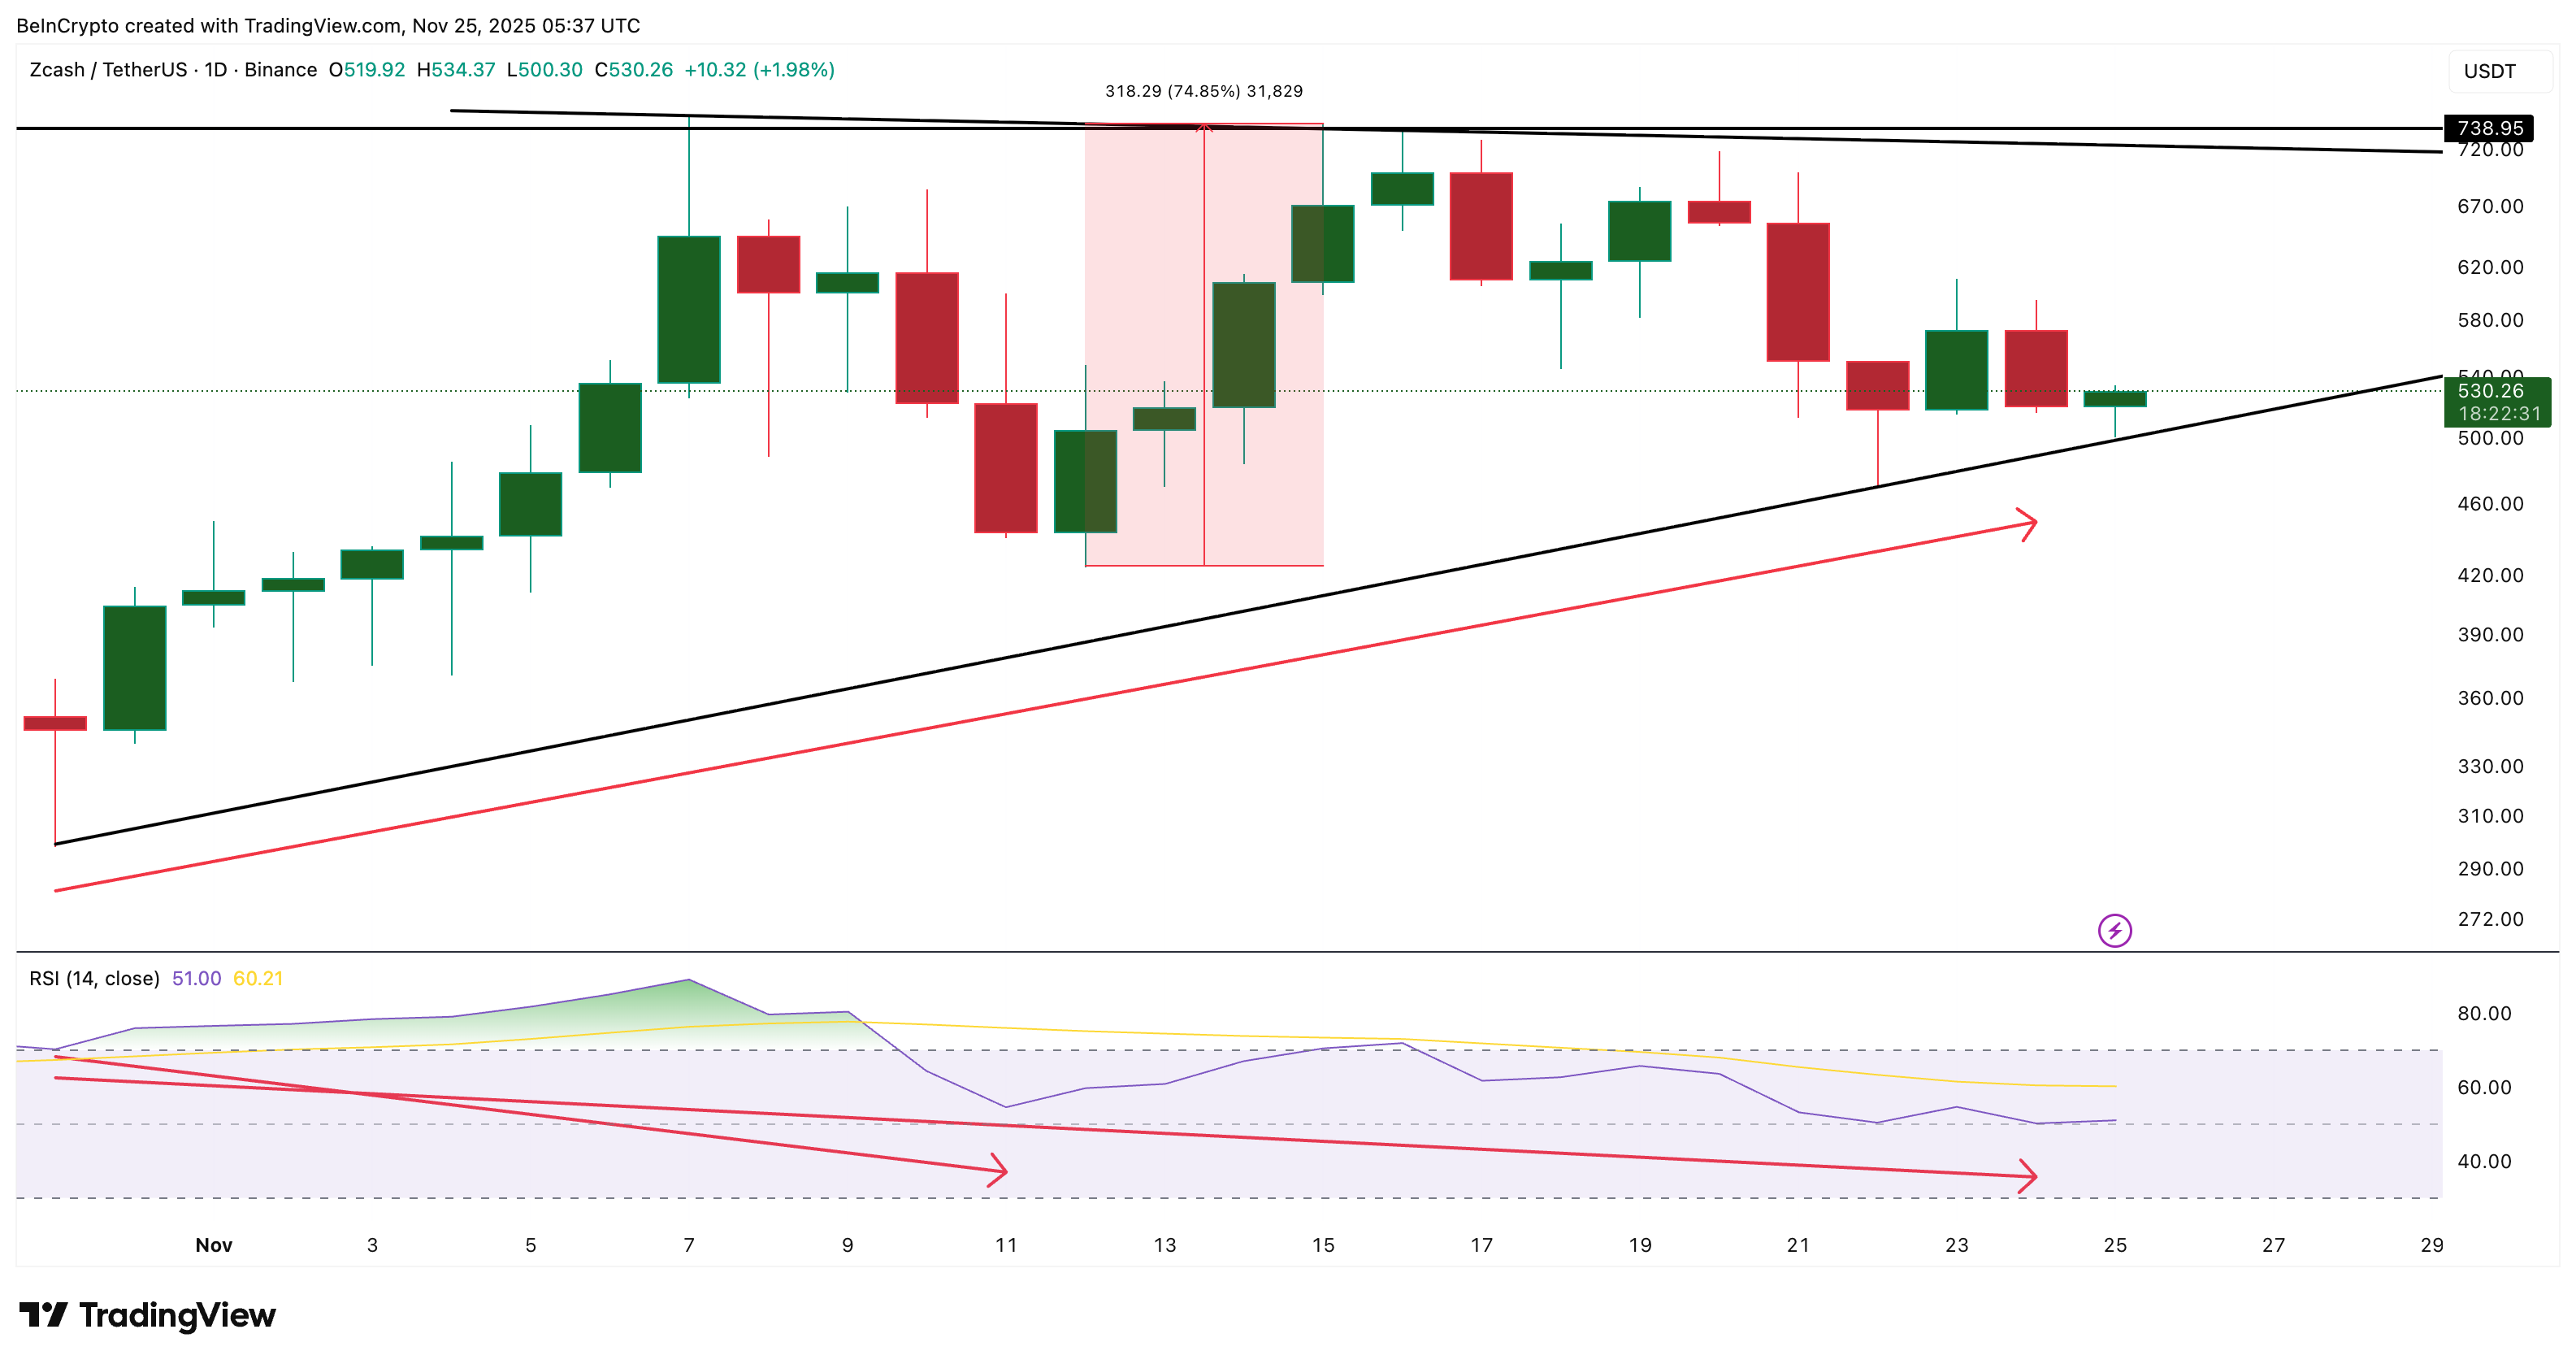
Zcash trades inside an ascending triangle. This pattern forms when the price keeps hitting a strong ceiling, but the lows rise each time. It shows buyers slowly taking control.
For Zcash, the horizontal ceiling sits near $738, a level that has blocked every move since November 7. The rising trendline under price forms the second half of the pattern and keeps the bullish structure alive.
A second detail strengthens this view.
Between October 30 and November 24, the price made a higher low while the Relative Strength Index (RSI) made a lower low. RSI tracks momentum. When price rises, but RSI falls, it creates a hidden bullish divergence. This usually supports continuation instead of reversal. And this is not the first time it has happened.
 Zcash Price Rally Flashes Continuation Sign: TradingView
Want more token insights like this? Sign up for Editor Harsh Notariya’s Daily Crypto Newsletter here.
A similar RSI divergence appeared between October 30 and November 11. After that, Zcash jumped 74.85%.
The same pattern is now flashing again, giving traders reason to stay patient instead of calling the top.
Buying Pressure Starts Rebuilding Again
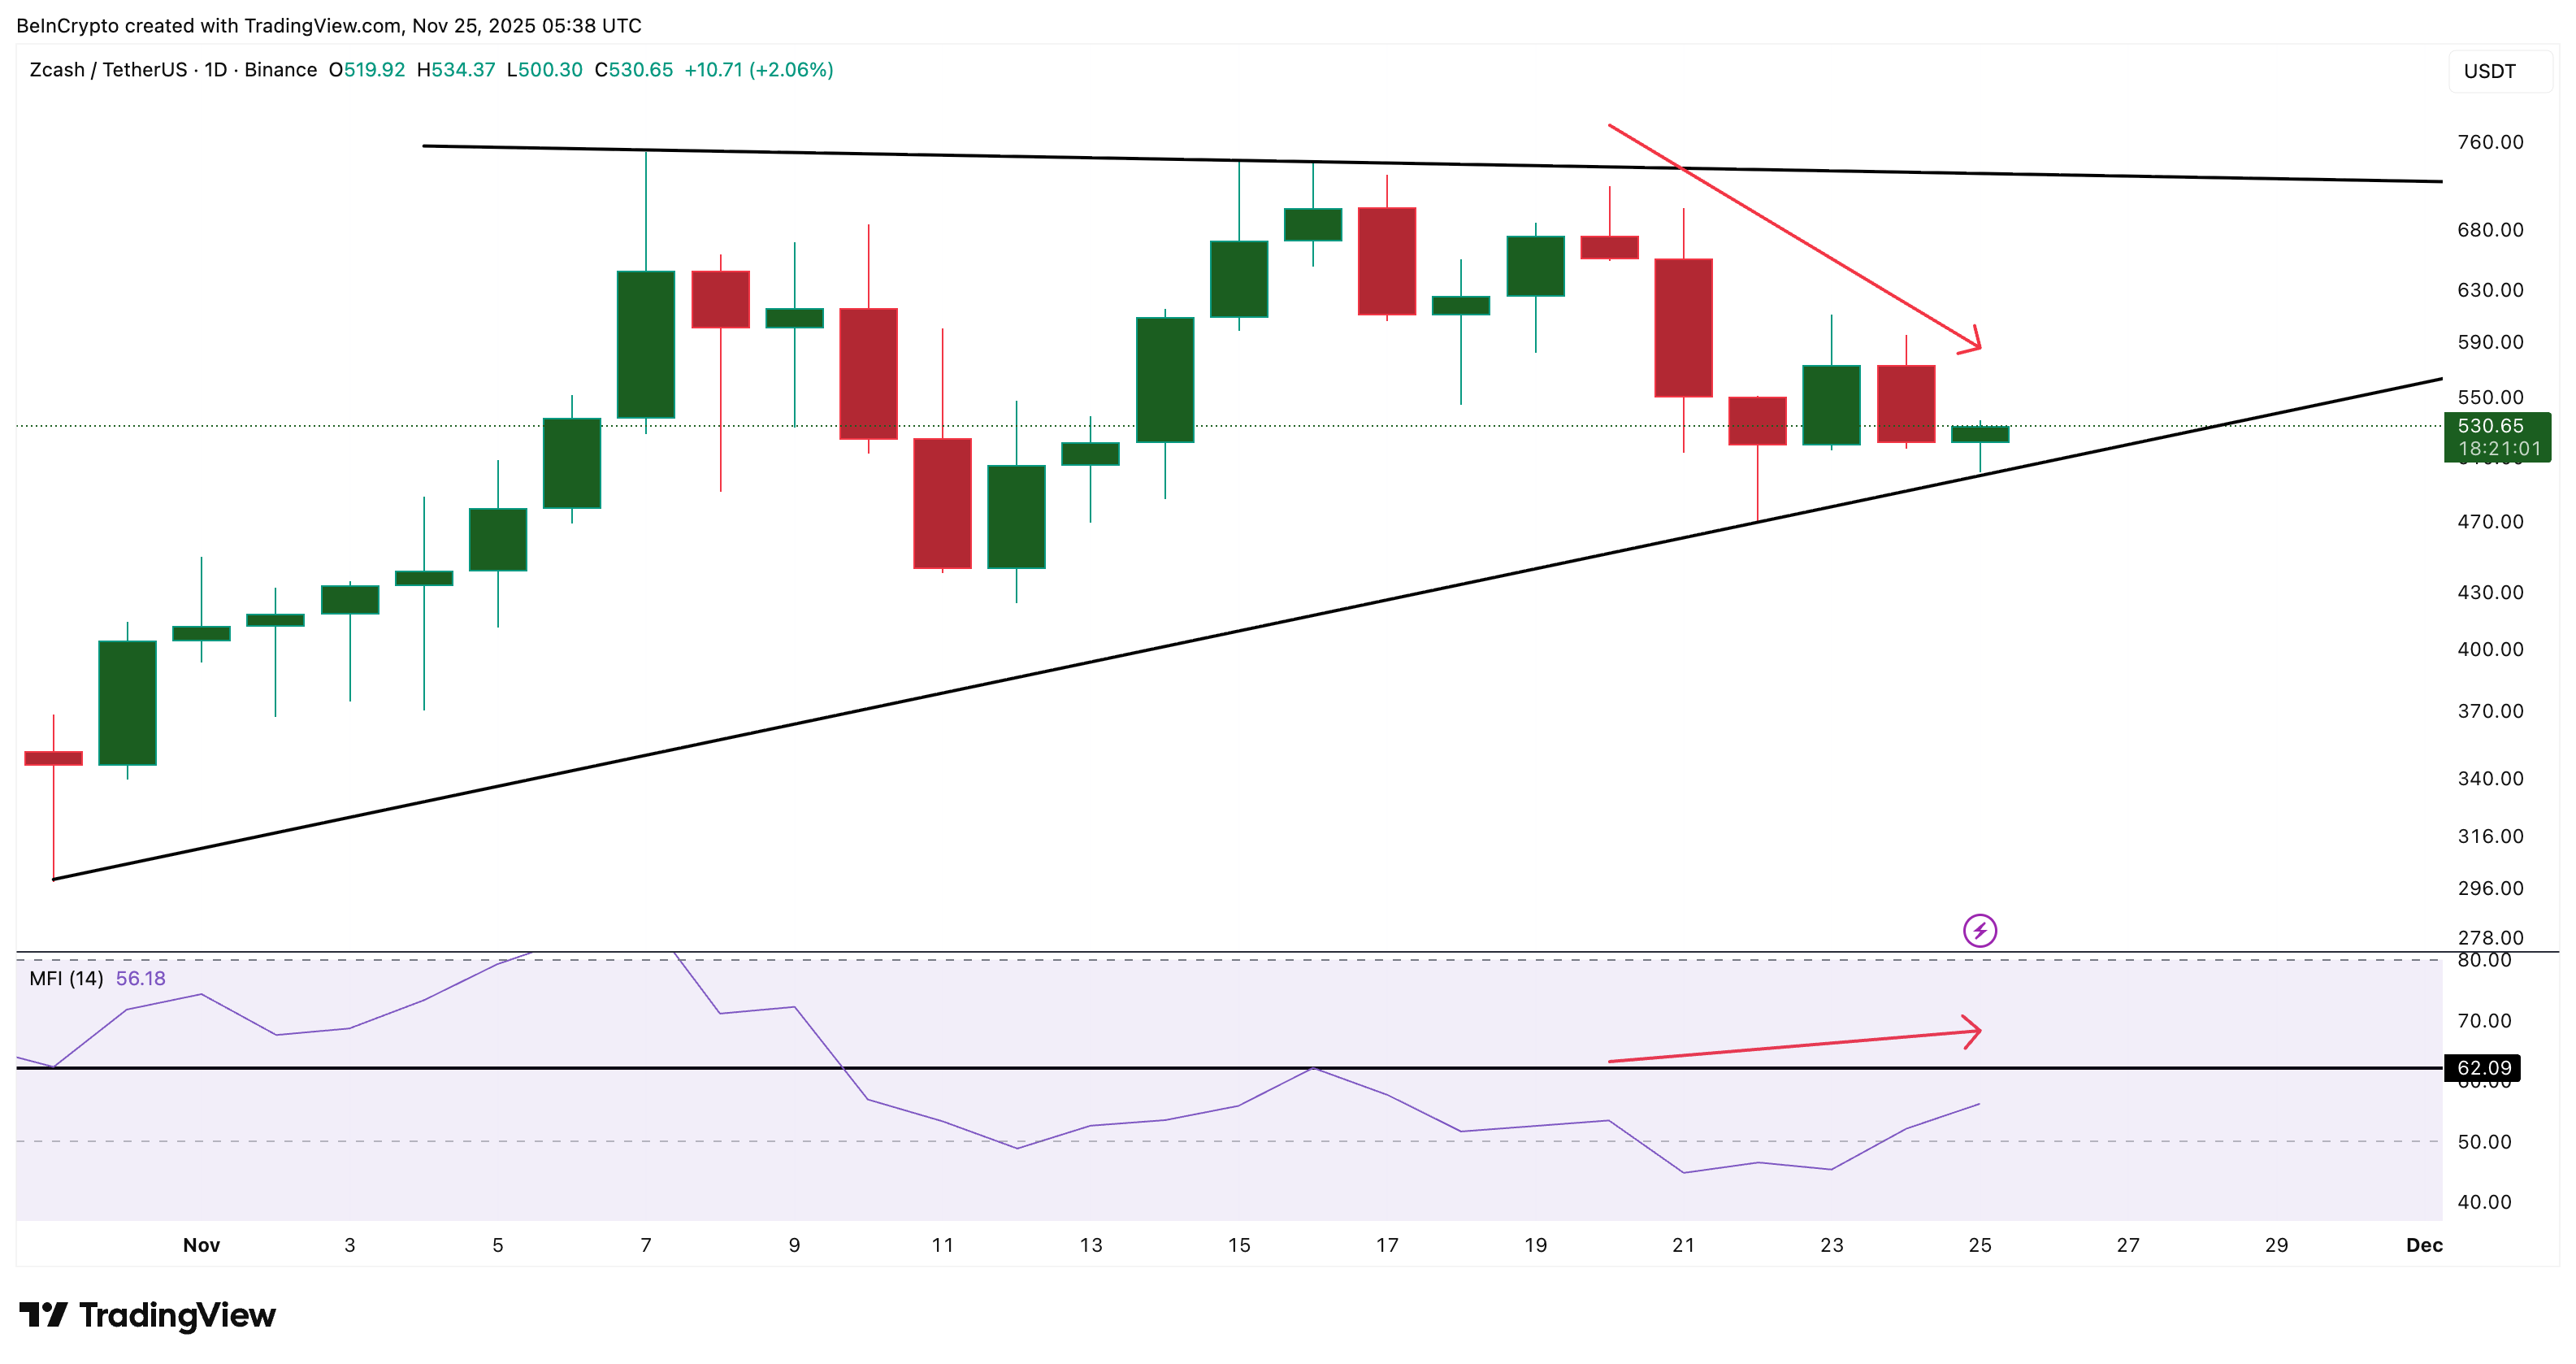
Smaller traders are starting to show interest again.
Between November 20 and November 25, the Zcash price made a lower high while the Money Flow Index (MFI) made a higher high. MFI measures how much buyers are stepping in during pullbacks. When MFI rises against price, it shows fresh dip-buying strength.
The key MFI level sits near 62.09. A clean move above this threshold usually confirms that buyers are returning in force.
 Retail Buying Picks Up: TradingView
This retail improvement pairs well with the rising support in the triangle, hinting that the recent weakness may just be a reset before the next leg of the Zcash price rally.
Zcash Price Rally Could Continue? If Key Levels Break
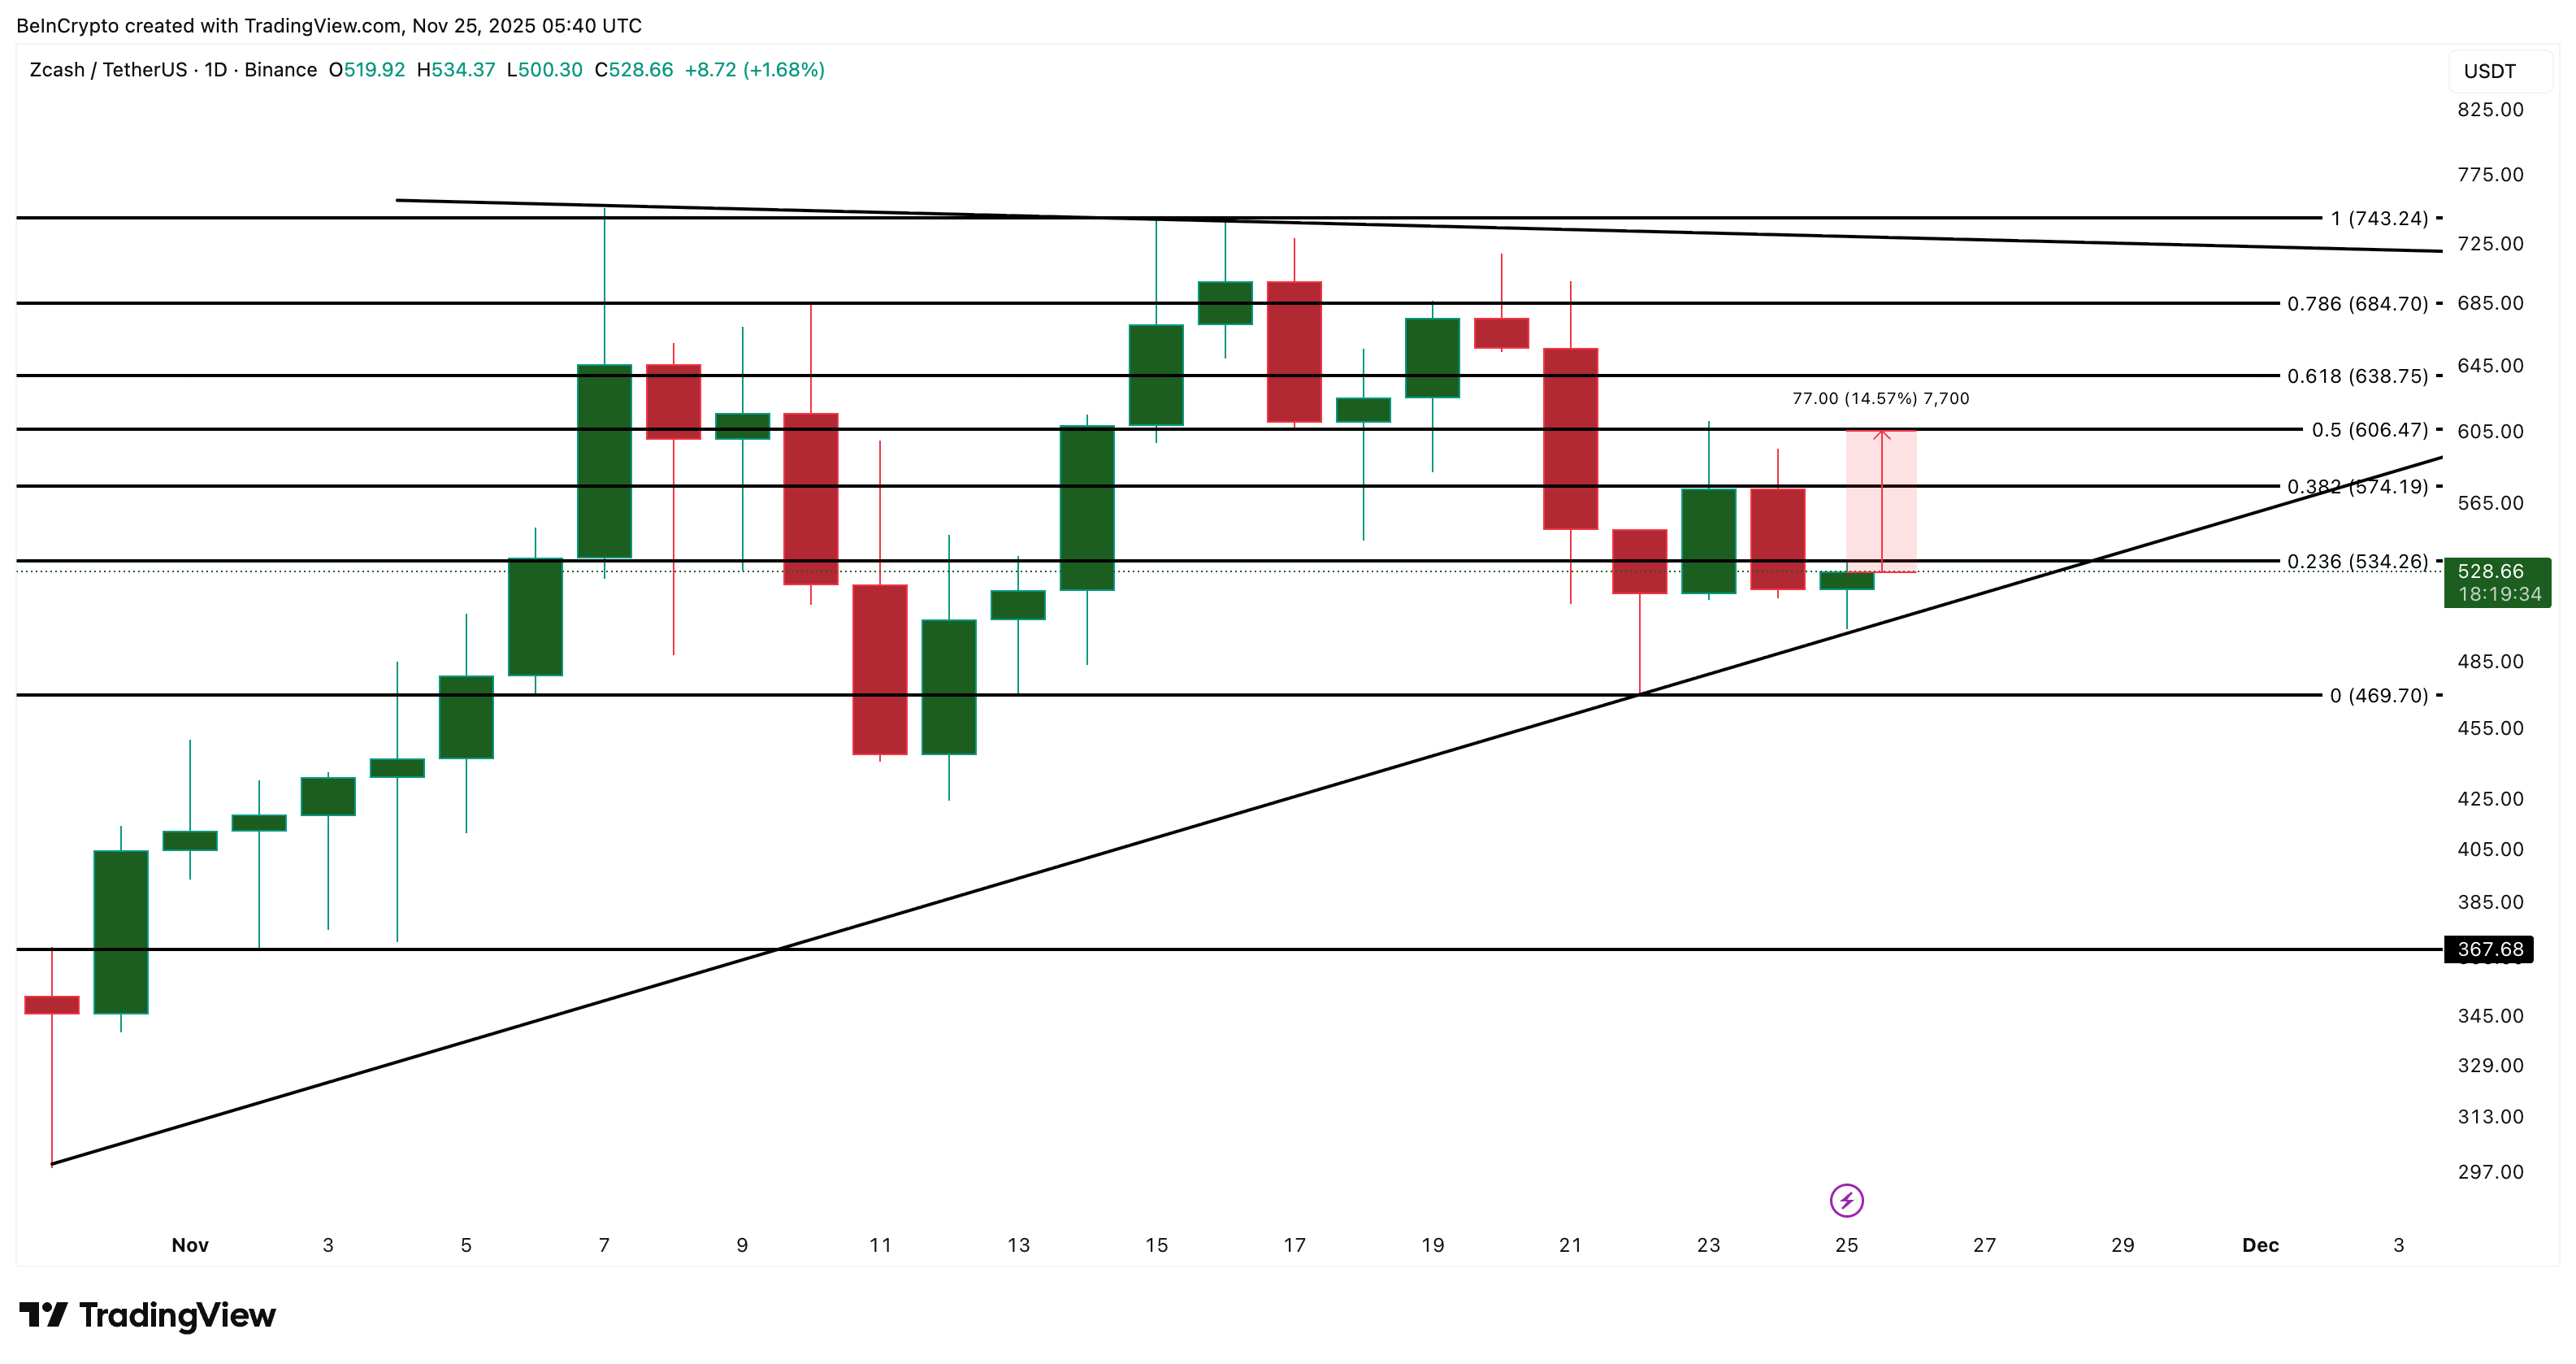
The Zcash price now trades near the middle of its pattern. The next steps depend on how the price reacts to a few clear levels. Zcash must first clear $606. Price has struggled here since November 23. A strong move above this opens space toward $684.
But the real breakout sits at $743. A daily close above that line confirms the ascending triangle breakout and signals that the broader rally could resume.
 Zcash Price Analysis: TradingView
The downside has clear lines too.
The rising support near $469 protects the trend. Losing $469 breaks the triangle and turns the setup neutral or even bearish. Below that, $367 becomes the next major support to watch.
Zcash may look weak after the recent dip, but the broader structure still shows strength. As long as the momentum setup holds and dip-buying improves, this move looks more like a detour than a breakdown. A close above $606 starts the recovery. A break above $743 confirms the rally is alive.
0
0


 Manage all your crypto, NFT and DeFi from one place
Securely connect the portfolio you’re using to start.


