Ethereum Rally Fades — Is a Drop to $1,930 Next?

0
0

Ethereum is on the verge of printing its second red candle of the week as it trades below its opening price. It saw a slight uptick a few hours ago, but the current price indicates that it has fizzled out.
A red close on Wednesday will be unsurprising as the previous day was also marked with selling pressure. ETH shed almost 2% on Tuesday following its rejection at $2,375.
With the altcoin threatening further decline, massive retracements in the coming days are almost inevitable. The fears are also supported by indicators on the 1-day chart. For example, it broke above the bollinger bands on Monday when it had its biggest surge yet.
It opened trading at $2,178 and surged to a high of 2,386 during the session, ending the day with gains exceeding 8%. Per the BB, a trend correction will follow. The current decline may be in response to this event.
In hindsight, the breakout from the bands marked the end of one of the most profitable periods in 2026. A closer look at the charts shows that since January, the asset has not seen any uptrend as prominent as the one over the last eight days.
The last time ETH experienced notable buying pressure was in early January when it gained 17%. As of Monday, it recorded a 24% rise during its recent run.
Aside from the bollinger bands, the relative strength index significantly rose during this period. It peaked at 66, just 4 clicks from overbought territory. Interestingly, this is the highest reading since the first month of the year.
Away from the indicators on the 1-day chart, there are some bullish on-chain readings.
Coinbase Premium Index Flipped Positive
As of Mar 17, readings from the Coinbase Premium Index were positive. The indicator typically displays whale activity and has been negative for most of February. It flipped green for the first time in over two months on Feb 24.
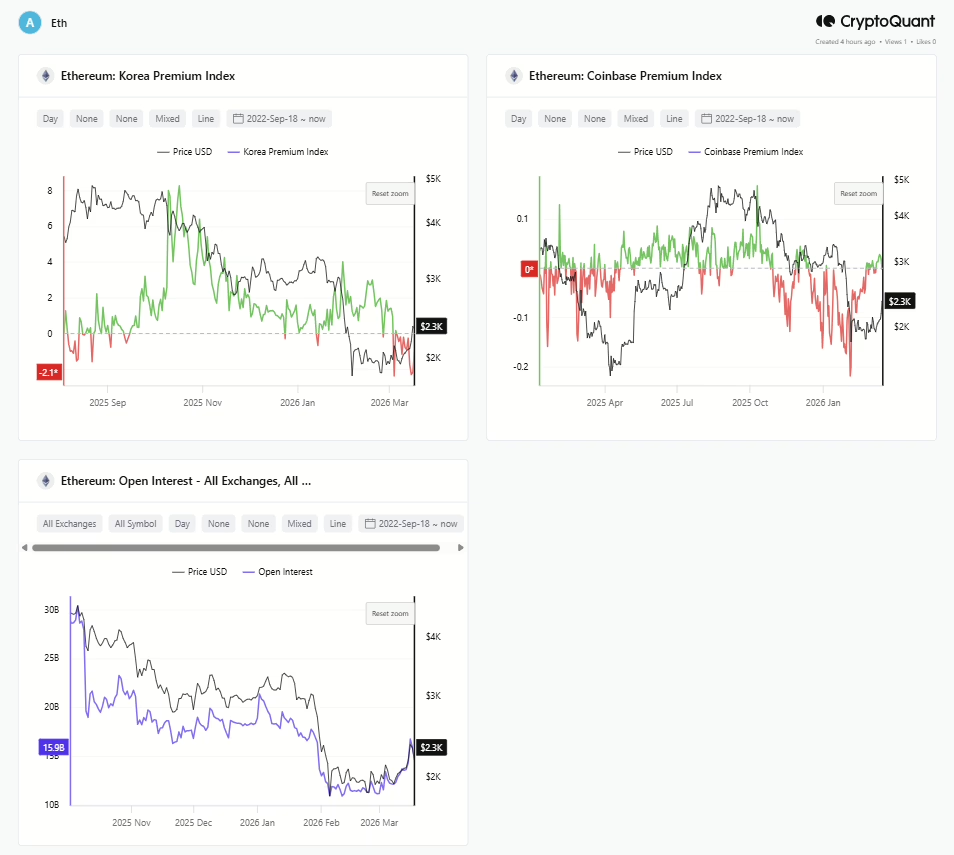
Although it retraced, it became green again a few days ago, suggesting that the whales were accumulating. It maintains this reading until Tuesday. It remains to be seen if it becomes red on Wednesday.
Nonetheless, the Korea Premium Index is currently negative. It shows what retailers and short-term holders are doing. With the metric currently negative, the asset is experiencing notable selling pressure from this cohort.
Interestingly, the metric has been on a downtrend since Mar 3, when the asset saw notable increases. In a nutshell, these retailers and short-term holders have been selling since the first week. It means that while the whales were accumulating, the other group was selling. It appears that retailers’ selling is finally affecting Ethereum, resulting in the latest decline.
Away from the spot market, the derivatives market is also receiving attention at the time of writing. The open interest has fallen sharply at the first instance of a price decline. Liquidations also increased over the last 24 hours, resulting in traders losing over $170 million.
These traders have since flipped bearish as they lost confidence in further increases. Recent data from Alphractal shows a decline in long positions as of Mar 17. If the trend continues, Ethereum will retrace even lower in the coming days.
Ethereum to $1,930?
With onchain and price-related indicators flipping bearish, a further decline is almost inevitable. The fibonacci retracement levels on the 1-day shows a gradual progression of price. For most of February, the asset trended below the 23% mark.
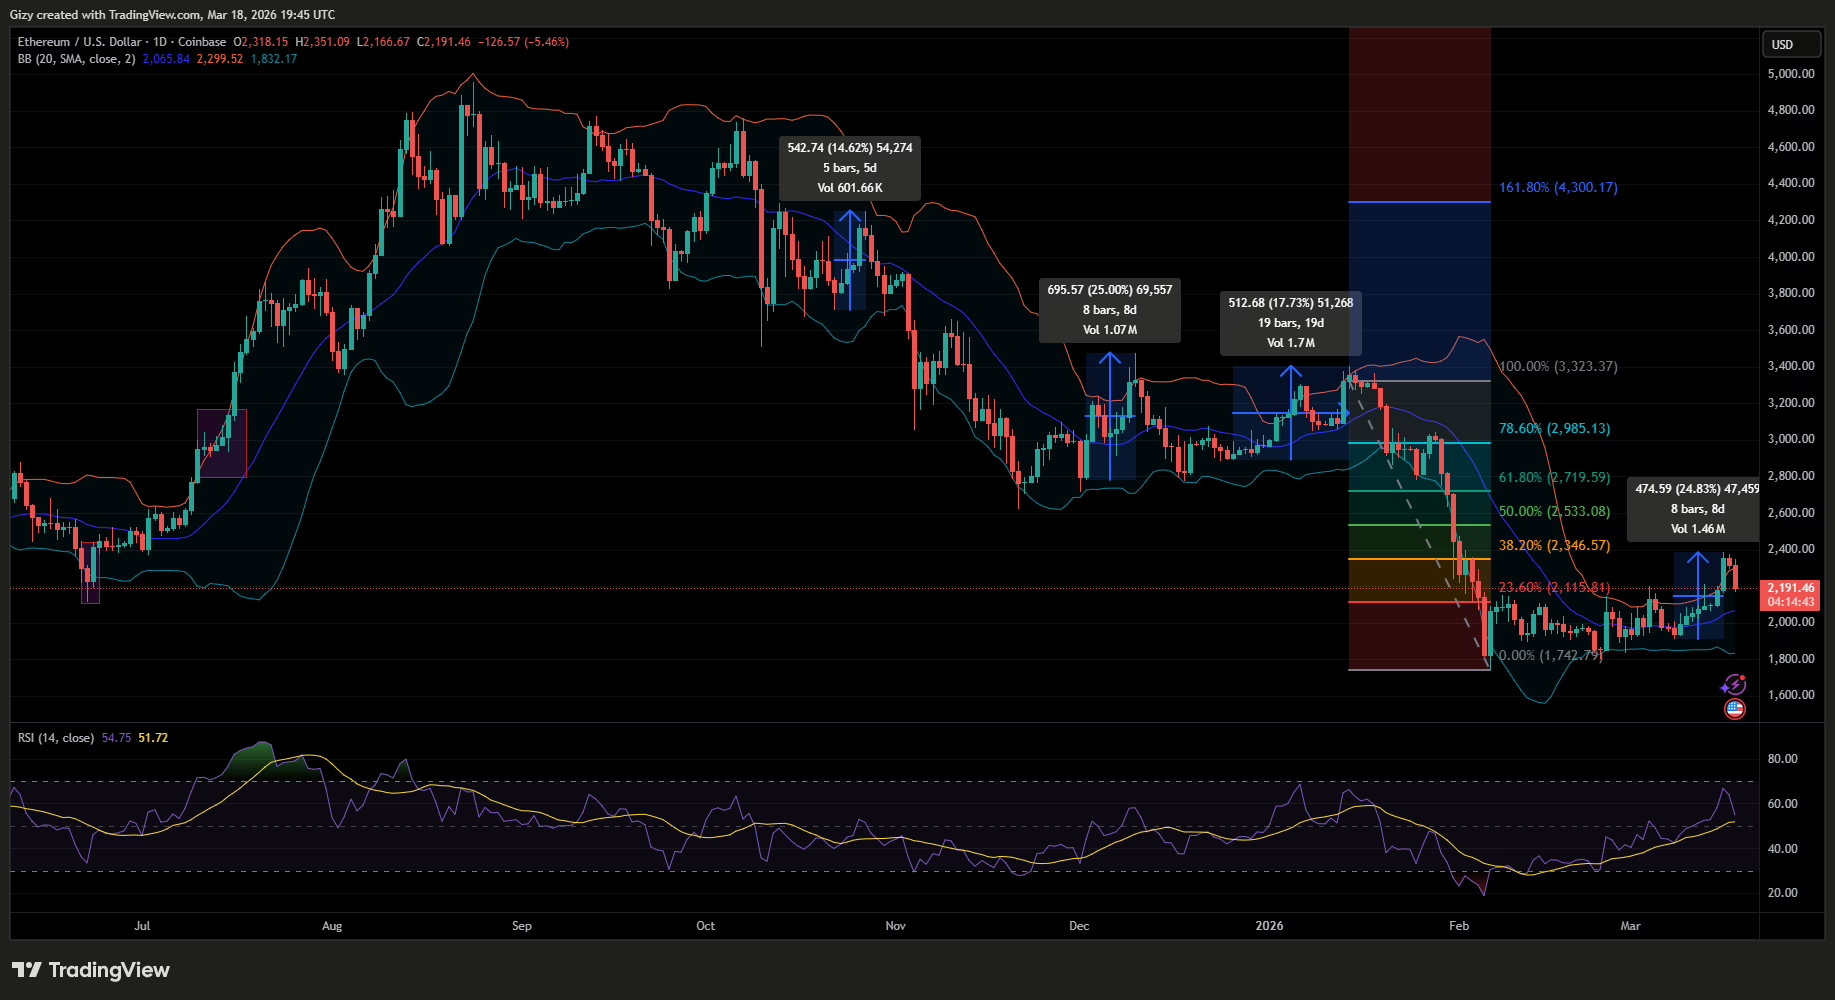
However, it changed a few days ago when it broke out from the mark and briefly flipped the 38% fib level. It faced rejection afterward, resulting in the ongoing decline, but it still maintains trading above the 23% level.
While the chances of holding this key mark have significantly decreased, a defense will guarantee another shot at $2,400. Nonetheless, losing it will see Ethereum return to trading below the fib level. Previous price movement suggests an increased chance of slipping below $1,900 after losing the barrier.
In hindsight, there is notable demand concentration at $1,930. A rebound may take place at this key level.
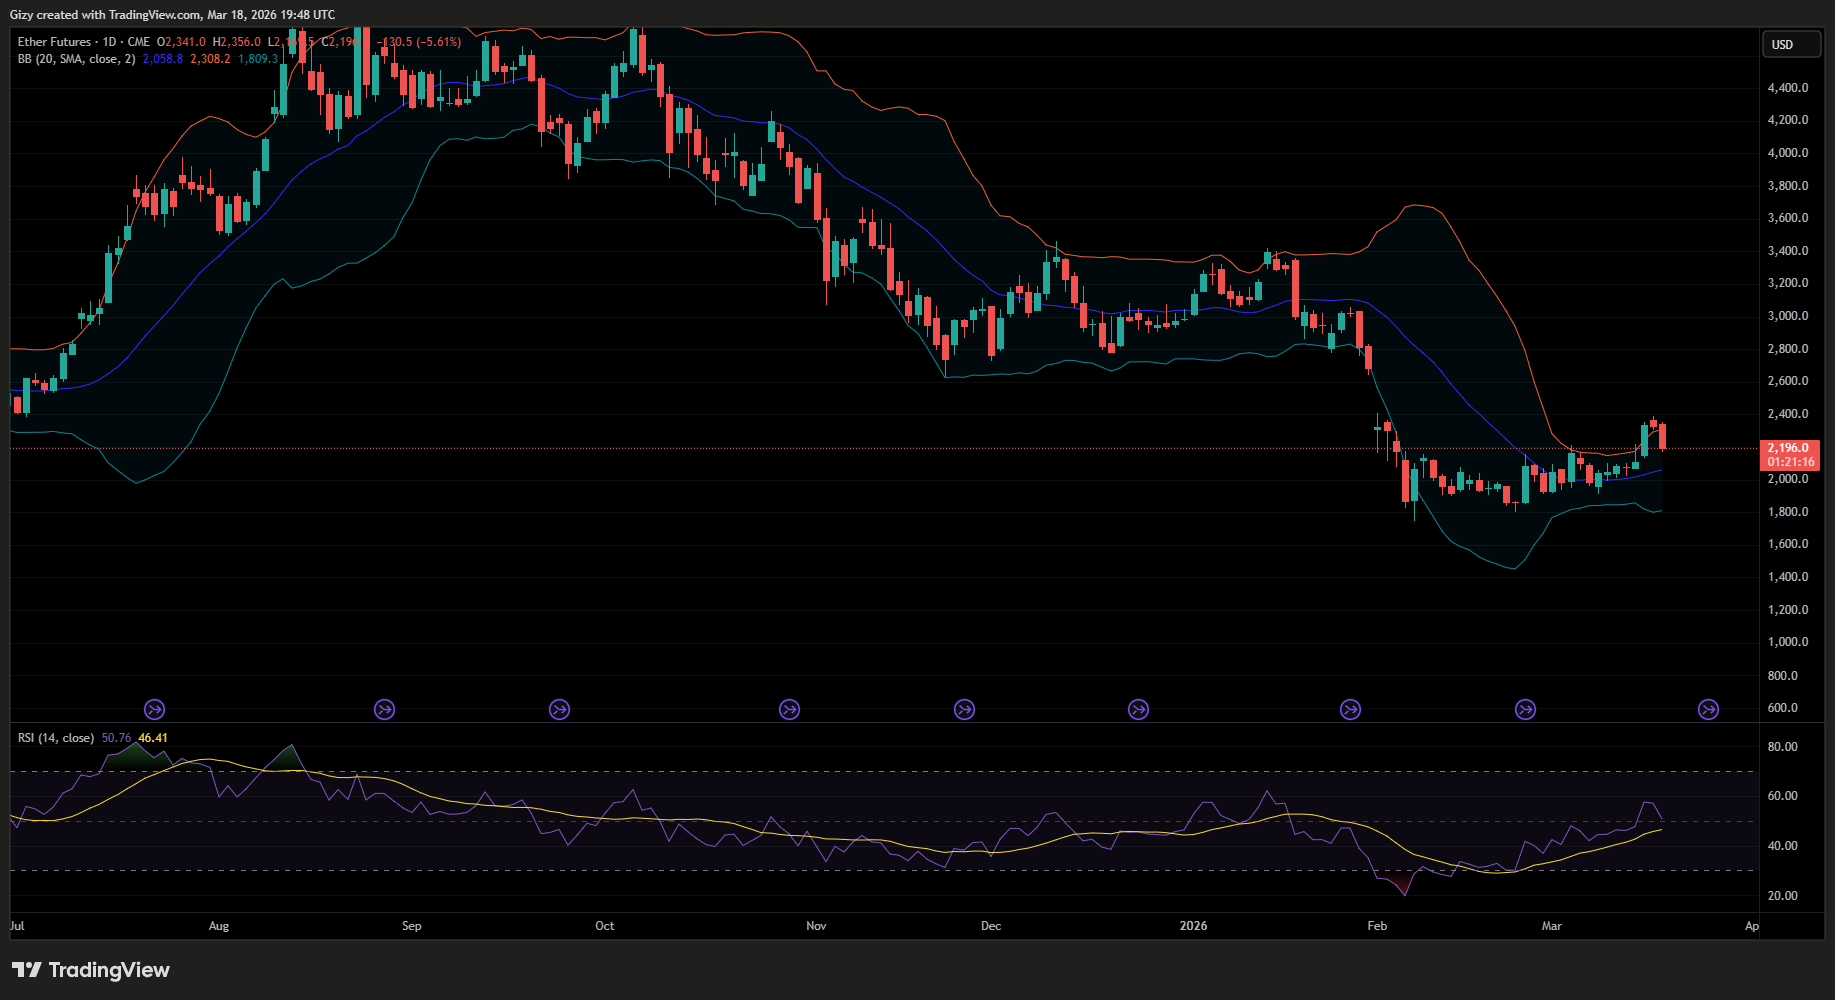
While exploring the possibility of a massive decline, it is also important to consider what may happen afterward. A closer look at the chart above is an Ethereum CME chart. It shows a huge gap that is yet to be filled.
During its massive retracement between late January and early February, the altcoin created a gap between $2,641 and $2,405. It’s been open for almost two months due to significant selling pressure and the bearish market.
However, price action in March has shown that fears and doubts have significantly decreased, increasing the likelihood of a filling within the next three weeks. Nonetheless, it hinges on the bulls halting a slip below $1,930.
In summary, Ethereum will inevitably retrace in the coming days, but the chances of recovery are high. Following its rebound, it may surge above $2,600 afterward.
Ethereum Uptrend Enters Week 2
Ethereum ended the previous week with gains of more than 12%. It was off to a good start on Monday, but it has almost completely shed all its previous gains.
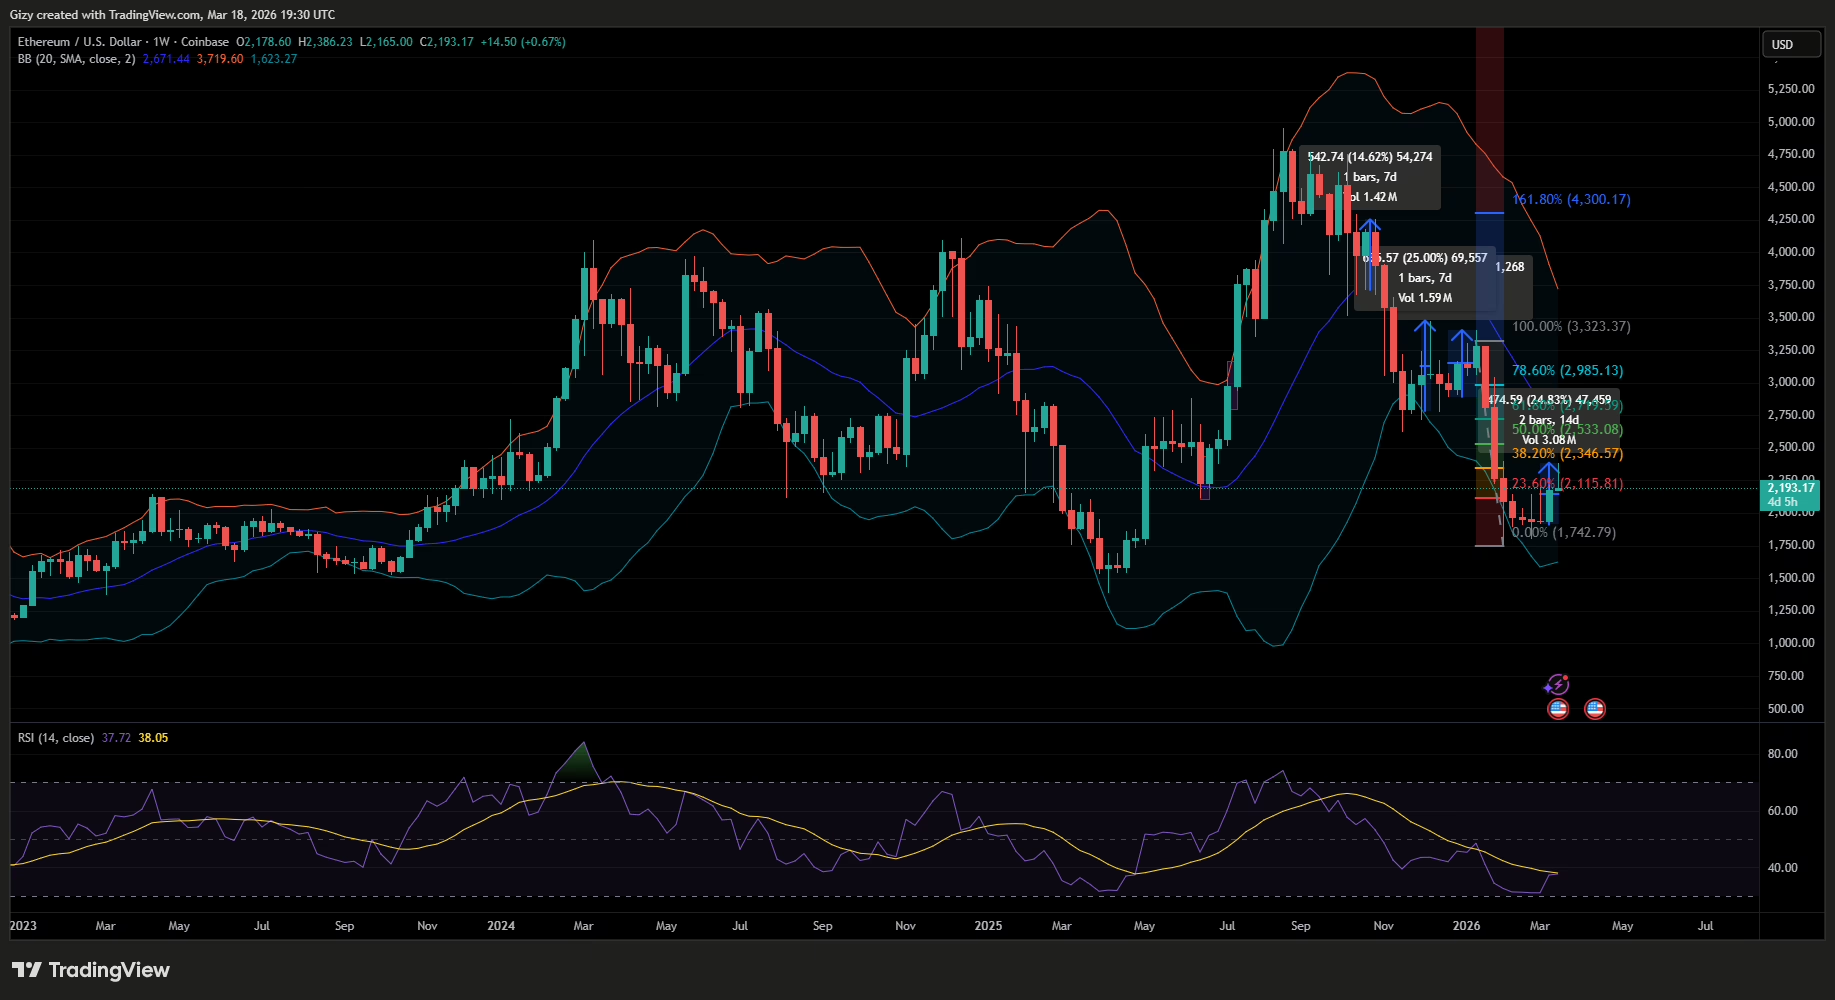
Nonetheless, the relative strength index on the 1-week scale suggests that the coin will resume its uptrend soon. The metric trended at 31 for an extended period before its latest. Evidently, it trended upwards as buying pressure improved.
While the indicator itself only points to a rise or fall in buying pressure, prior movements suggest further increases. A closer look at the chart shows it’s at 37. Previous uptrends have ended close to 50. If the pattern repeats, ETH will surge higher in the coming days.
The post Ethereum Rally Fades — Is a Drop to $1,930 Next? appeared first on CoinTab News.
0
0


 Manage all your crypto, NFT and DeFi from one place
Securely connect the portfolio you’re using to start.

0
0


0
0