Crypto Market in Decline: Ethereum Pays the Price! Analysis from August 7, 2024

0
0
Ethereum records a weekly drop of 37% following the global decline in the crypto market. Let’s examine together the future prospects for ETH.

Ethereum (ETH) Price Situation
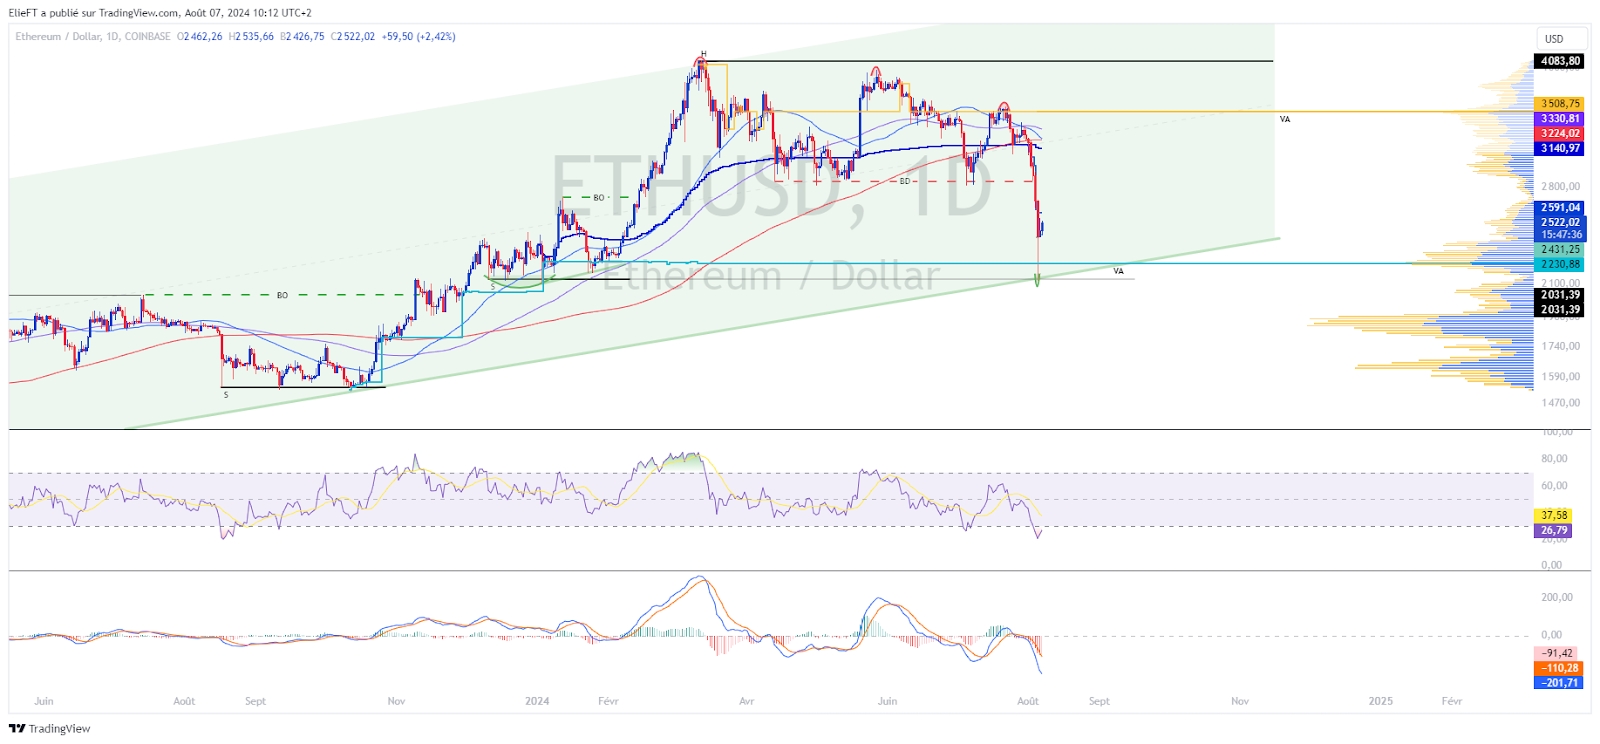
Following the official launch of Ethereum spot ETFs, ETH went into the red, prompting increasing selling pressure. Indeed, the crypto recorded a decline of over 40% in two weeks, falling from around $3,600 to $2,100. Note: this decline was fueled by the overall crypto market downturn, due to poor economic results worldwide, as well as significant geopolitical tensions, notably linked to Iran. Therefore, Ethereum broke its support at $2,800. It is around $2,100 that the crypto has sparked a buying interest that seems to persist to this day.
At the time of writing, the price of Ethereum is trading just below $2,500. As encouraging as this may seem, continued buyer support will be needed to counter ETH’s short-term downtrend. Regarding the medium to long-term trend of the crypto, although it remains theoretically bullish, it is not surprising that uncertainty reigns about its future. This is because Ethereum is making lower and lower lows and is below its annual VWAP as well as its 50 and 200-day moving averages, visibly ready to form a death cross. On the crypto momentum side, it is not surprising that it has been revised downwards. This is reflected in the price of Ethereum itself as well as its oscillators being revised down. Naturally, all these elements leave room for uncertainty about the future of the crypto’s price.
The current technical analysis was conducted in collaboration with Elie FT, an investor and passionate trader in the cryptocurrency market. Today, he is a trainer at Family Trading, a community of thousands of proprietary traders active since 2017. There you will find Lives, educational content, and mutual aid around financial markets in a professional and warm atmosphere.
Focus on Derivatives (ETHUSDT)
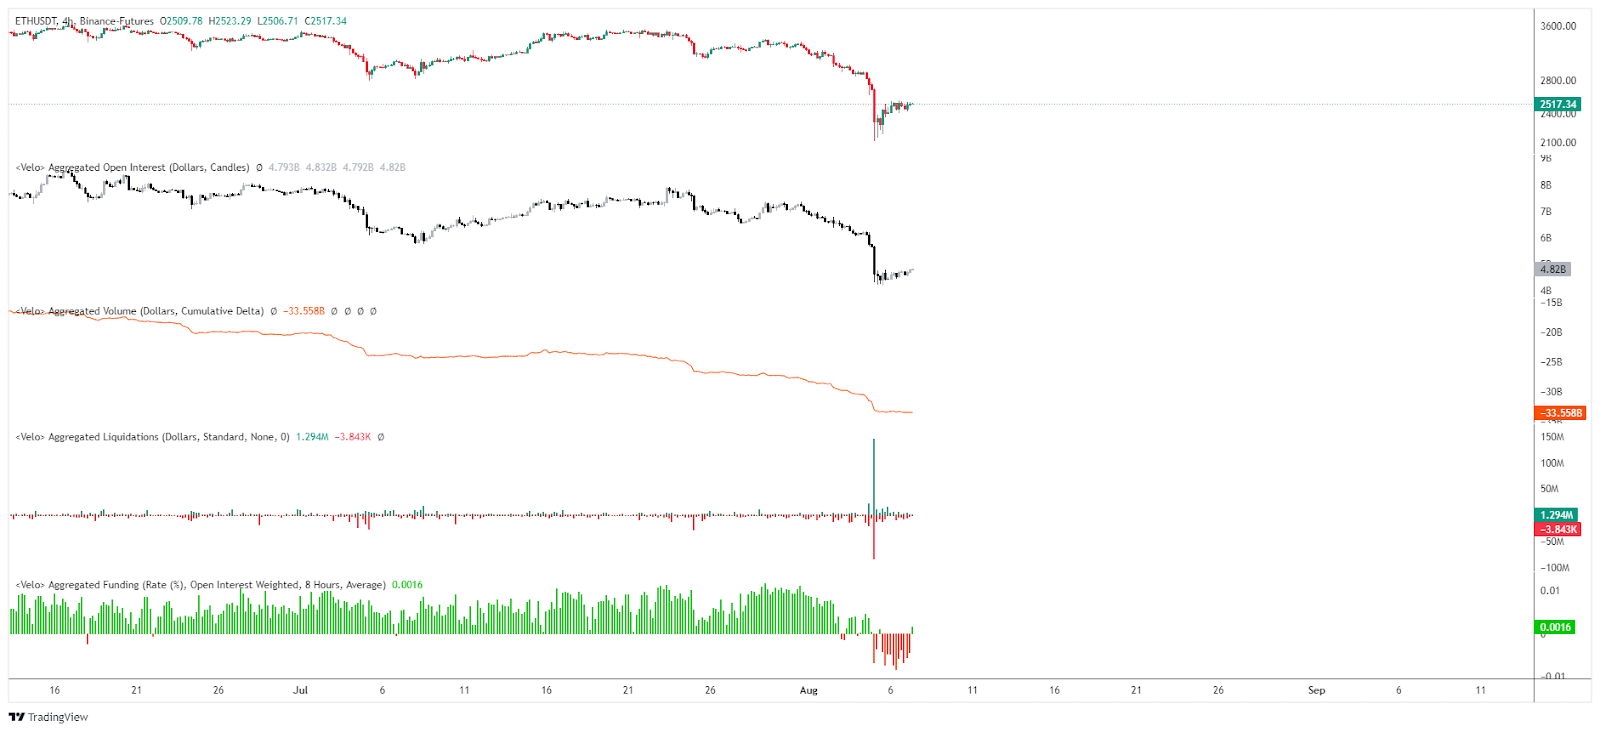
The decline of Ethereum has inevitably led to a decrease in open interest on ETH perpetual contracts. This demonstrates a speculative interest revised downwards during the recent fluctuations of the crypto. The decline in CVD and the funding rate indicates a recently dominant selling sentiment on derivatives related to Ether. Regarding liquidations, significant liquidations of long positions can be observed, followed by short positions, illustrating pronounced volatility.
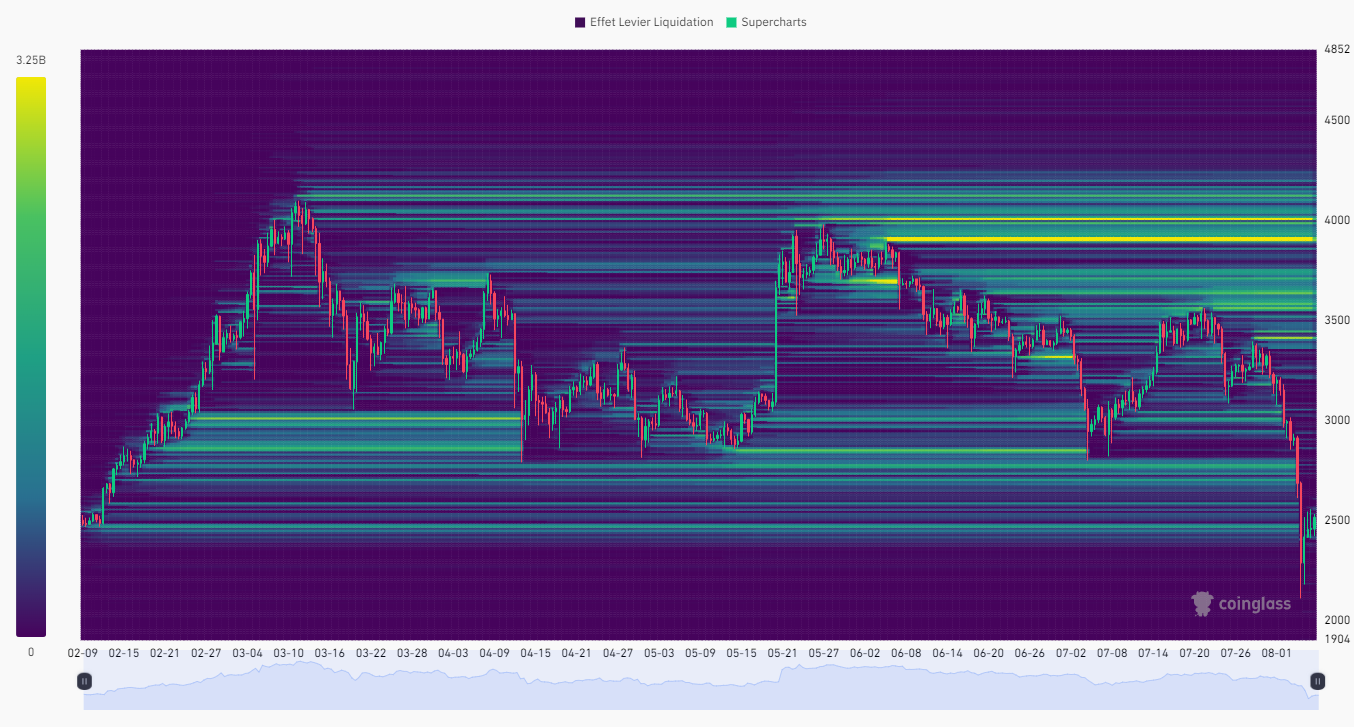
The liquidation heatmap of ETH/USDT over the last six months reveals that the liquidation zone identified between $2,800 and $2,400 has been reached. This does not seem to have sparked direct buyer interest given the crypto’s reaction to its contact. At present, the notable liquidation zones are mostly above the current price of Ethereum. One can note the zone between $3,400 and $3,750, and higher up, the most important zone around $3,900 to $4,100. The approach of the price to these levels could trigger a massive order activation, thereby increasing the risk of a period of heightened volatility for Ethereum. These zones therefore represent a crucial point of interest for investors.
Hypotheses for Ethereum (ETH) Price
- If the price of Ethereum remains above $2,100, we could anticipate a bullish continuation, leading to a reintegration of $2,800. The next resistance to consider would then be around $3,100. If the bullish movement continues, it could lead to a target of $3,500, representing a more than 41% increase.
- If the price of Ethereum fails to stay above $2,100, a return to $2,000 could be considered. The next support to take into account, if the bearish movement continues, would be around $1,900. Further down, one can note the area of interest above $1,700, representing a drop of about 50%.
Conclusion
Ethereum experienced a significant decline following the launch of Ethereum spot ETFs, amplified by economic and geopolitical factors. Despite some buyer support, uncertainty remains about its future trend. Therefore, it will be crucial to closely observe the price’s reaction to the different key levels to confirm or invalidate the current hypotheses. It is also important to stay alert to potential “fake outs” and “squeezes” in the market in each scenario. Finally, let us remember that these analyses are based solely on technical criteria and that cryptocurrency prices can also evolve rapidly based on other more fundamental factors.
0
0


 Manage all your crypto, NFT and DeFi from one place
Securely connect the portfolio you’re using to start.

0
0

0
0

0
0
