Is PEPE Price at a Make-or-Break Moment? Will the Memecoin Rally or Retreat?

0
0
The post Is PEPE Price at a Make-or-Break Moment? Will the Memecoin Rally or Retreat? appeared first on Coinpedia Fintech News
PEPE, one of the most volatile memecoins, is currently navigating a critical juncture on the charts. After peaking at $0.000028 in late 2024, the asset has entered a corrective phase, now hovering near $0.00001. Technicals suggest a shift in momentum, with the RSI dipping below neutral levels and the MACD signaling bearish divergence. As whale movements and profit-taking weigh on price action, it would be interesting to watch the next course of action of the PEPE price rally!
On the daily chart, PEPE has lost momentum after repeated rejections near the $0.000012 resistance zone. This level has formed a short-term ceiling, with each rally attempt being met with selling pressure. Meanwhile, the tokens sustain a bullish pattern, which hints towards a potential upswing; however, securing levels above $0.000011 is very important. As bearish clouds may continue to haunt the rally until then.
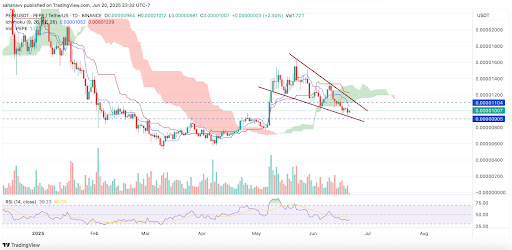
PEPE price has printed a clear falling wedge pattern with multiple bounces on both support and resistance. Price is hovering near the wedge apex while holding just above a key support zone below $0.00001. A bullish breakout would likely send it toward the $0.0000135 to $0.000014 resistance zone where previous liquidity pooled. While the RSI has displayed a bullish divergence, the Ichimoku cloud raises some concerns.
The conversion line has plunged and maintains a steep descending trend while the cloud has flipped to bearish. This suggests the PEPE price continues to face significant selling pressure while the volume is lowering consistently. On the other hand, the MACD also flipped bearish with a declining histogram, indicating waning bullish strength. Therefore, if the support breaks, the support at $0.000095 could be tested, or else a bullish continuation could help price reclaim $0.0000115 to $0.000012.
0
0


 Manage all your crypto, NFT and DeFi from one place
Securely connect the portfolio you’re using to start.


