Fartcoin 8% Drop Puts Meme Coin in Critical Support Zone Battle

0
0

- Fartcoin price is down by 8% as bears are trying to pull the price down.
- The meme coin indicators are giving a neutral sign as bulls and bears are fighting.
Fartcoin is in a precarious neutral territory where bulls and bears are in a heated tug-of-war on major technical levels. The memecoin is trading at around the price of $1.0670, and it is in a position where it is trapped between some major moving average support and resistance levels that are dictating the prevailing market structure. As per CMC data, the price has gone down by 8% in the last 24 hours and suggesting bearishness.
The price behaviour shows a very interesting story of strength against the bearish pressure. Fartcoin is finding it difficult to hold above the 50-day exponential moving average (EMA) of $1.1108. This level has turned out to be a key battlefield with bears applying all their pressure to take the price down and the bulls putting up a stiff resistance to keep the price up. The fact that this struggle is still going on indicates that the market players are reevaluating the fair value of the asset in the prevailing conditions.
The bullish argument is also backed by the 200-day EMA at $0.8690, which has been offering long-term structural support. This level has been a good support in the past, and the fact that it is currently at this level implies that the trend is still positive in the long run despite the short-term fluctuations. The distance between the 50-day and 200-day EMAs is a sign that the short-term bullish trend has slowed down, but the long-term bullish pattern is still in place.
What’s Next For Fartcoin?
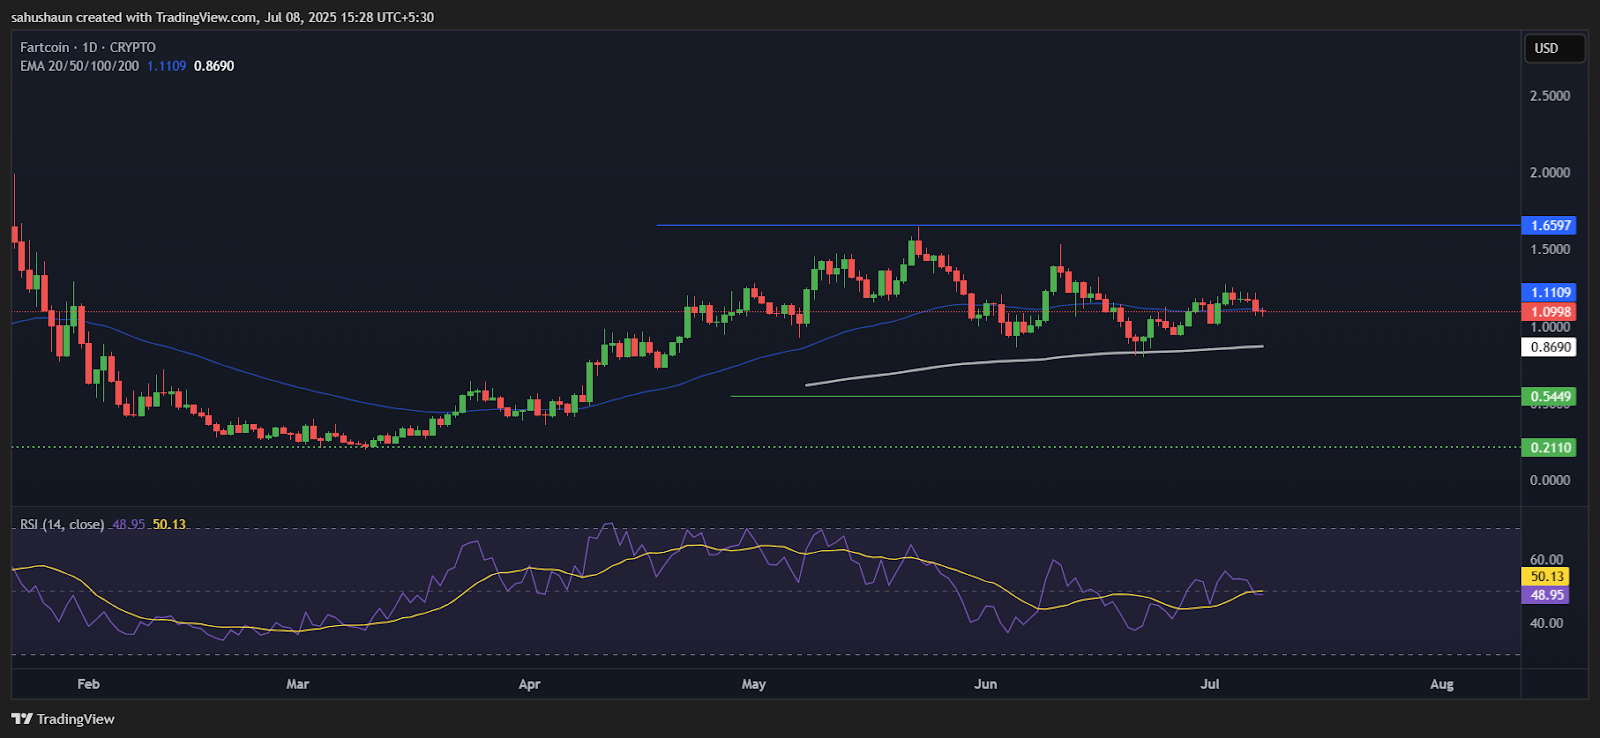
Technical indicators are giving a mixed signal that is consistent with the neutral zone description. Relative Strength Index (RSI) is at 48.80, which is neither bullish nor bearish, but it is neutral, and there is no directional bias. This neutral interpretation implies that the bulls and the bears have not taken definitive control, and the price discovery is still going on.
The MACD histogram is still green and the MACD line is still in positive area but the signals have become neutral. This formation indicates that although the underlying momentum has not entirely turned bearish, the bullish momentum that has been behind the past rallies has greatly reduced. The fact that these momentum indicators have been converging to neutral levels can be an indication that a consolidation period is about to take place or a clear breakout in either direction.
The Fartcoin price is now resting on the median line of the Bollinger Bands, which is a dynamic support level in the period of consolidation. The Bollinger Bands indicator suggests the price can bounce from the median line.
Looking at the support and resistance levels $0.8690 is acting as a crucial support poin,t which is also the 200-day EMA level. On the other side, $1.2700 is key resistance bulls have to overcome to start a bullish rally..
Highlighted Crypto News Today:
ETH Watch: Will Whale Wake-Ups and Government Transfers Heat Up the Ethereum Charts?
0
0


 Manage all your crypto, NFT and DeFi from one place
Securely connect the portfolio you’re using to start.