Optimism (OP) in Bearish Trend After Breaking $2.05 Level

0
0

Optimism (OP) saw a bearish trend of -35% in June, sparking growing fear in the market and hesitation among investors.
This analysis will guide you in understanding and monitoring key indicators from both the technical and fundamental analysis of Optimism.
Technical Analysis of Optimism
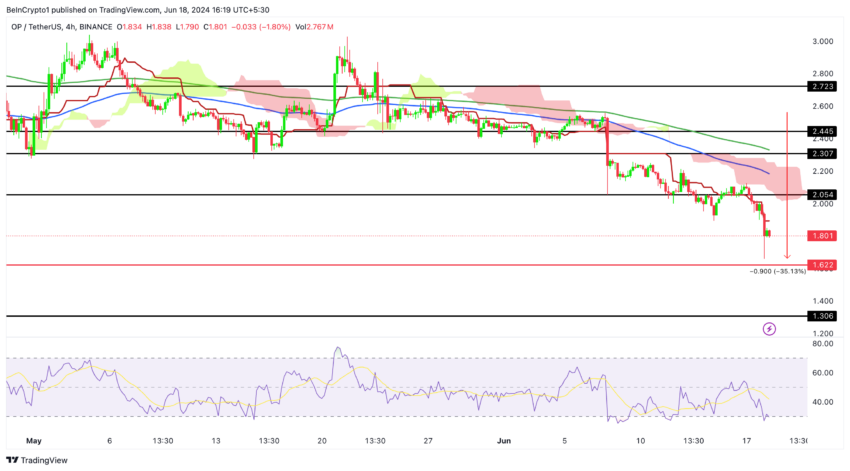
Optimism is currently showing a bearish trend on the 4-hour chart. The 100-period Exponential Moving Average (EMA), represented by the blue line, acts as a dynamic resistance level, and the price is currently below this line, indicating ongoing bearish momentum.
The 200-period EMA, represented by the green line, also has a significant resistance level, and the price is well below it, further reinforcing the bearish sentiment. Additionally, the Relative Strength Index (RSI) is below 40, which suggests that selling pressure remains dominant.
Read More: Optimism vs. Arbitrum: Ethereum Layer-2 Rollups Compared
 Optimism Price Analysis (4H). Source: TradingView
The Ichimoku Cloud provides further insight into the bearish outlook. The cloud is shaded in green and red, and the price is currently below it, signaling continued downward momentum.
The cloud’s red color further confirms this bearish trend. Key support levels to monitor are $1.622 and $1.306, with major resistance levels at $2.054, $2.307, $2.445, and $2.723. The RSI being below 40 indicates that the market sentiment is still bearish.
The overall trend for Optimism (OP/USDT) on the 4-hour chart remains bearish, as indicated by the price’s position below both the 100 EMA and 200 EMA and the Ichimoku Cloud, signaling downward momentum. Traders should be cautious and watch for potential rebounds at the support levels of $1.801 and $1.622 or further declines if these levels are breached.
Conversely, a break above the $2.05 resistance level and the Ichimoku Cloud could mean a potential bullish reversal.
Analysis of Optimism Profitability Metrics
Understanding the economic sentiment and behavior of participants within the Optimism blockchain network is essential for making informed decisions.
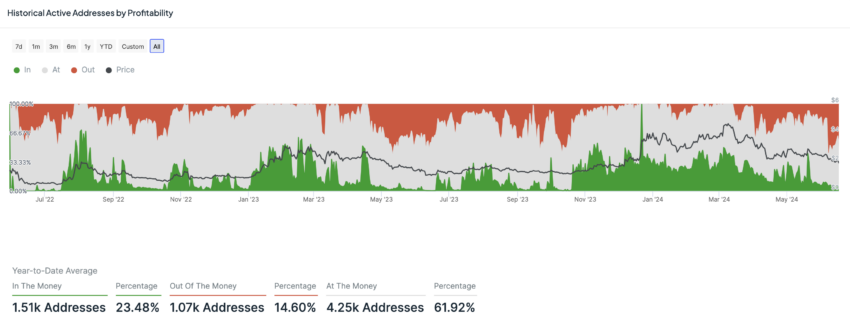
To do this, we look at the profitability of active addresses on the network. These active addresses are divided into three categories based on whether they are making a profit or loss: out of the money (addresses that are currently incurring losses), at the money (addresses that are breaking even), and in the money (addresses that are currently making a profit).
In June, the percentage of addresses losing money fluctuated a lot. It reached a high of 58.52% on June 8 and a low of 16.23% on June 5. From June 1 to June 7, this percentage rose from 15.12% to 56.22%, with a big jump on June 7.
By June 17, this percentage had decreased to around 48%, showing that fewer addresses were losing money compared to the peak on June 8.
Read More: What Is Optimism (OP)
 Optimism: Active Addresses Profitability. Source: IntoTheBlock
The percentage of addresses breaking even showed various trends, ranging from 35.60% on June 8 to 77.12% on June 16. From June 1 to June 7, the percentage dropped from 78.50% to 37.61%, with a sharp decline on June 7. After reaching a low of 37%, the percentage climbed back up to 57% on June 16 and settled at 47% on June 17.
The percentage of addresses making a profit changed moderately throughout June. On June 5, the peak was 10.24%, meaning only 10% of active addresses were in profit at the trading price range of $2 – $2.90. From June 1, the percentage increased from 6.37% to 10.24% on June 5, then decreased to 5.35% on June 17.
When a high percentage of addresses are losing money, it indicates that many participants are facing losses. This can lead to increased sell pressure, where more people might sell their holdings to cut losses, leading to bearish market sentiment. Fluctuations in the percentage of addresses breaking even suggest periods of uncertainty or stability.
Strategic Recommendations
As highlighted in the analysis, both the fundamental and technical outlooks are bearish. For a potential reversal to a bullish trend, OP must rise above the critical resistance level of $2.05. This level is essential to monitor, as breaking it could signal a shift in market sentiment. Additionally, traders should watch the 4-hour Ichimoku Cloud. If OP breaks through the cloud to the upside, it could mark the end of the current bearish trend and the start of a bullish phase.
In the event that the Optimism price fails to break the $2.05, the bearish continuation could be confirmed. Monitoring the profitability of active addresses is a good way to understand if there is significant pain in the market. Buying during extreme pain can be a strategic move for long-term holders, especially since we are in a crypto bull market that is not over yet.
0
0


 Gestisci cripto, NFT e DeFi in un unico luogo
Connetti in sicurezza il portafoglio che usi per iniziare.


0
0


0
0