Altcoin Season Index Plummets to 45: A Critical Signal for Crypto Market Cycles

0
0

BitcoinWorld
Altcoin Season Index Plummets to 45: A Critical Signal for Crypto Market Cycles
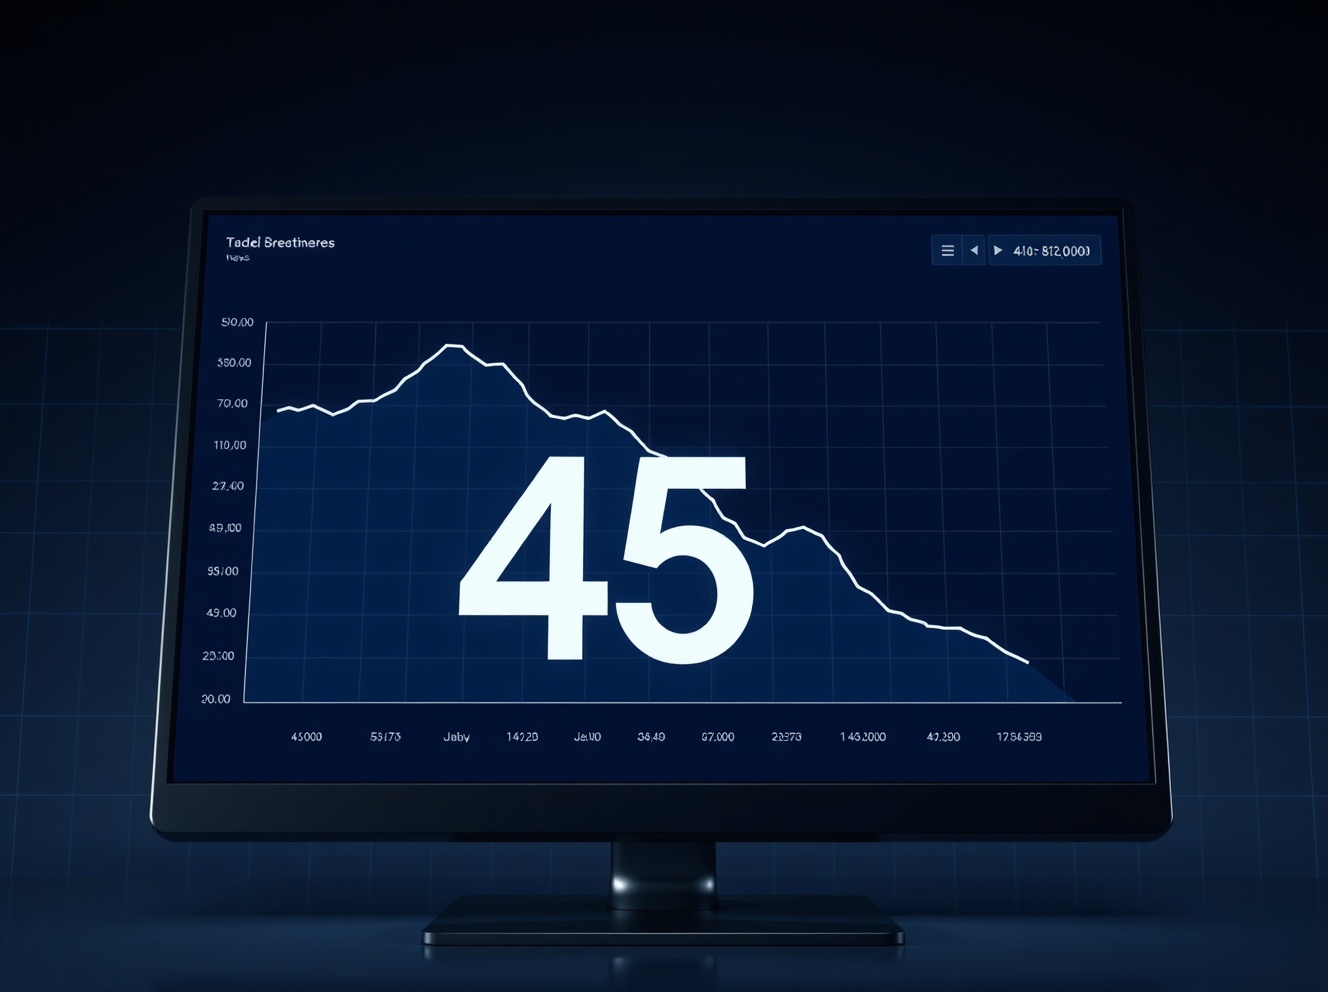
A key cryptocurrency market indicator, the Altcoin Season Index, has plunged to a reading of 45, marking a significant 4-point drop from the previous day and signaling a potential shift in investor sentiment and capital flows within the digital asset ecosystem. This movement, tracked by the prominent data aggregator CoinMarketCap, provides a crucial snapshot of the ongoing performance battle between Bitcoin and the broader altcoin market. Consequently, analysts and investors are now scrutinizing this data to gauge the market’s current phase and potential future trajectory.
Understanding the Altcoin Season Index Drop
The Altcoin Season Index serves as a primary barometer for measuring market cycles. Specifically, it compares the 90-day price performance of the top 100 cryptocurrencies, excluding stablecoins and wrapped tokens, against Bitcoin’s performance over the same period. A score closer to 100 indicates a stronger altcoin season, where a majority of these assets are outperforming the pioneer cryptocurrency. Conversely, a score below 50 typically suggests Bitcoin is leading the market. The recent drop to 45 clearly indicates that less than half of the top altcoins are currently beating Bitcoin over the last quarter. This movement often reflects a ‘risk-off’ sentiment, where capital flows from more speculative altcoins back into the perceived relative safety of Bitcoin.
Historically, the index has experienced dramatic swings. For instance, during the bull market of late 2020 and early 2021, the index repeatedly breached the 75 threshold, officially declaring multiple altcoin seasons. However, subsequent bear markets saw the index languish in the 20-40 range for extended periods, highlighting prolonged Bitcoin dominance. The current reading of 45 sits in a transitional zone, suggesting neither asset class holds definitive dominance but that Bitcoin may be gaining an edge. This data point is not an isolated signal but rather one piece of a larger puzzle that includes trading volume, derivatives market activity, and macroeconomic factors.
The Mechanics of Market Seasonality
Cryptocurrency markets often move in recognizable cycles, frequently described in terms of ‘seasons.’ An official ‘altcoin season’ is declared when 75% of the top 100 coins outperform Bitcoin over a 90-day window. The opposite condition, where Bitcoin consistently outperforms the majority of altcoins, is termed a ‘Bitcoin season.’ These phases are driven by complex interplays of liquidity, investor psychology, and technological development cycles. During a Bitcoin season, narrative focus often shifts to macro-economic store-of-value themes, such as inflation hedging. Alternatively, altcoin seasons are frequently fueled by narratives around decentralized finance (DeFi), non-fungible tokens (NFTs), or new layer-1 blockchain platforms capturing investor imagination.
Historical Context and Expert Analysis
Market analysts often reference previous cycles to contextualize current data. The index’s drop to 45 mirrors patterns seen in early 2023, where brief altcoin rallies were quickly followed by a reversion to Bitcoin strength. This pattern suggests that while altcoins can experience sharp, sentiment-driven rallies, sustained outperformance requires broader adoption and fundamental network growth. Experts point to several concurrent factors that could explain the current dip: a potential cooling in speculative retail interest, institutional portfolios rebalancing towards Bitcoin ETFs, or a simple consolidation phase following recent price gains in select altcoins. The 90-day measurement period also means the index reacts slowly, capturing medium-term trends rather than daily volatility.
The impact of this reading is multifaceted. For traders, a lower index may signal a strategy shift towards Bitcoin-centric positions or large-cap, more established altcoins with stronger correlations to Bitcoin. For long-term investors, it may represent a potential accumulation phase for fundamentally sound altcoins that are temporarily underperforming. Furthermore, blockchain developers and project teams monitor these trends closely, as capital inflows during altcoin seasons can directly fuel ecosystem growth and innovation funding. The table below summarizes the typical market interpretation of key index ranges:
Index Range Interpretation:
- 0-25: Strong Bitcoin Season. Bitcoin dominance is high.
- 26-49: Transitional Phase, leaning towards Bitcoin.
- 50-74: Transitional Phase, leaning towards Altcoins.
- 75-100: Official Altcoin Season declared.
Broader Market Implications and Data Verification
The Altcoin Season Index does not operate in a vacuum. Its signal must be corroborated with other on-chain and market metrics to form a complete picture. For example, analysts cross-reference this data with Bitcoin’s dominance chart, which measures Bitcoin’s market capitalization as a percentage of the total crypto market cap. A falling Altcoin Season Index often coincides with a rising Bitcoin Dominance percentage. Additionally, trading volume ratios between Bitcoin and major altcoins provide real-time evidence of capital rotation. The recent 4-point single-day drop is notable for its speed, suggesting a potentially sharp move of capital rather than a gradual drift.
This development holds real-world significance for portfolio management. Financial advisors specializing in digital assets often use such indicators to guide asset allocation decisions. A reading of 45 may prompt a more conservative stance, increasing the weight of Bitcoin in a model portfolio while maintaining selective exposure to altcoins with proven utility and strong development activity. The index also serves as a valuable tool for media and educators to explain complex market dynamics to a broader audience, demystifying the often-opaque movements of cryptocurrency prices.
Conclusion
The decline of the Altcoin Season Index to 45 marks a pivotal moment in the ongoing evaluation of crypto market structure. This movement underscores the persistent cyclical nature of digital asset markets, where leadership rotates between Bitcoin and altcoins. While not yet indicative of a full Bitcoin season, the trend suggests a consolidation of momentum behind the market’s largest asset. Investors and observers should monitor this index alongside volume, volatility, and fundamental on-chain data to navigate the evolving landscape. Ultimately, the Altcoin Season Index remains a critical, evidence-based tool for understanding the complex and ever-shifting dynamics between Bitcoin and the thousands of alternative cryptocurrencies vying for market share.
FAQs
Q1: What does an Altcoin Season Index of 45 mean?
An index reading of 45 means that less than half of the top 100 cryptocurrencies (excluding stablecoins) have outperformed Bitcoin over the previous 90 days. It indicates a market phase where Bitcoin is showing relative strength compared to the broader altcoin market.
Q2: How is the Altcoin Season Index calculated?
CoinMarketCap calculates the index by comparing the 90-day price performance of each of the top 100 cryptocurrencies against Bitcoin’s performance over the same period. The percentage of these assets that outperform Bitcoin determines the index score.
Q3: What is the difference between an altcoin season and a Bitcoin season?
An ‘altcoin season’ is officially declared when the index reaches 75 or above, meaning 75% of top altcoins outperform Bitcoin. A ‘Bitcoin season’ is the general state where Bitcoin outperforms the majority of altcoins, typically corresponding with index readings below 50.
Q4: Is a low Altcoin Season Index bad for the crypto market?
Not necessarily. Market cycles are normal. A low index often indicates a period of consolidation or a shift in investor focus towards Bitcoin, which can provide stability. It can also create buying opportunities for undervalued altcoins before the next cycle shift.
Q5: How often should investors check the Altcoin Season Index?
For long-term investors, checking the index weekly or monthly is sufficient to understand the broader market cycle trend. Active traders may monitor it more frequently alongside other indicators to spot potential turning points in market sentiment.
This post Altcoin Season Index Plummets to 45: A Critical Signal for Crypto Market Cycles first appeared on BitcoinWorld.
0
0

 Manage all your crypto, NFT and DeFi from one place
Securely connect the portfolio you’re using to start.


0
0


0
0