Hedera (HBAR) Price Continues to Bleed as Market Confidence Hits New Lows

1
0

Hedera’s native token, HBAR, has recorded another day of losses, sliding 7% in the past 24 hours. At press time, the altcoin trades at $0.19.
The sustained downward trend comes as buying pressure weakens amid increasingly bearish market conditions.
Investors Exit HBAR as Key Indicators Signal Further Downside
BeInCrypto’s assessment of the HBAR/USD one-day chart reveals a steady decline in the token’s Accumulation/Distribution (A/D) Line since the beginning of March. This highlights the steady dip in the coin’s value over the past ten days.
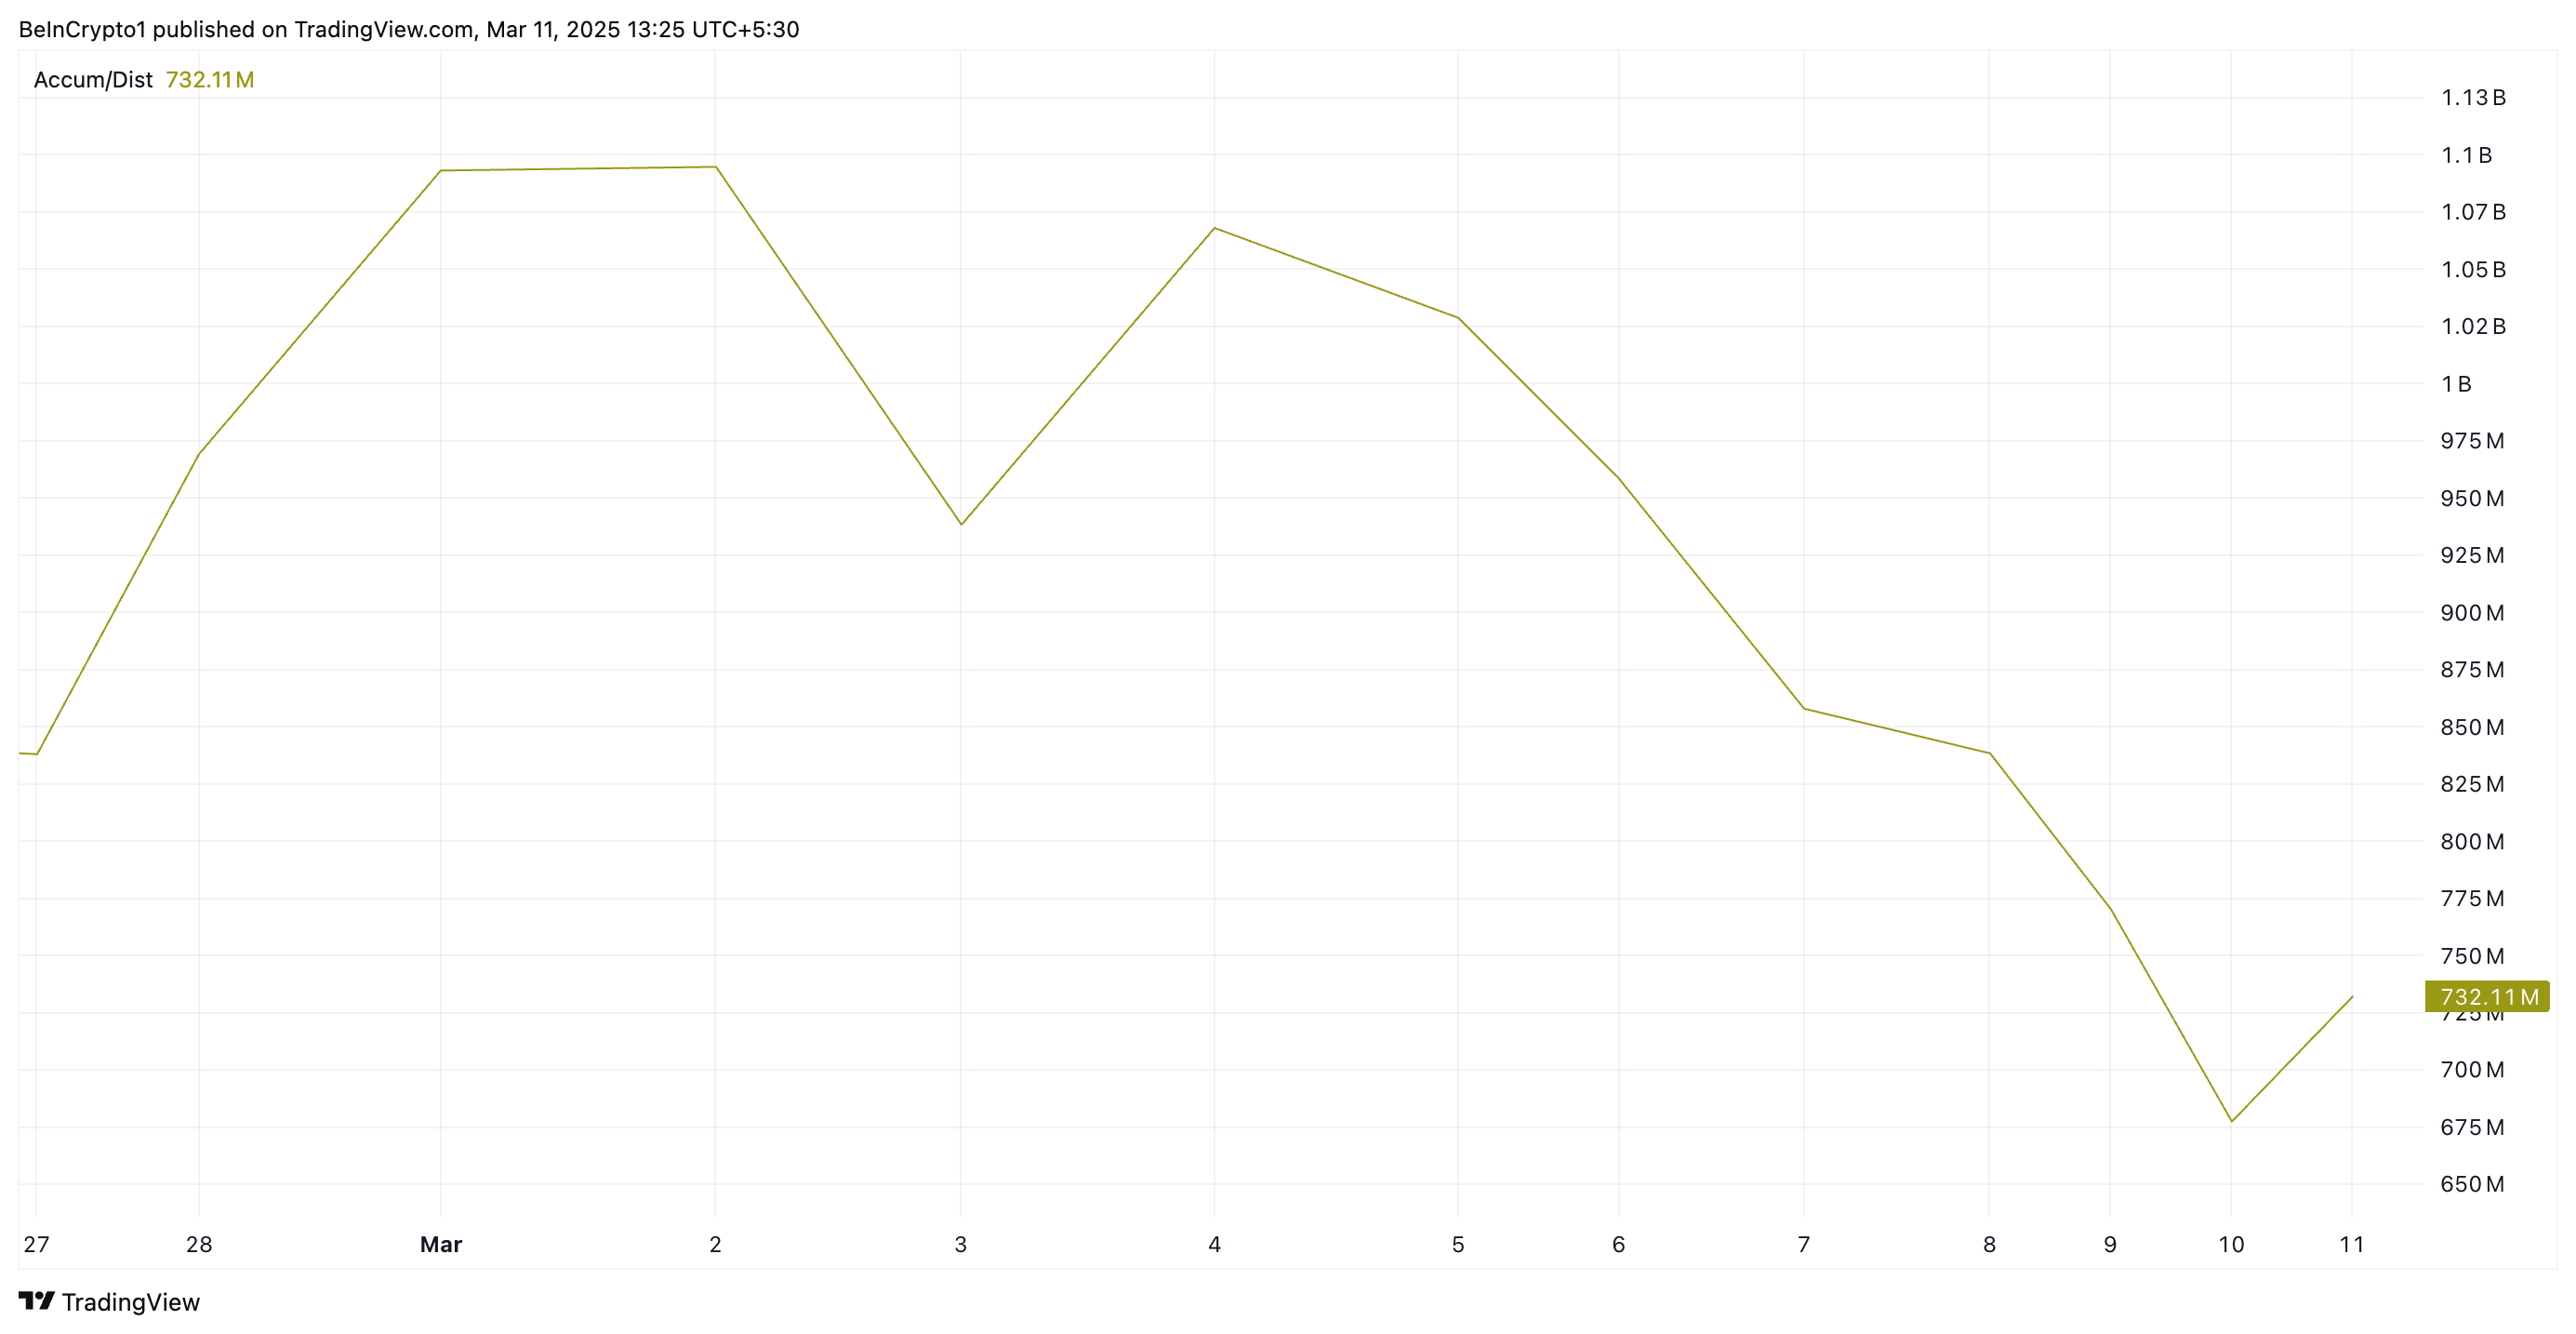 HBAR A/D Line. Source: TradingView
The A/D Line measures money flow into or out of an asset by analyzing its price movements and trading volume. When it declines, it indicates that selling pressure is increasing, as more traders are offloading the asset rather than accumulating it.
As with HBAR, a persistent downtrend in the A/D Line suggests weakening demand and signals further short-term price declines.
HBAR’s Relative Strength Index (RSI) has also plummeted, confirming growing sell-side pressure as investors pull funds from the market. As of this writing, this indicator, which measures an asset’s oversold and overbought market conditions, is at 40.10.
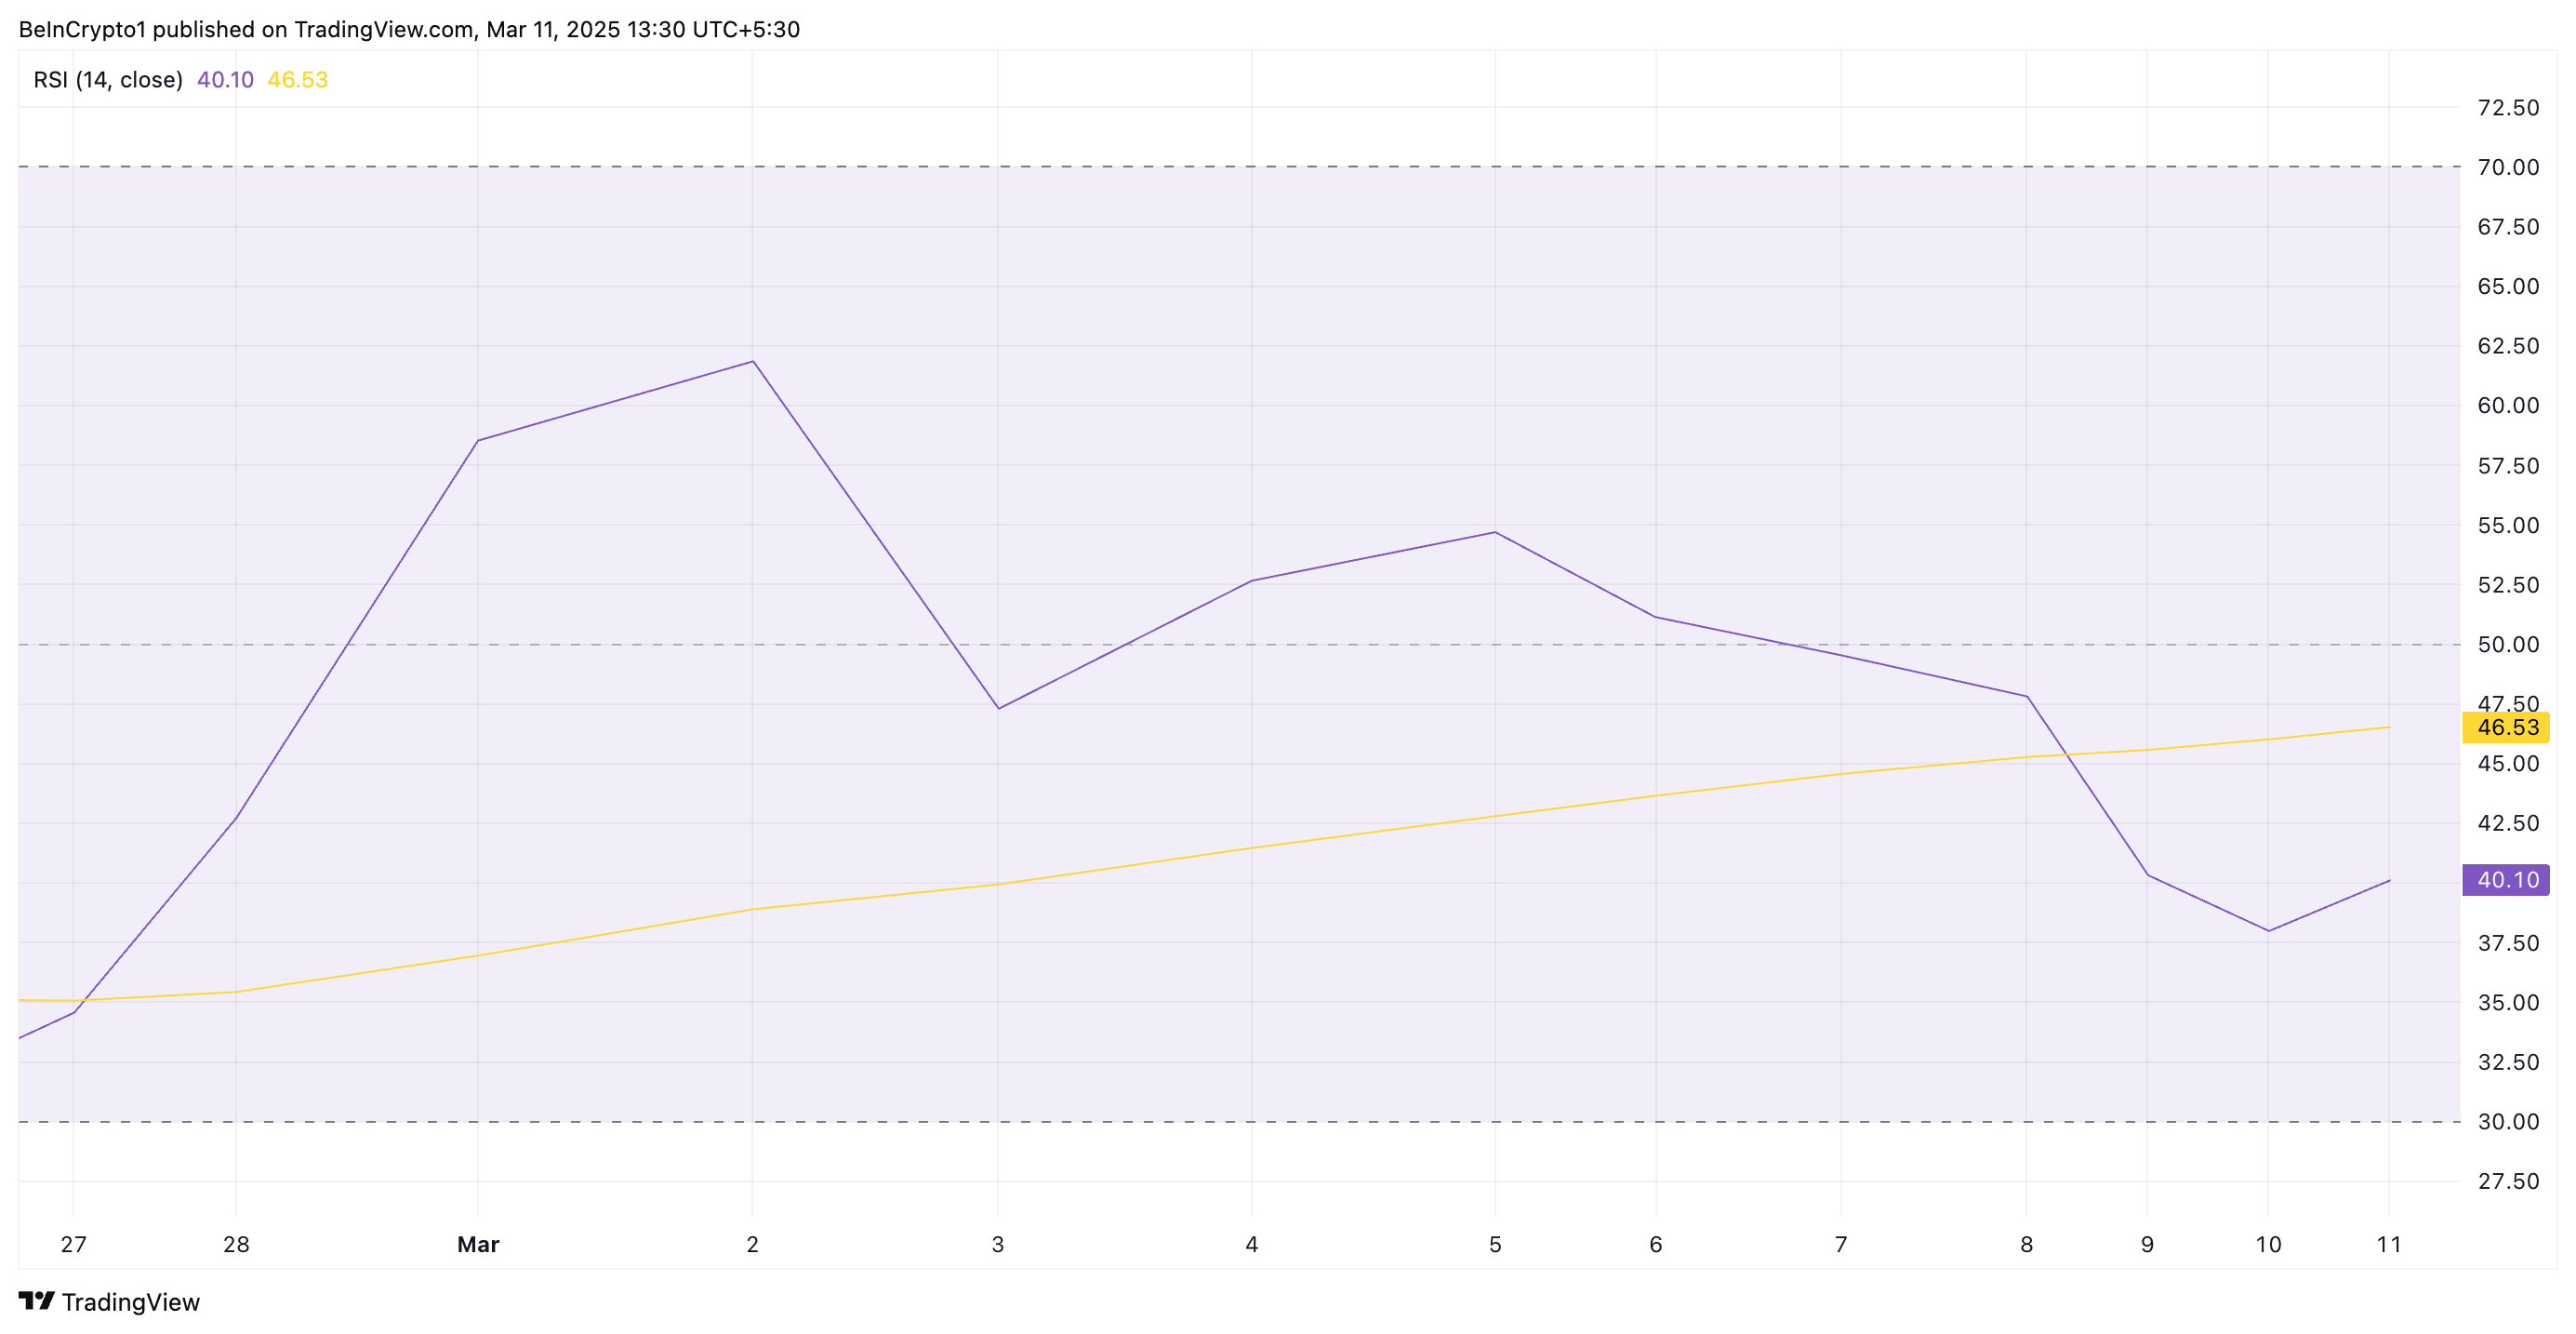 HBAR RSI. Source: TradingView
This RSI reading indicates that bearish momentum is growing. An RSI below 50 generally signals that selling pressure outweighs buying interest, and a continued decline suggests weakening market confidence. If the HBAR’s RSI approaches 30, it could indicate oversold conditions, hinting at a reversal or further downside risk.
HBAR’s Fate Hinges on Support at $0.16
A sustained spike in selling pressure in the HBAR spot markets would cause it to extend its price decline in the short term. In this case, its price could plummet to a three-month low of $0.19.
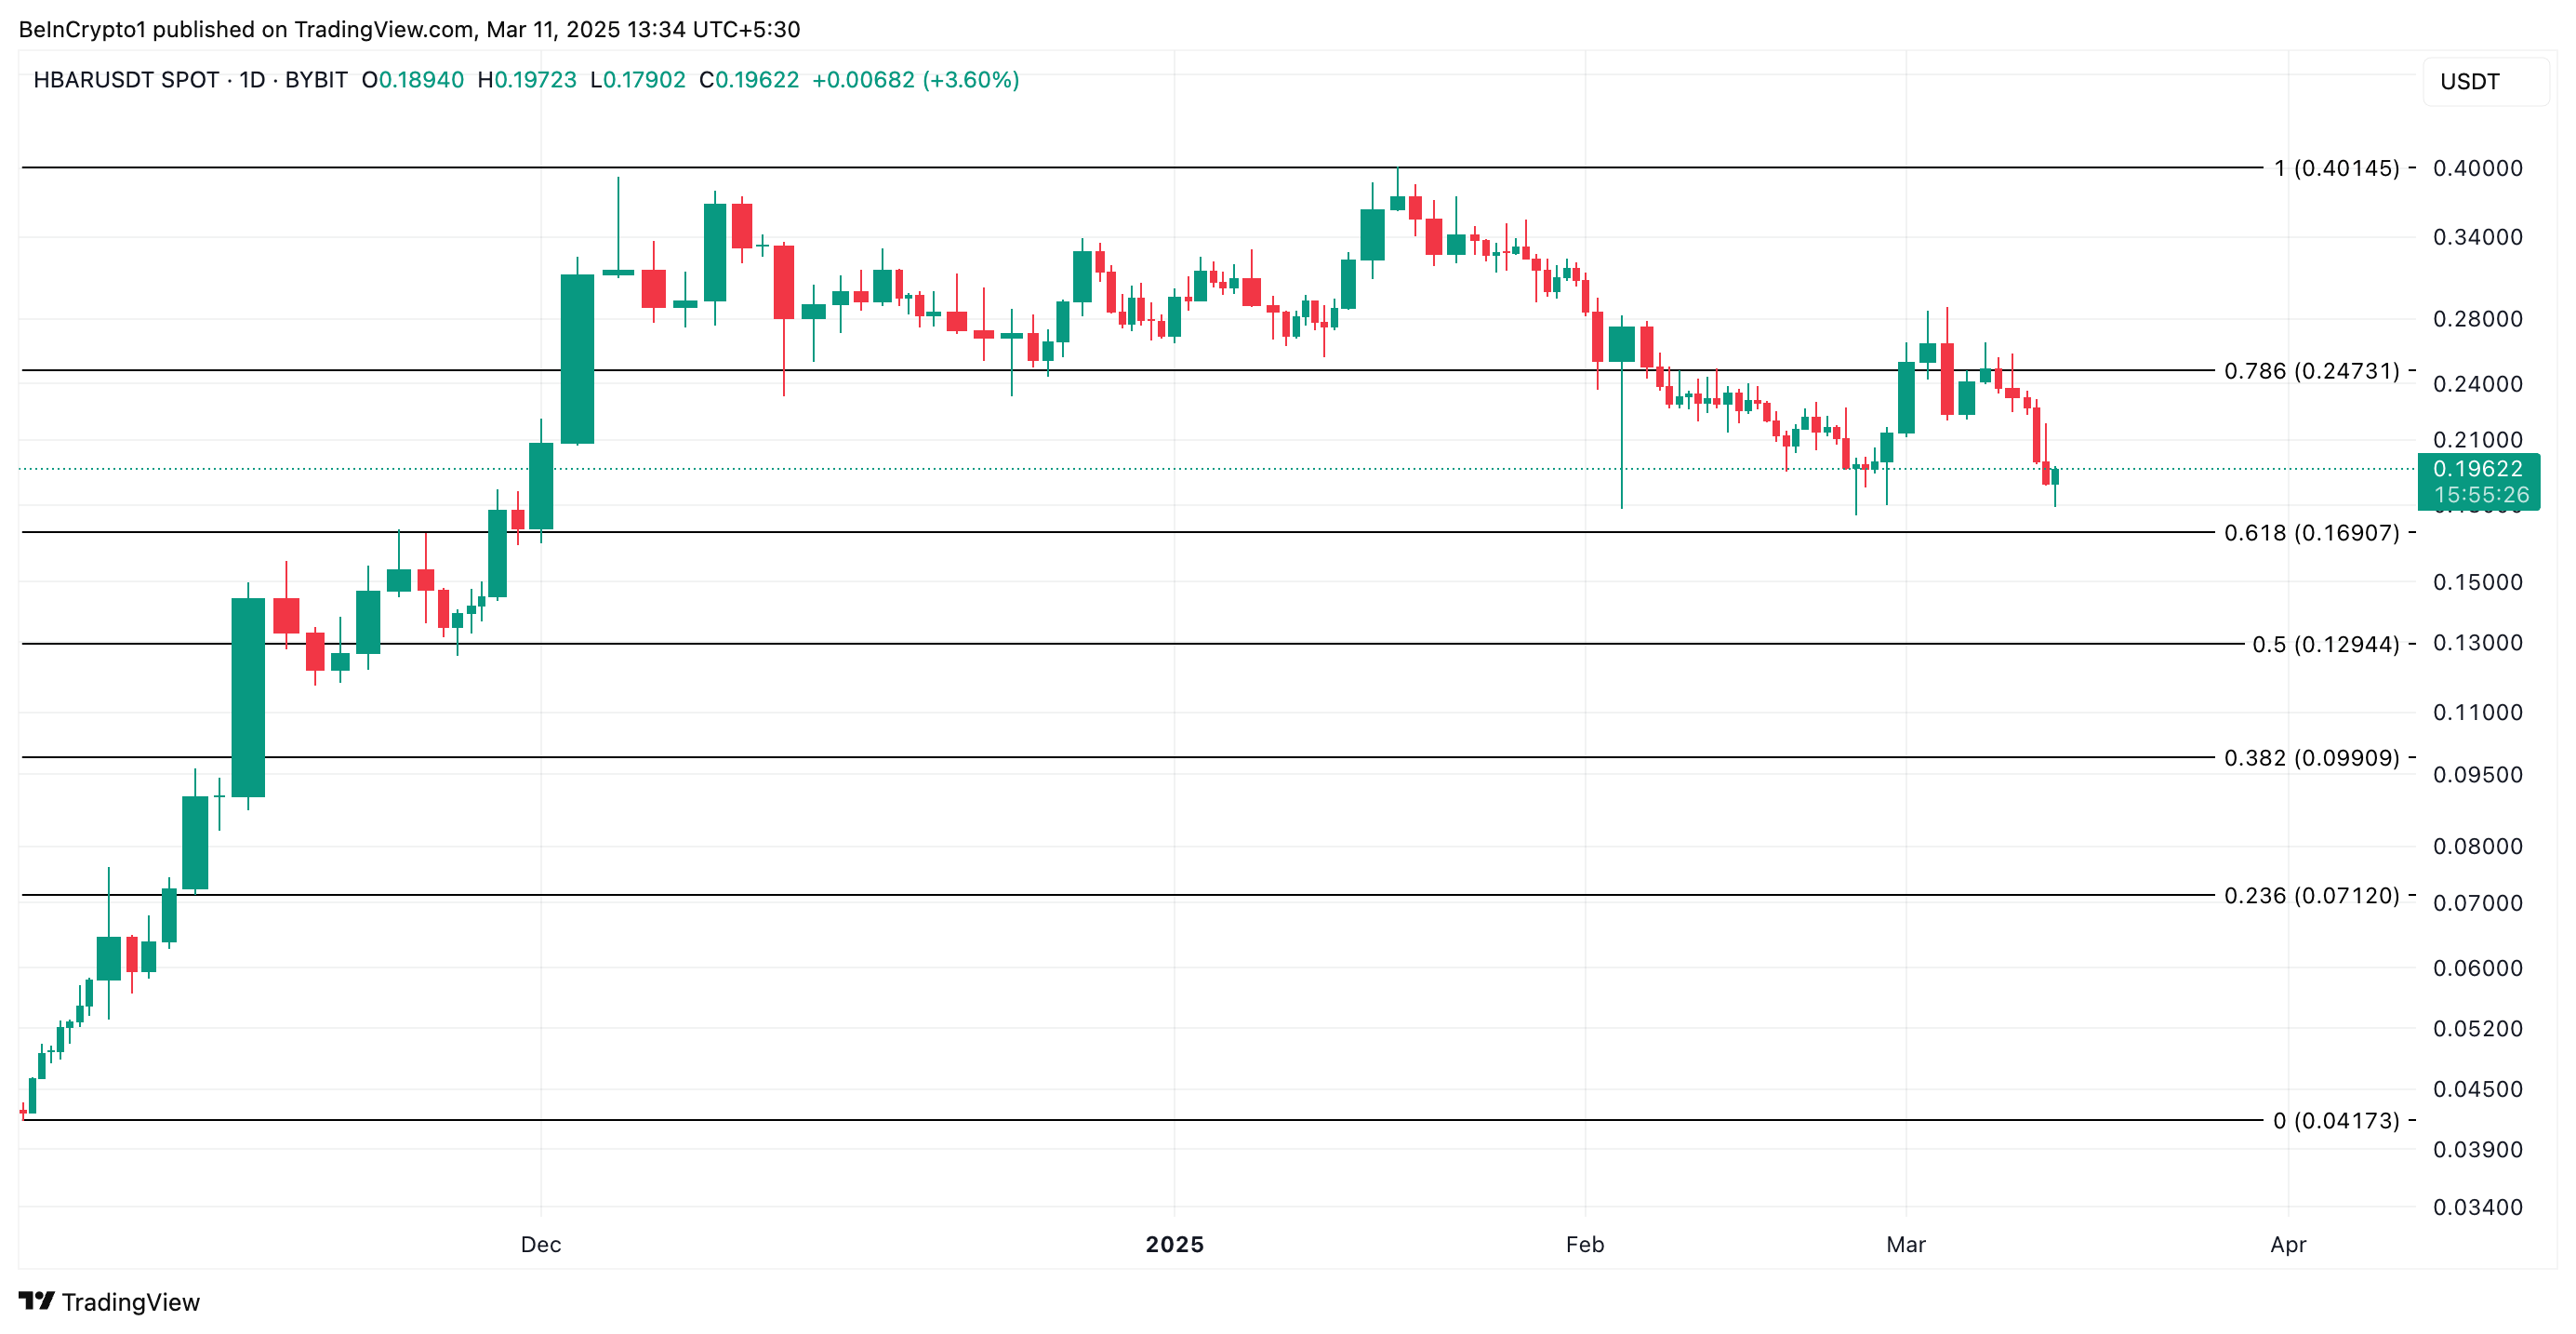 HBAR Price Analysis. Source: TradingView
If the support level fails to hold, the price drop could strengthen and aim for $0.12. Conversely, this bearish projection would be invalidated if new demand enters the HBAR market. In that scenario, HBAR could climb to $0.24.
1
0


 Manage all your crypto, NFT and DeFi from one place
Securely connect the portfolio you’re using to start.

0
0

0
0


0
0