Why Is the Crypto Market Up Today?

0
1


The Bitcoin (BTC) price and the Crypto Market Cap (TOTALCAP) increased this week. BitTorrent (BTT) broke out from a descending resistance trend line.
In the news today:
- A New Jersey cryptocurrency bill suggests categorizing virtual currencies targeted at institutional investors as securities.
- On December 15, Do Kwon, the disgraced founder of Terraform Labs, has filed an appeal opposing his extradition from Montenegro.
TOTALCAP Reaches Resistance
TOTALCAP has increased swiftly since the start of October. The rate of increase accelerated once the price broke out from the $1.25 trillion horizontal resistance area. Until now, TOTALCAP has created eight successive bullish weekly candlesticks.
TOTALCAP has reached a confluence of resistance levels at $1.60 trillion. The 0.382 Fib retracement resistance level and a horizontal resistance area create this resistance.
Market traders use the RSI as a momentum indicator to identify overbought or oversold conditions and to decide whether to accumulate or sell an asset.
Readings above 50 and an upward trend indicate that bulls still have an advantage, whereas readings below 50 suggest the opposite.
The weekly RSI is above 50 and increasing despite being in overbought territory. The previous time the RSI crossed into overbought territory led to a significant upward movement toward the all-time high.
If TOTALCAP breaks out, it can increase by another 20% and reach the 0.5 Fib retracement resistance at $1.87 trillion.
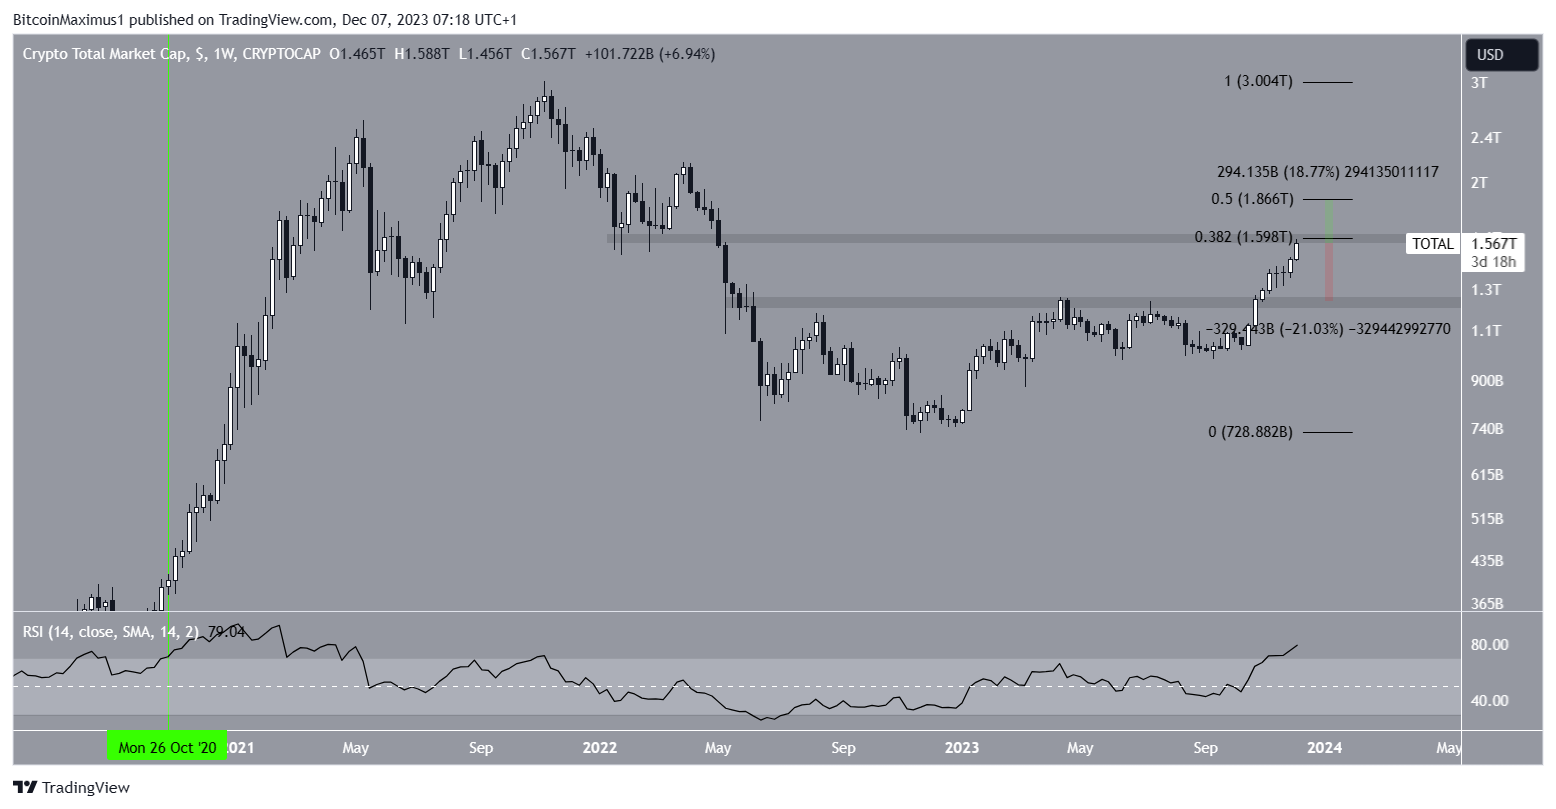 TOTALCAP Weekly Chart. Source: TradingView
Even though the prediction is bullish, a rejection at the $1.60 trillion resistance can lead to a 20% drop to the $1.25 trillion support.
Read More: 9 Best AI Crypto Trading Bots to Maximize Your Profits
Can Bitcoin Sustain Increase?
The BTC price had consolidated near the $38,000 level since November 9. After several failed attempts at breaking out, the price finally succeeded last week. The ensuing rapid decrease led to a new yearly high of $44,490 on December 5.
Bitcoin is further along in its increase compared to TOTALCAP since the price has already reached the 0.5 Fib retracement resistance level at $42,450 and moved above it. This is also a horizontal resistance area. However, BTC has yet to close above this resistance.
The weekly RSI is increasing and is above 50, both signs of a bullish trend.
If the BTC price can sustain itself above $42,450, it could potentially increase by another 11% and reach the next resistance at $48,800. This resistance zone is created by the 0.618 Fib retracement level.
 BTC/USD Weekly Chart. Source: TradingView
Despite this bullish BTC price prediction, failure to close above the $42,450 resistance can lead to a 20% drop to the closest support at $35,000.
Read More: 9 Best Crypto Demo Accounts For Trading
BitTorrent Breaks Out From Resistance
The BitTorrent price broke out from a descending resistance trend line at the start of November. Initially, the price did not start a significant upward movement.
However, this all changed this week when BTT created a large bullish candlestick, reaching a high of $0.0000011. This is the highest price since May 2022.
Despite the increase, BTT failed to break out from the $0.0000010 resistance area. Rather, it created a long upper wick (red icon) and fell.
If BTT breaks out from the $0.0000010 resistance area, it can increase by 150% to the next resistance at $0.0000022.
 BTT/USDT Weekly Chart. Source: TradingView
On the other hand, failure to break out could lead to a retest of the $0.0000006 support area, a decrease of 25%
Read More: Top 9 Telegram Channels for Crypto Signals in 2023
For BeInCrypto‘s latest crypto market analysis, click here.
0
1


 Manage all your crypto, NFT and DeFi from one place
Securely connect the portfolio you’re using to start.


