
Ethereum Price Prediction: ETH Eyes $3,000 After Monthly Buy Signal

0
0

Ethereum is trading close to $1,920 today, and chart watchers think the coin may be building toward its next big move. A fresh set of technical signals has traders talking about $3,000, and even $10,000, as long-term targets.
The buzz started after a monthly chart pattern flashed two buy signals at the same time. That kind of setup has only shown up a few times in Ethereum's history. Each time it did, the price moved sharply higher.
This article breaks down what the data actually shows, what analysts are saying, and what levels matter most for ETH right now.
What is Ethereum's price today?
As of August 9, 2026, Ethereum (ETH) is trading around $1,924, up roughly 0.5% on the day. The coin's market cap sits near $232 billion, with a circulating supply of about 120.68 million ETH.
Trading activity has picked up. Futures volume over the past 24 hours reached $20.84 billion, according to derivatives data, and open interest climbed to $25.76 billion.
Metric | Value |
Price | $1,924.30 |
24h Change | +0.53% |
Market Cap | $232.51B |
Futures Volume (24h) | $20.84B |
Spot Volume (24h) | $813.86M |
Open Interest | $25.76B |
Circulating Supply | 120.68M ETH |
Why are traders talking about a TD Sequential buy signal?
Analyst Ali Charts pointed out that Ethereum's monthly chart flashed two separate buy signals last month: a black 9 and an S13 on the TD Sequential indicator. Traders use this tool to spot exhaustion points, moments where a trend may be about to reverse.
What makes this notable is the track record. Every TD Sequential signal on Ethereum's monthly chart over the past four years has lined up with a real trend shift.
Here is how past signals played out:
Date | Signal | Price Move That Followed |
April 2022 | A13 sell | -75.47% |
September 2022 | Black 9 buy | +236.51% |
April 2025 | A13 buy | +258.21% |
Recent (last month) | Black 9 + S13 buy | Not yet confirmed |
Past performance does not guarantee the same result this time. But the pattern is why some traders are paying closer attention to Ethereum right now.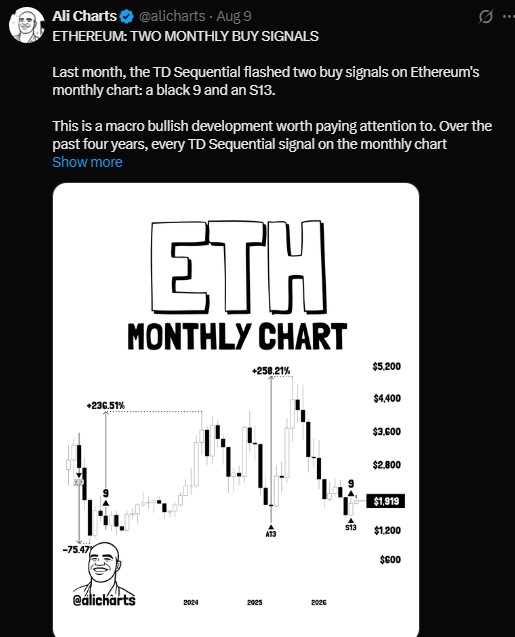
Has Ethereum broken a key on-chain level?
Yes. Ethereum recently pushed above its MVRV 0.8 Pricing Band, a level near $1,800. This is an on-chain measure that compares the market price to the average price paid by holders.
Historically, when ETH clears this band, it tends to grind toward its realized price, which currently sits close to $2,300. That would mark roughly a 20% move from current levels if the pattern holds.
Ethereum has also formed what analysts call an MVRV Momentum golden cross. This is a signal that has appeared before past rallies. Previous instances were followed by gains of 50%, 166%, 74%, and 113%, based on historical data shared by on-chain analysts.
What is the next resistance level for Ethereum?
If ETH keeps climbing, $3,000 is the level most analysts are watching. On-chain transaction data shows heavy activity around that price zone, with more than 10 million ETH having changed hands near $3,000 in the past.
That kind of volume tends to create resistance, since many holders may look to sell once price returns to their entry point. A clean break above $3,000 would be seen as a bullish confirmation by chart traders.
Could Ethereum reach $10,000 in this cycle?
Some traders are floating much bigger targets. Analyst Ted Pillows compared Ethereum's current chart pattern to Netflix stock before its major breakout, pointing to a rounded base and an ascending trendline on the two-week chart.
Ted's post argues that $10,000 Ethereum is possible in the coming bull run if the pattern completes the way it did for Netflix shares. This is a long-term, open-ended view rather than a short-term price target, and it depends on Ethereum breaking well above its prior all-time highs first.
It's worth noting that comparing a stock chart pattern to a crypto asset is a loose analogy, not a guaranteed roadmap. Chart shapes can look similar without leading to the same outcome.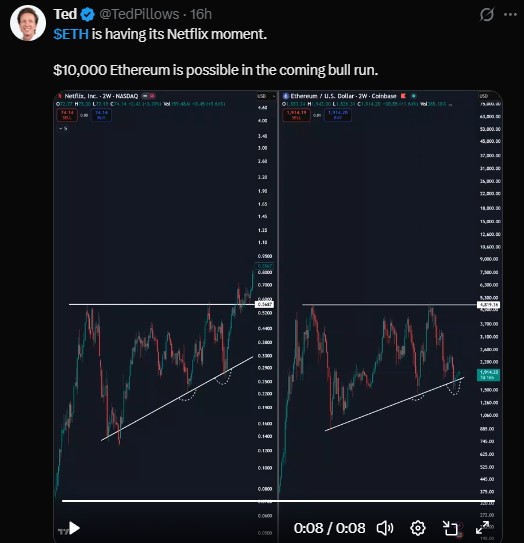
What are the key levels to watch for ETH?
Support: $1,800, tied to the MVRV Pricing Band
Near-term target: $2,300, Ethereum's realized price
Major resistance: $3,000, a heavy on-chain trading zone
Long-term bull case: $10,000, based on chart pattern comparisons
A move below $1,800 would likely weaken the current bullish setup and put the recent buy signals in question.
The bottom line
$ETH is sitting at a technical crossroads. A rare double buy signal, a break above a key on-chain band, and a momentum golden cross have combined to put bulls back in control of the narrative.
None of this guarantees a straight line higher. Crypto markets move fast, and sentiment can shift with little warning. But the setup is one worth watching for anyone tracking Ethereum price prediction as we move deeper into 2026.
Disclaimer
This article is for informational purposes only and does not constitute financial, investment, or trading advice. Past performance of any technical indicator or price pattern does not guarantee future results. Always do your own research and consult a licensed financial advisor before making investment decisions.
0
0

 Manage all your crypto, NFT and DeFi from one place
Securely connect the portfolio you’re using to start.


