SEC’s ETF Delay Triggers $16 Million Exodus from Solana Spot Markets

0
0


On Tuesday, the US Securities and Exchange Commission (SEC) postponed its decision on multiple altcoin exchange-traded funds (ETFs), including Solana’s.
This development has further dampened investor sentiment toward SOL, which has continued to witness significant spot market outflows.
Solana Investors Exit Amid SEC Delay—$16 Million Pulled Under 24 Hours
In a series of filings made on March 11, the SEC announced its plans to postpone its decision on multiple ETFs tied to major assets, one of which is SOL. According to the regulator, it has “designated a longer period” to review the proposed rule changes that would enable the ETFs to become operational.
This has exacerbated the bearish sentiment toward SOL, which is reflected in the capital outflows from its spot markets over the past 24 hours. As of this writing, $16.43 million has been removed from the market, marking the seventh day of consecutive outflows, which have now exceeded $250 million.
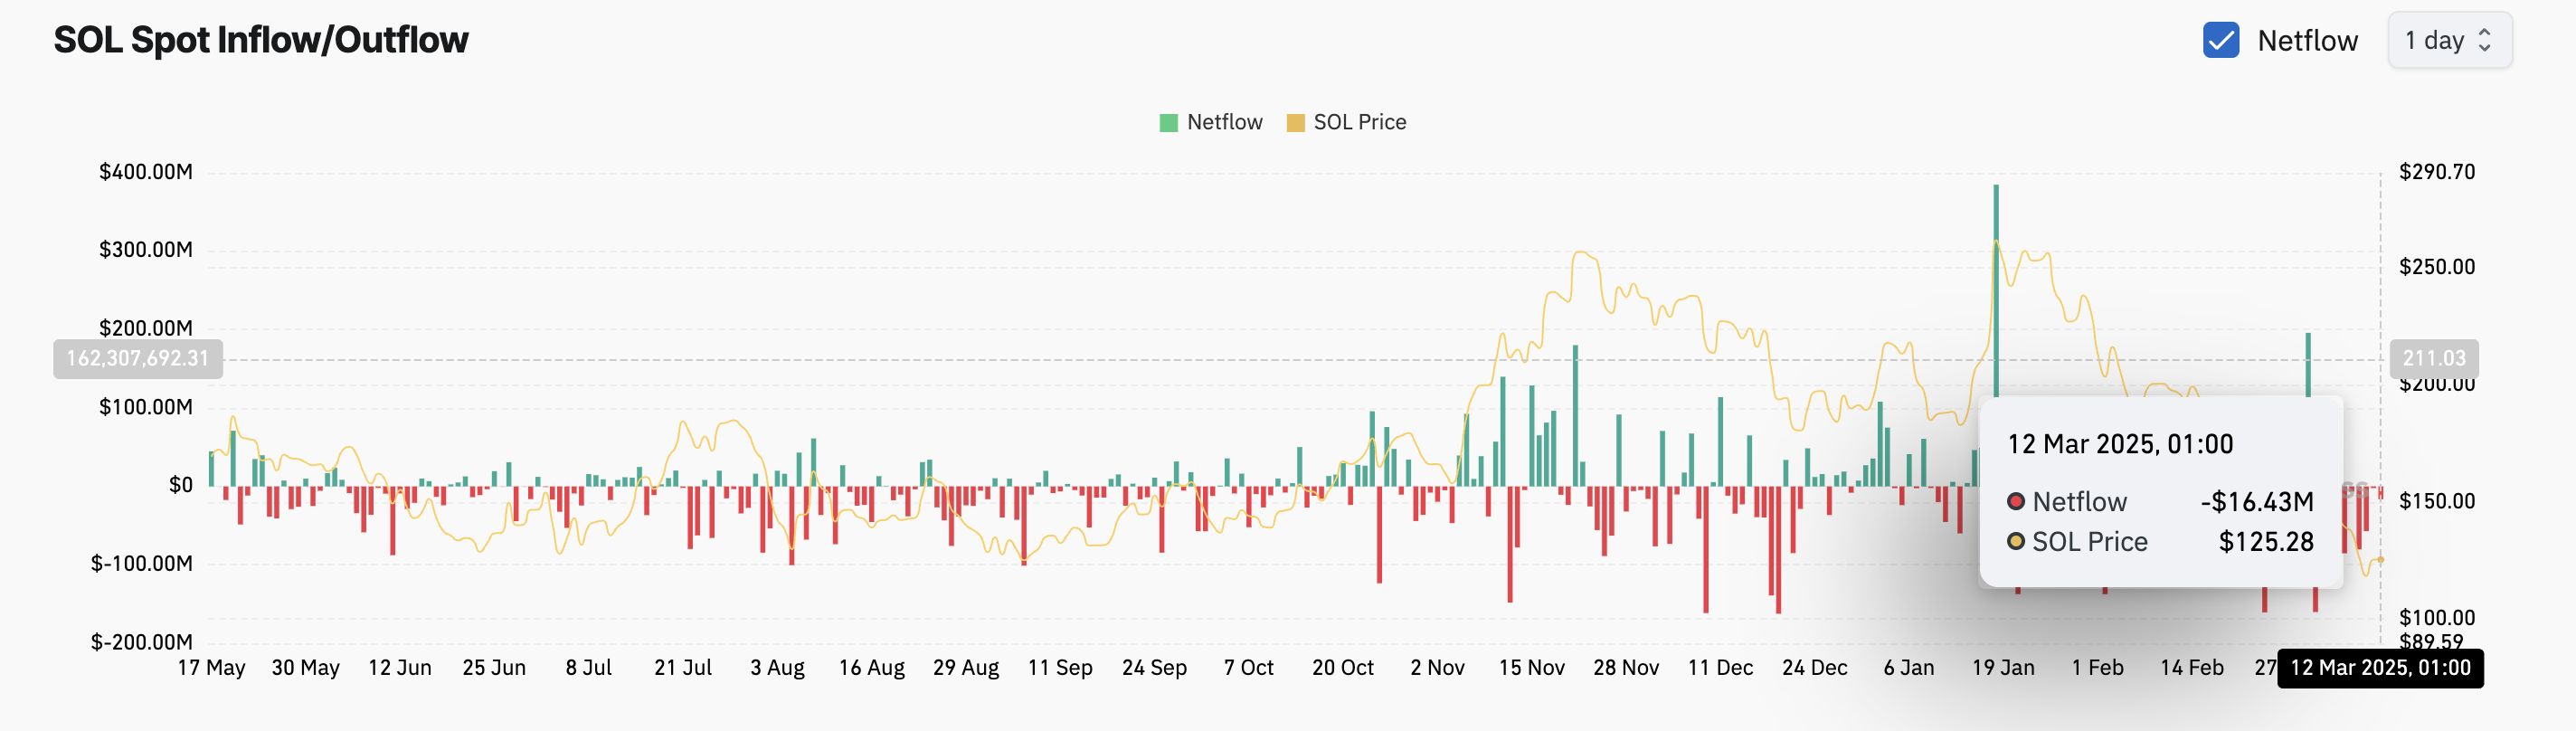 SOL Spot Inflow/Outflow. Source: Coinglass
When an asset experiences spot outflows like this, its investors are selling their holdings. This trend reflects a lack of confidence in SOL’s short-term price recovery, with traders choosing to cash in their accrued gains to prevent further losses on investments.
Furthermore, SOL’s Moving Average Convergence Divergence (MACD) indicator, observed on a daily chart, supports this bearish outlook. As of this writing, the coin’s MACD line (blue) is below its signal line (orange).
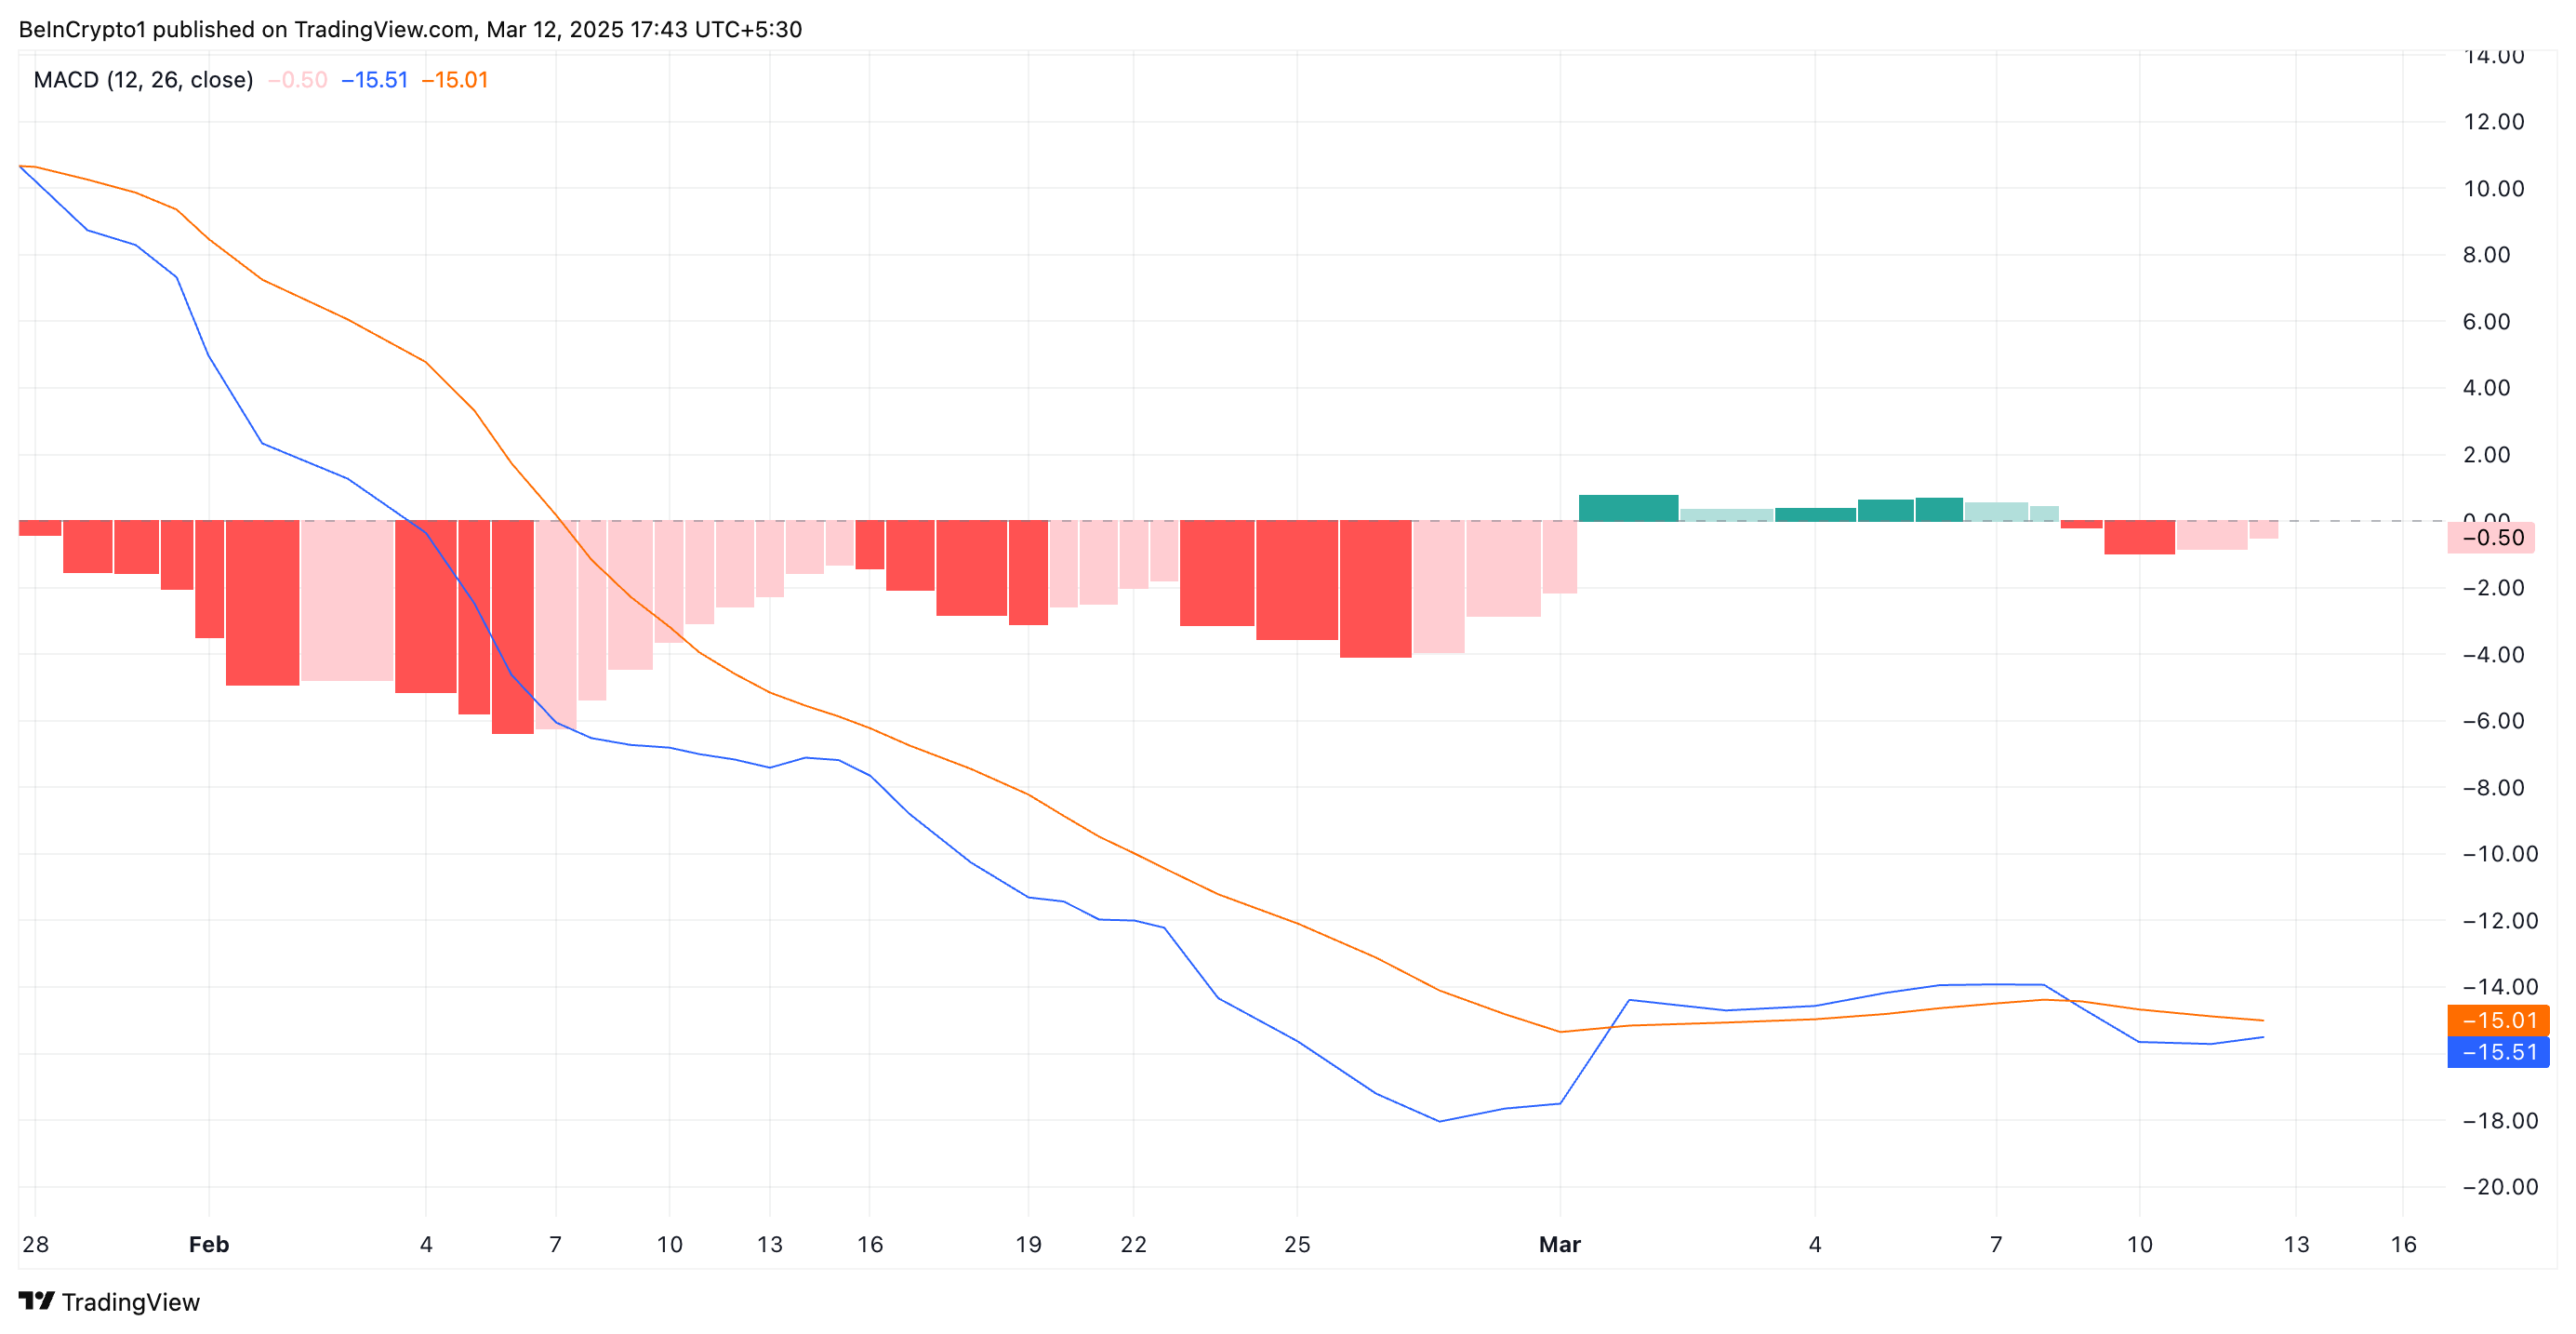 SOL MACD. Source: TradingView
An asset’s MACD measures its price trends and momentum shifts and identifies potential buy or sell signals based on the crossing of the MACD line, signal line, and changes in the histogram.
When the MACD line rests under the signal line, the market is in a bearish trend. This indicates that SOL selloffs exceed buying activity among market participants, hinting at a further value drop.
Solana at Crossroads: Will SOL Hold $126 or Fall to $110?
SOL trades at $126.82 at press time. With waning buying pressure, it risks falling to $110, a low that it last reached in August 2024.
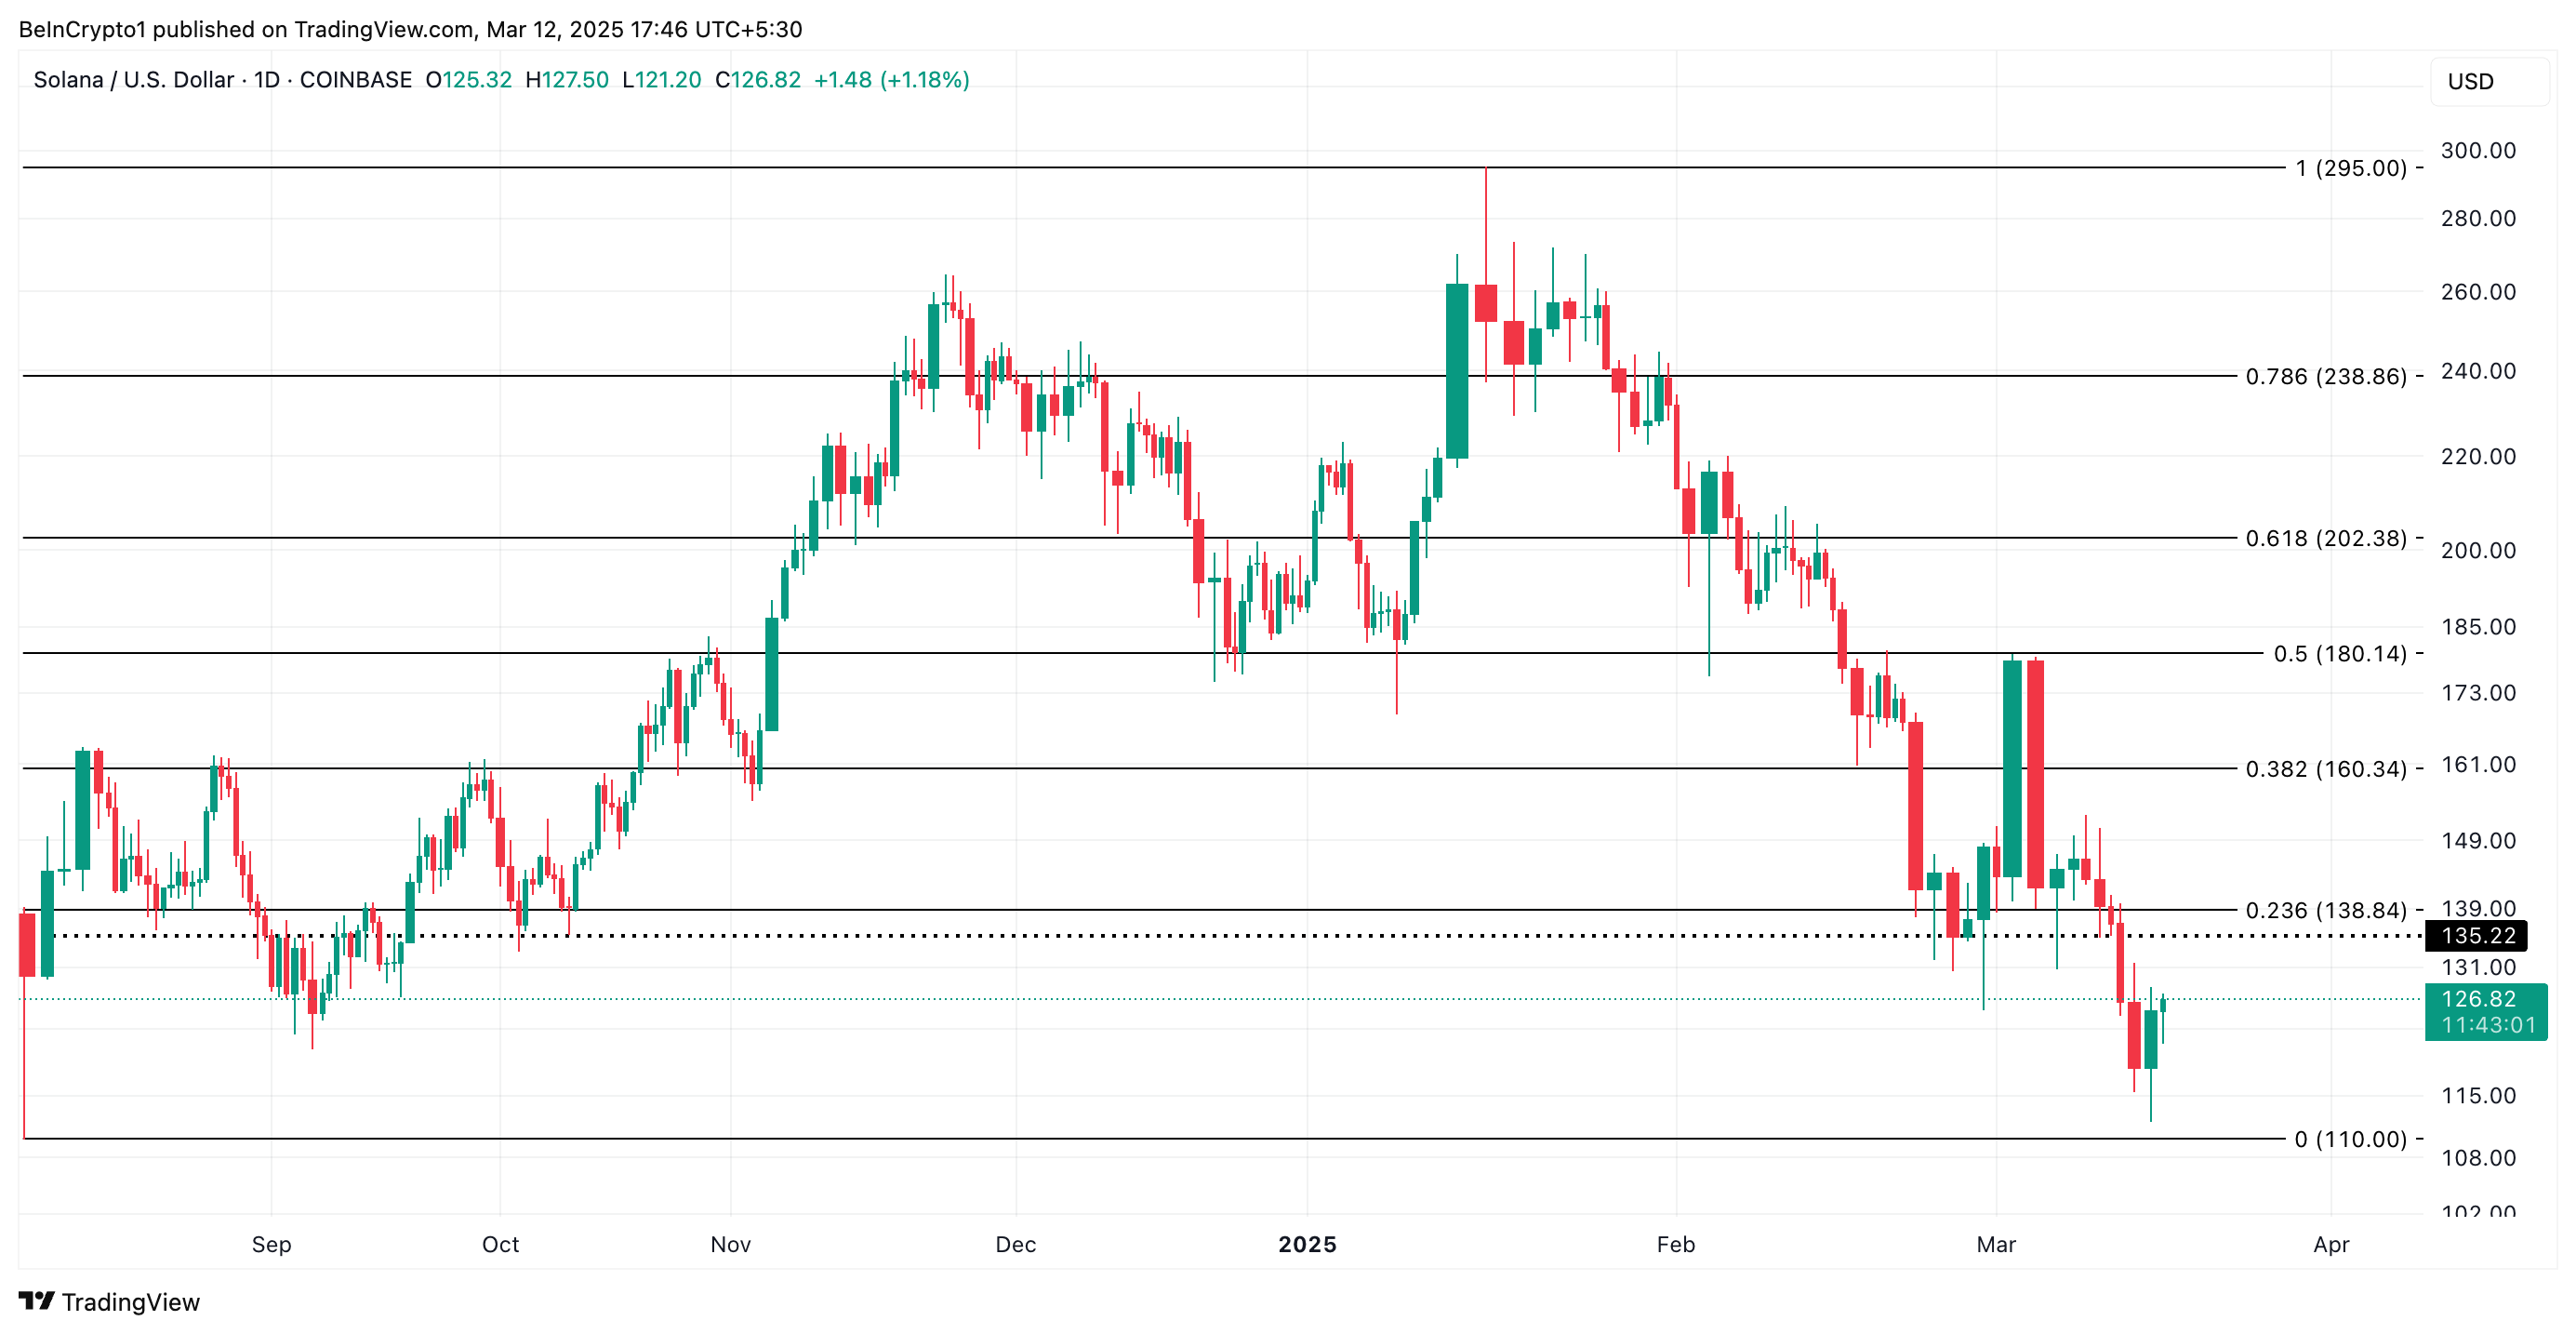 SOL Price Analysis. Source: TradingView
However, a strong resurgence in buying activity would prevent this. For this to happen, SOL has to establish a strong support flow at $135.22. If successful, it could propel its price to trade at $138.84 and above.
0
0


 Manage all your crypto, NFT and DeFi from one place
Securely connect the portfolio you’re using to start.


