MemeCore (M) Buyers Refuse to Rest; Can They Push the Price Another 50%?

0
0

MemeCore has turned into one of the fastest-moving coins in the market. At press time, the token trades near $1.68 after a 40% jump in the past 24 hours. On a seven-day view, gains stand at almost 276%, with the coin printing fresh all-time highs almost daily. Traders now ask if the move still has fuel.
Early signals suggest the rally may extend, and any dips could be seen as pullbacks rather than reversals.
Two Metrics Confirm Buyer Aggression
Volume and money flow readings back up the rally. On-Balance Volume (OBV), which tracks whether buying or selling dominates daily volume, has been pushing higher alongside the price. This shows that recent trading activity is heavily weighted toward buying, confirming strong retail participation.
Want more token insights like this? Sign up for Editor Harsh Notariya’s Daily Crypto Newsletter here.
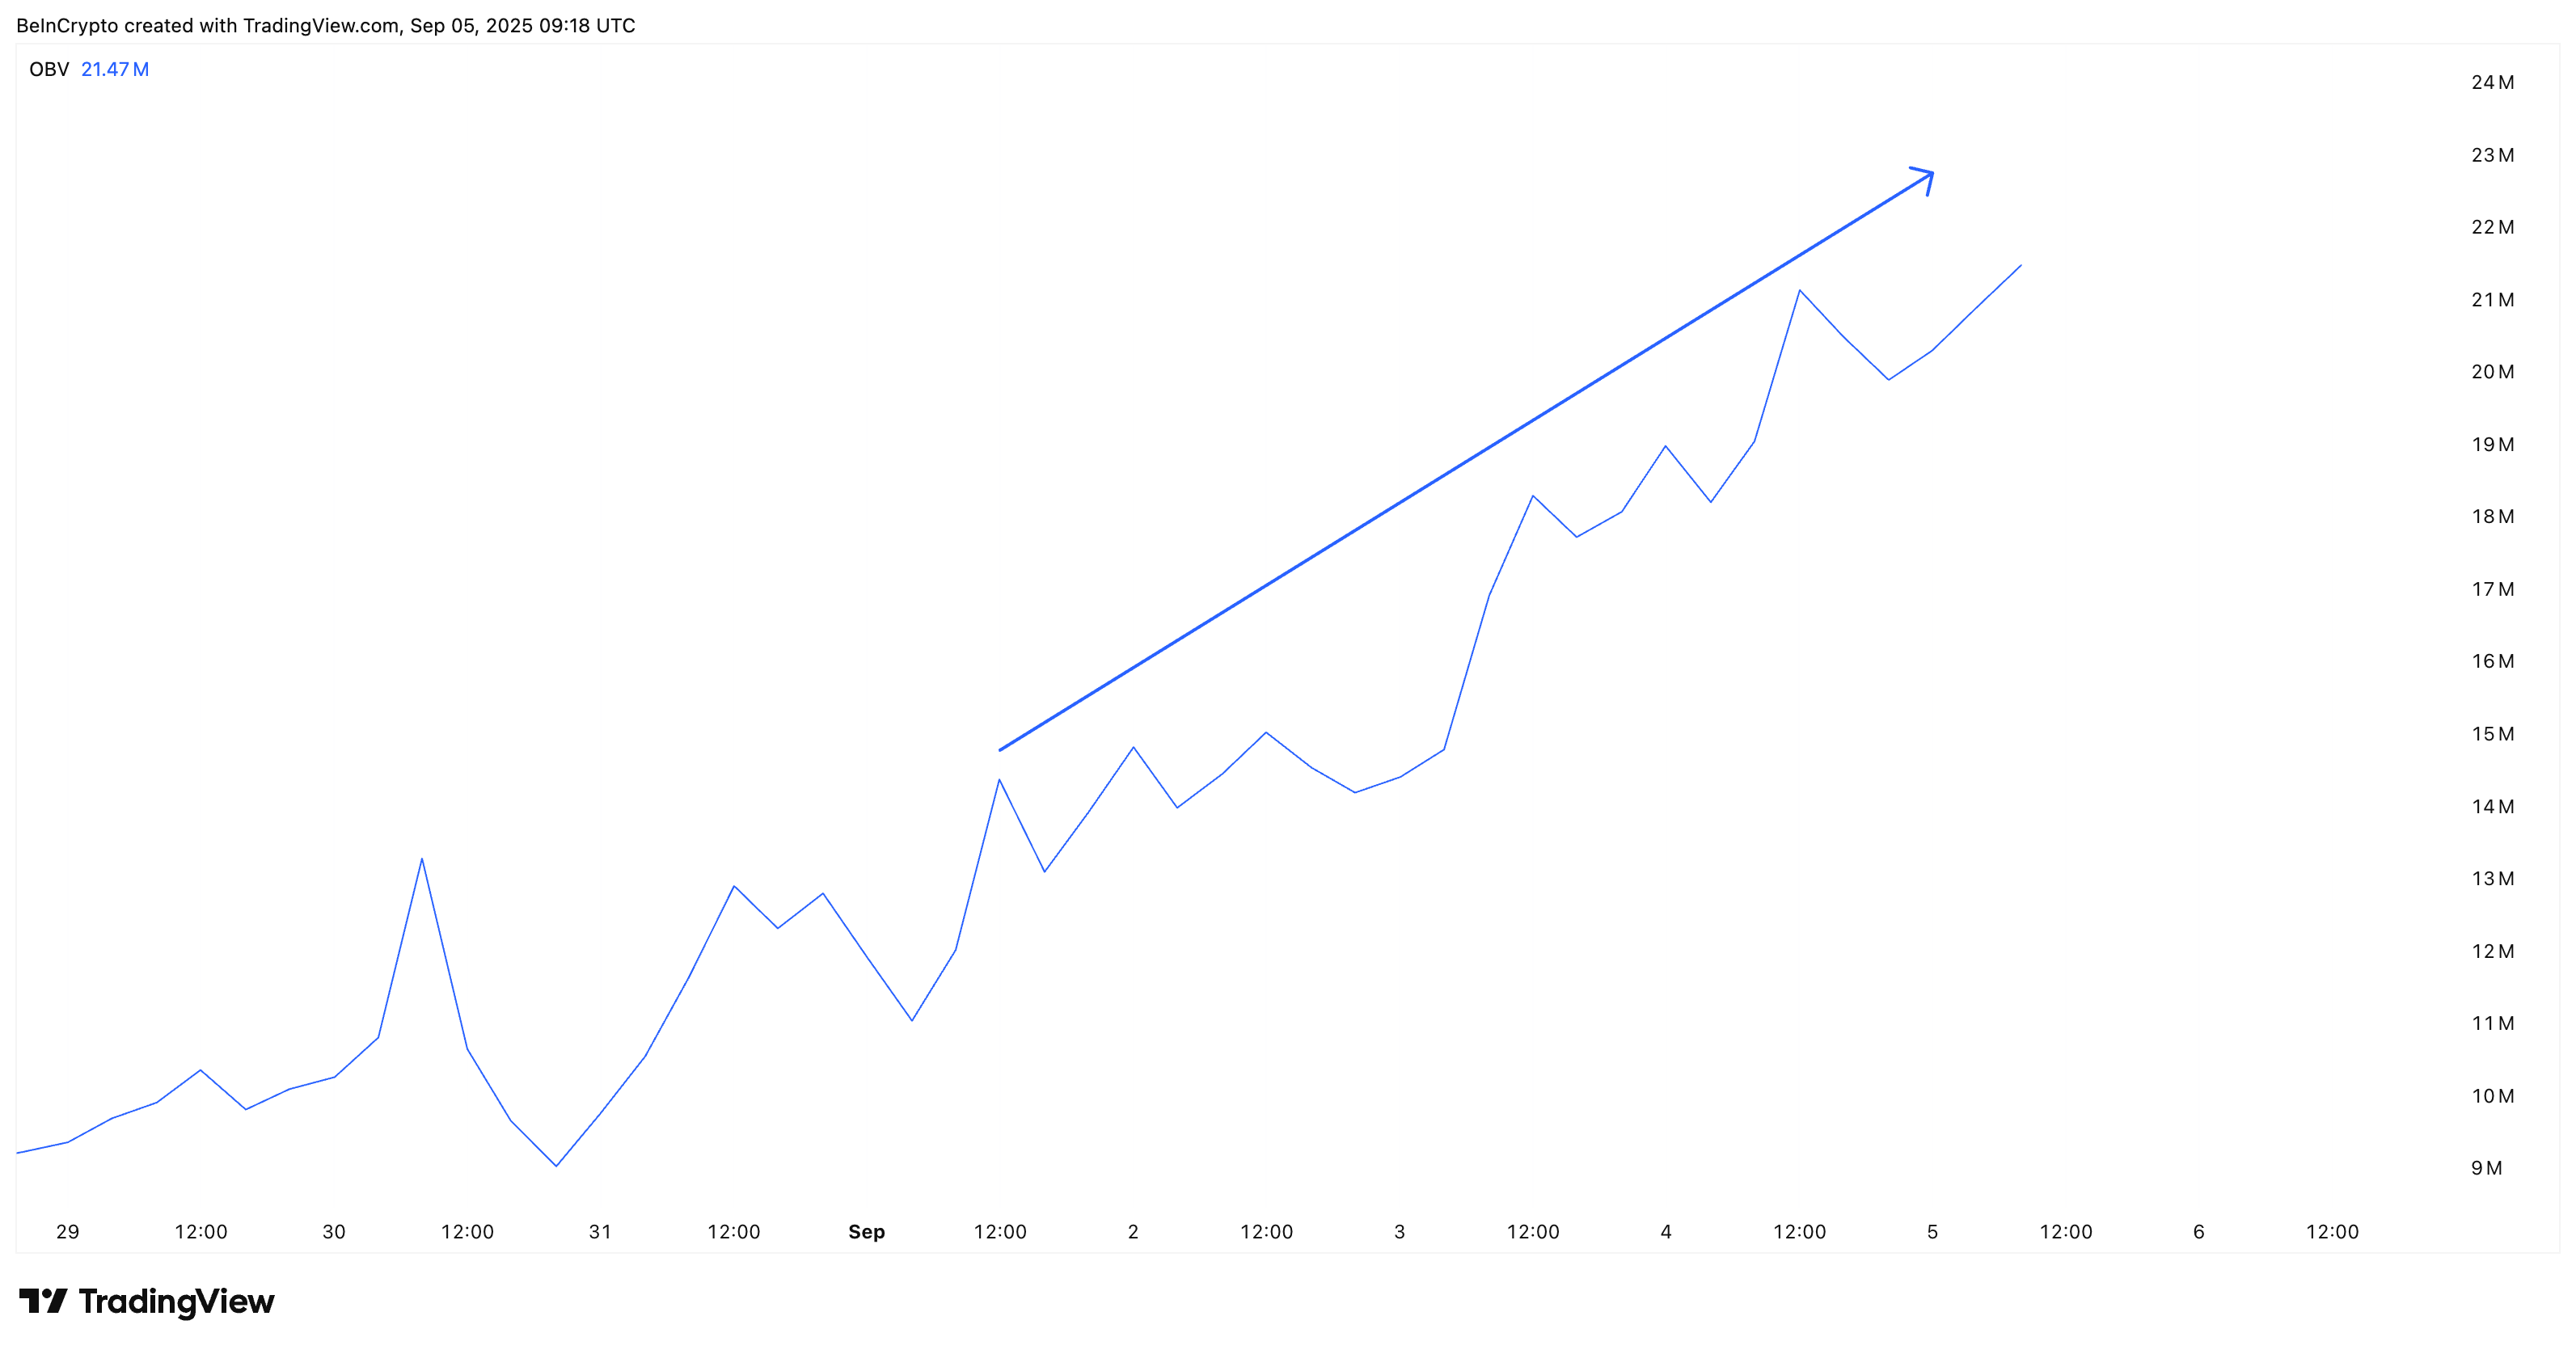 Buyers In Control Of MemeCore Price: TradingView
The Money Flow Index (MFI), which combines price and volume to show whether money is flowing in or out, is also flashing strength. On the 4-hour chart, MFI has pushed above 80 and is making higher highs alongside price.
When the MFI rises while the price dips or consolidates, it means buyers are stepping in on those dips. Instead of letting the price fall further, traders absorb the selling pressure. This behavior is often called “dip buying” and explains why the MemeCore (M) price has been able to cross over multiple target levels with ease.
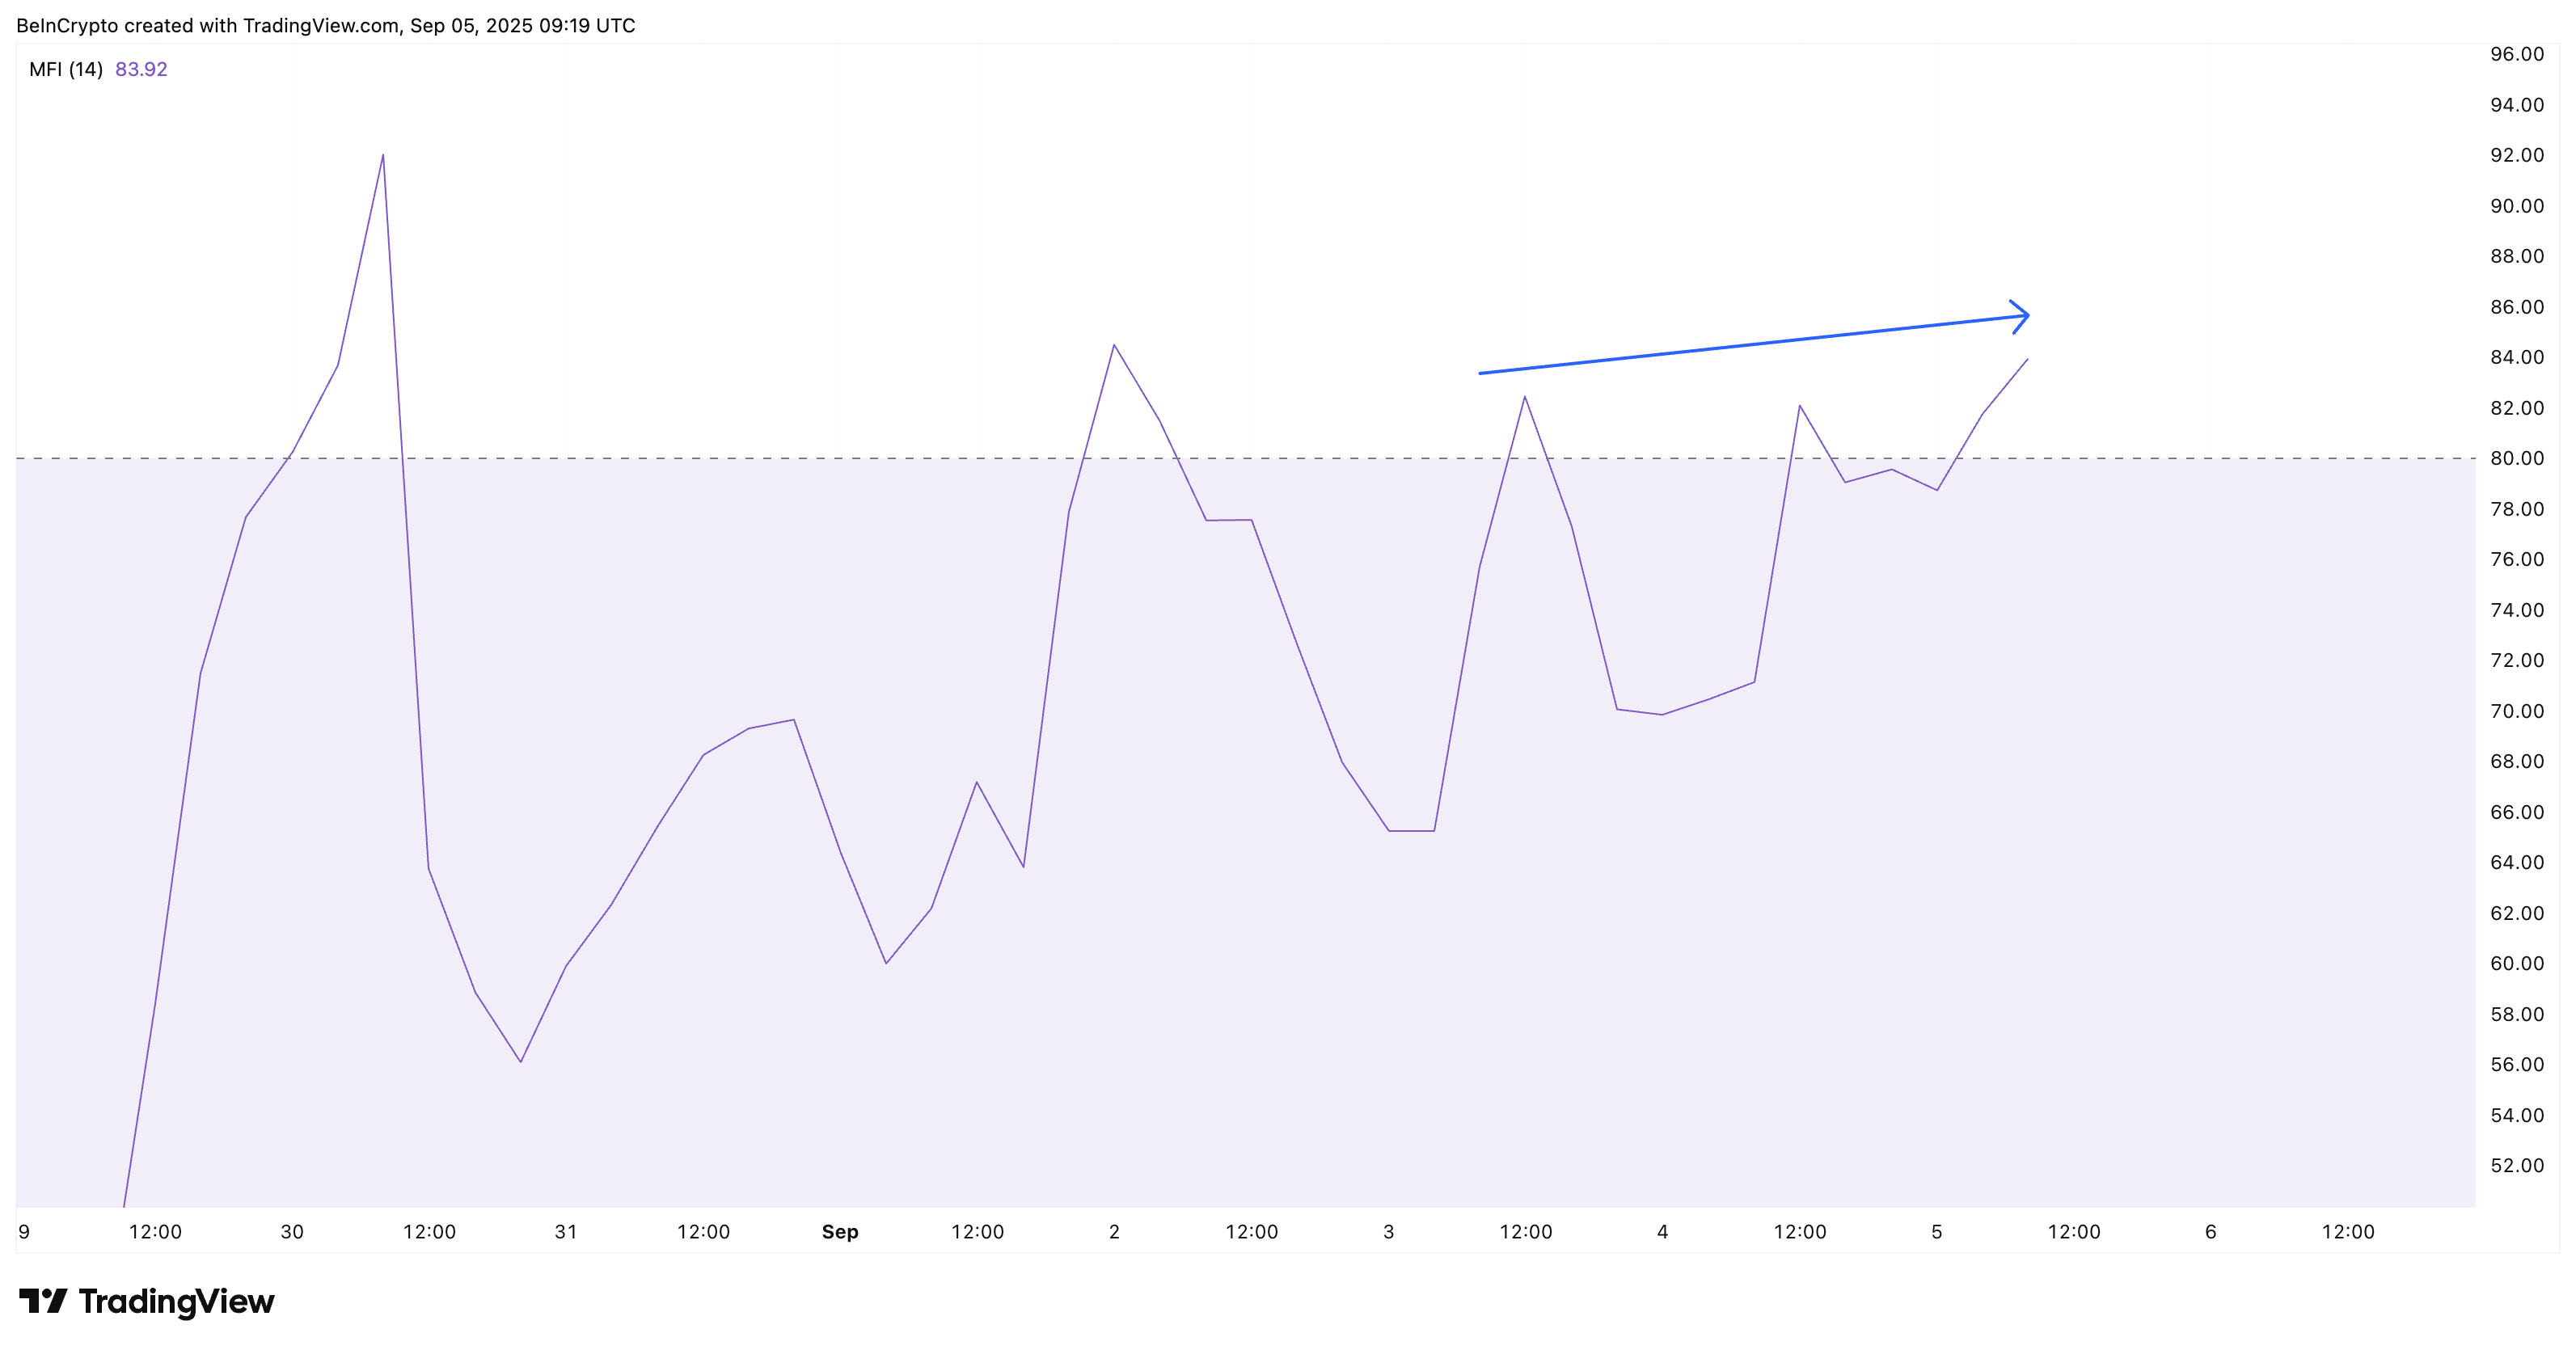 MemeCore Dips Are Being Bought: TradingView
MFI above 80 often signals overheating, but here it rises with the MemeCore (M) price, which usually means buying remains strong. As long as MFI stays strong (with expected minor pullbacks along the way), it suggests sustained pressure from bulls, giving more fuel to the rally.
Together, OBV and MFI confirm that MemeCore’s buyers are still aggressive. The pattern suggests retail buyers are driving much of the order flow, and they are even buying any dips available, at least for now.
MemeCore Price Levels Show Path to 50% Upside
The technical setup looks bullish on the 4-hour chart. We use this timeframe because it captures short-term moves and pullbacks that a daily chart might miss. It helps show where buying support is appearing and where small corrections could build into bigger ones.
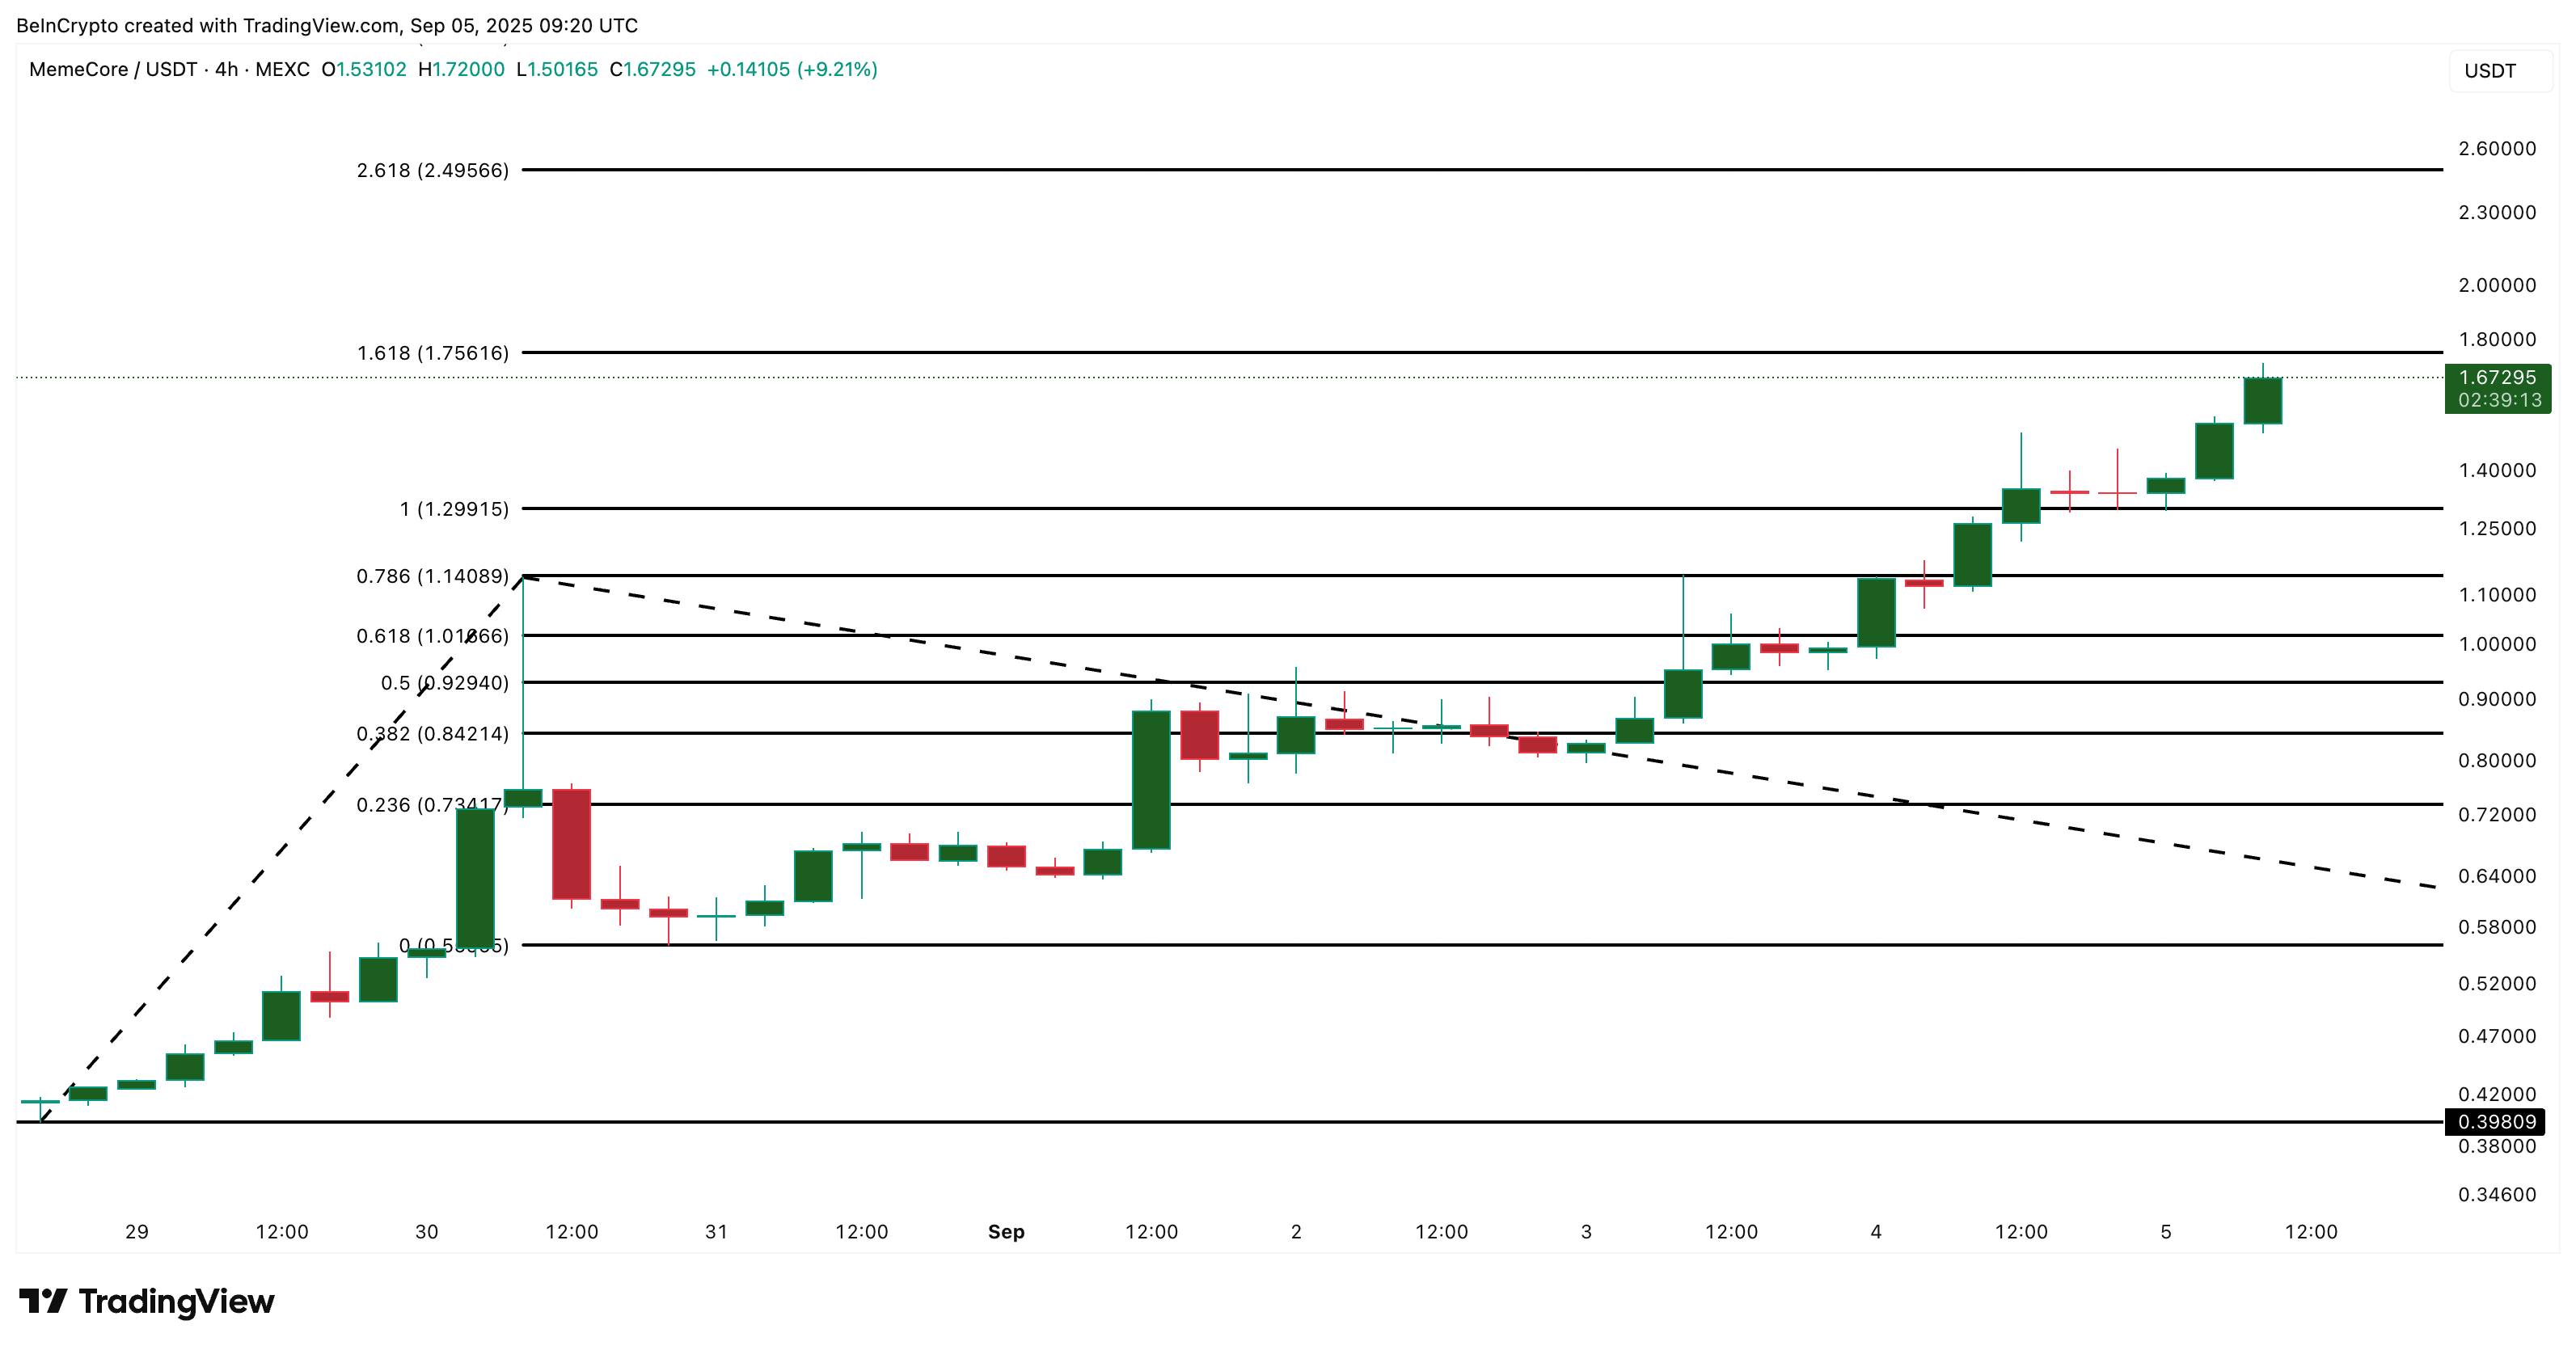 MemeCore Price Analysis: TradingView
At press time, MemeCore trades at $1.67. The first major resistance is $1.75 based on the MemeCore price discovery targets.
From there, the next projected target stands at $2.49. A move from current prices to that level would add almost 50%. On the downside, invalidation comes if MemeCore breaks below $1.14, the top of its last impulse wave.
So far, MemeCore’s buyers refuse to rest. With OBV and MFI confirming strong demand and price action pointing higher, the setup remains bullish. A break above $1.75 could open the door to $2.49, extending the rally by another 50%.
0
0


 Manage all your crypto, NFT and DeFi from one place
Securely connect the portfolio you’re using to start.


0
0


0
0