
Why BONK Is Down 4.4% Today: Bonk Price Prediction

0
0

Bonk price prediction has a straightforward answer for today's red candle, because the chart shows exactly where things broke down.
Bonk built its reputation as one of Solana's breakout meme tokens, and it still pulls in some of the heaviest retail trading volume among smaller-cap meme coins.
$BONK is currently trading at $0.000003137, down 4.4% on the day, after breaking below the lower boundary of the ascending channel it had been climbing inside on the hourly chart.
Bonk Live Market Data
| Metric | Value |
| Price | $0.000003137 |
| 24h Change | -4.4% |
| 24h Range | $0.000003059 - $0.000003657 |
| Market Cap | $276.144M |
| Fully Diluted Valuation | $276.144M |
| 24h Trading Volume | $140.626M |
| Total Value Locked | $11.133M |
| Circulating Supply | 87.995T |
| Total Supply | 87.995T |
| Max Supply | 87.995T |
Source: BONK market data as of Sep 07, 2026. Figures may vary slightly across other tracking websites.
Exchange Volume
OKX is carrying the largest share of $BONK volume at $15.72M, well ahead of the rest of the field.
Bitunix ($4.99M) and Gate ($3.72M) follow next, with LBank ($3.28M) and WhiteBIT ($890.92K) rounding out the more active venues.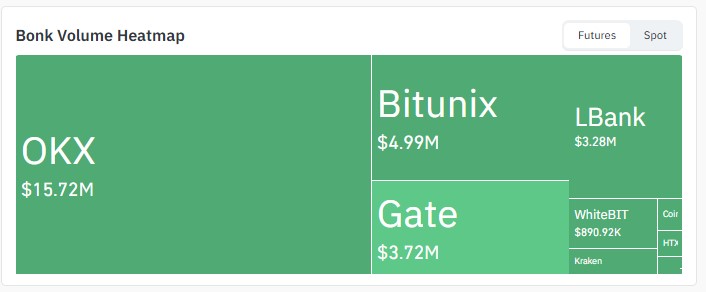
Source: Volume heatmap data taken from CoinGlass , as of Sep 07, 2026.
Liquidation Data
| Timeframe | Total Liquidated | Longs | Shorts |
| 1h | $2.85K | $0 | $2.85K |
| 4h | $3.79K | $813.79 | $2.98K |
| 12h | $52.86K | $44.11K | $8.75K |
| 24h | $104.82K | $58.46K | $46.35K |
Source: Liquidation data taken from CoinGlass , as of Sep 07, 2026.
Longs have taken the bigger hit over the past 12 and 24 hours, which fits a chart where price broke down from a rising channel and caught buyers still positioned for continuation.
The 1-hour window flips that pattern, with only shorts liquidated, a small sign that the immediate slide may be losing some steam.
Bonk Coin News
Trading activity around $BONK has been drawing attention today for a different reason. A crypto-focused account flagged that $BONK's 24-hour trading volume had crossed $104M, calling out the surge directly.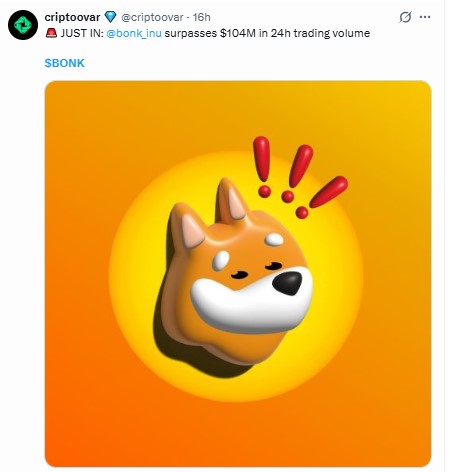
Source: Data Taken From @criptoovar , X Account.
That volume spike lines up with today's breakdown, since sharp moves in either direction tend to pull in heavier trading than usual.
It's worth treating as a volume signal rather than a bullish or bearish claim on its own.
Bonk Price Prediction Outlook: Technical Analysis
The 1-hour $BONK/USDT chart on Binance shows the price breaking down out of an ascending channel it had been climbing inside for several days.
That breakdown also left behind a fair value gap, a pocket of price the market moved through too quickly to fully trade, and $BONK now looks to be working its way back toward filling it.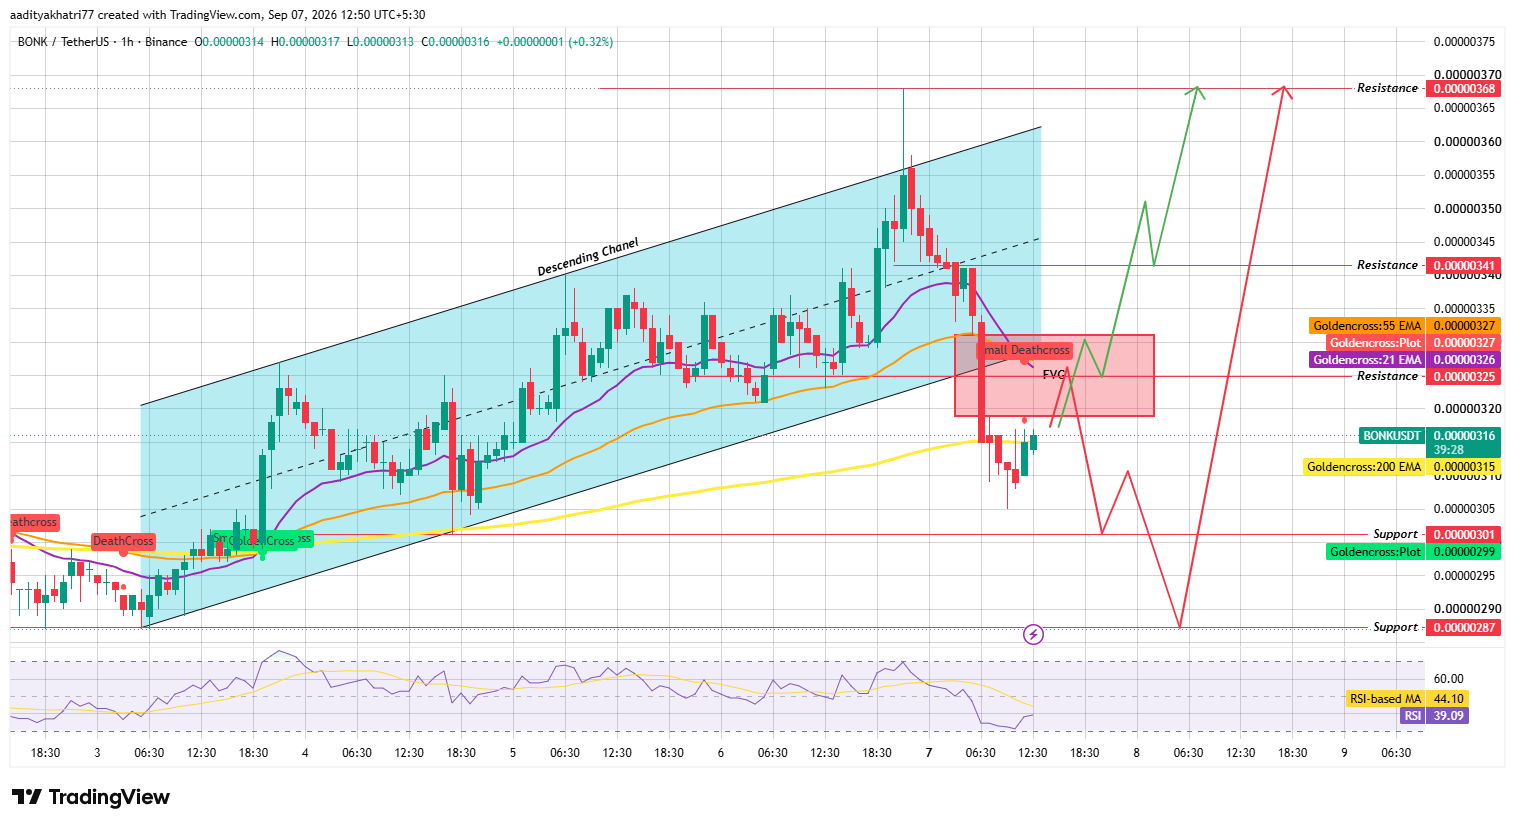
Source: Chart taken from TradingView , Binance BONK/USDT pair, as of Sep 07, 2026, 12:50 UTC+5:30.
Can BONK Bounce After Filling the Gap?
If BONK fills the fair value gap and finds buyers there, a push back toward the $0.00000325 resistance zone becomes the first test.
Clear that on a confirmed close with volume behind it, and $0.00000341 comes into range, with $0.00000368 as the extended target if the recovery holds.
What Happens If BONK Gets Rejected at Resistance?
If price fails once it reaches resistance instead, a slide back toward $0.00000301 becomes the more likely path.
Break below that level on a confirmed close, and $0.00000287 is the next support in line.
RSI is sitting at 39.09, below its moving average of 44.10, both under the neutral 50 mark. That combination points to momentum still leaning bearish, consistent with a chart that just broke down rather than one setting up for an immediate reversal.
Support and Resistance Levels (1H Chart)
| Level Type | Price |
| Resistance 3 | $0.00000368 |
| Resistance 2 | $0.00000341 |
| Resistance 1 | $0.00000325 |
| Support 1 | $0.00000301 |
| Support 2 | $0.00000287 |
Bonk EMA Levels (1H Chart)
| EMA | Price |
| 21 EMA | $0.00000326 |
| 55 EMA | $0.00000327 |
| 200 EMA | $0.00000315 |
Bonk Price Prediction: Bull, Base, and Bear Scenarios
| Scenario | Setup | Level |
| Bull Case | Gap fills, resistance clears on a confirmed close with volume | $0.00000341, then $0.00000368 |
| Base Case | Price chops between the gap zone and resistance without a clear break | Range-bound between $0.00000301 and $0.00000325 |
| Bear Case | Rejection at resistance, break below the gap support zone | $0.00000301, with risk toward $0.00000287 |
Glossary
A fair value gap shows up when price moves so fast in one direction that a chunk of the range never actually gets traded, leaving a visible gap on the chart.
Markets have a habit of circling back to fill these before deciding their next real direction, which is exactly the setup playing out on $BONK right now.
An ascending channel breakdown is what happens when price finally slips below the rising trendline it had been respecting, and it's often the first sign that the structure driving a move higher has run out of steam, at least for now.
A small death cross is a minor version of a shorter moving average dipping below a longer one, more of a caution flag than a confirmed reversal, and one showed up on this chart right around the breakdown.
RSI stays useful here too, the same 0-to-100 momentum gauge used across these breakdowns, and right now it's sitting under 50, which lines up with the bearish tone of the last few candles.
Bonk vs Bitcoin
BONK's breakdown looks driven by its own channel structure rather than anything specific happening with Bitcoin price today right now.
Meme coins like $BONK do tend to amplify Bitcoin's broader direction, though, so a steady or rising Bitcoin would make a gap-fill bounce easier to pull off, while a weak Bitcoin session would likely add extra pressure on top of BONK's own breakdown.
Expert Opinion
Traders following this setup note that a channel breakdown paired with a fair value gap is a fairly common combination, and price filling that gap before deciding its next move is the base-case expectation rather than an exception.
The volume spike flagged today adds a bit of extra weight to whichever direction $BONK eventually picks, since moves on higher volume tend to hold up better than ones that fade quietly.
Disclaimer: This Bonk price prediction is based on technical chart analysis and current market data and should not be treated as financial advice. Cryptocurrency markets are highly volatile, and actual price movements may deviate significantly from projected scenarios. Support and resistance levels discussed represent probability zones, not guaranteed outcomes, and downside risk exists at every stage of this analysis. Readers should conduct independent research before making investment decisions.
0
0


 すべての暗号通貨、NFT、DeFiを1か所から管理
開始に使用しているポートフォリオを安全に接続します。


